. 2020 Jun 23;3(8):e202000640.
doi: 10.26508/lsa.202000640. Print 2020 Aug.

EBV renders B cells susceptible to HIV-1 in humanized mice

Affiliations

EBV renders B cells susceptible to HIV-1 in humanized mice

Donal McHugh et al. Life Sci Alliance. .

Abstract

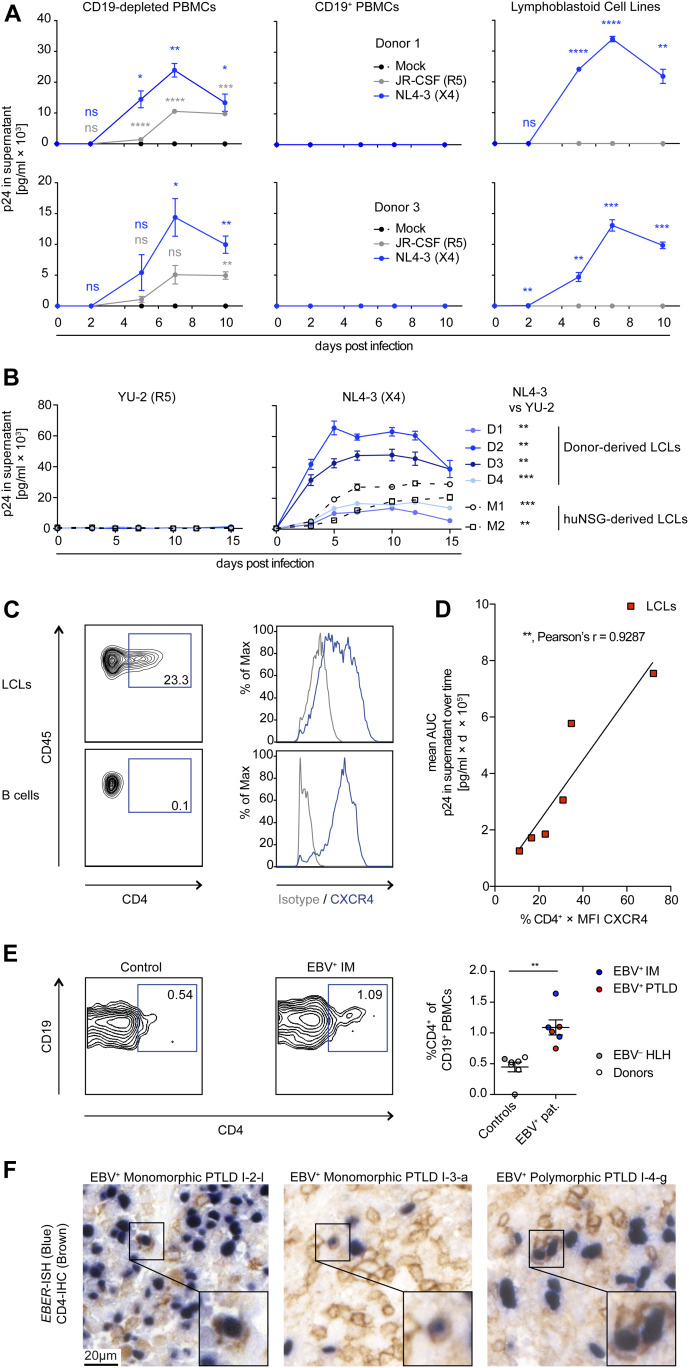
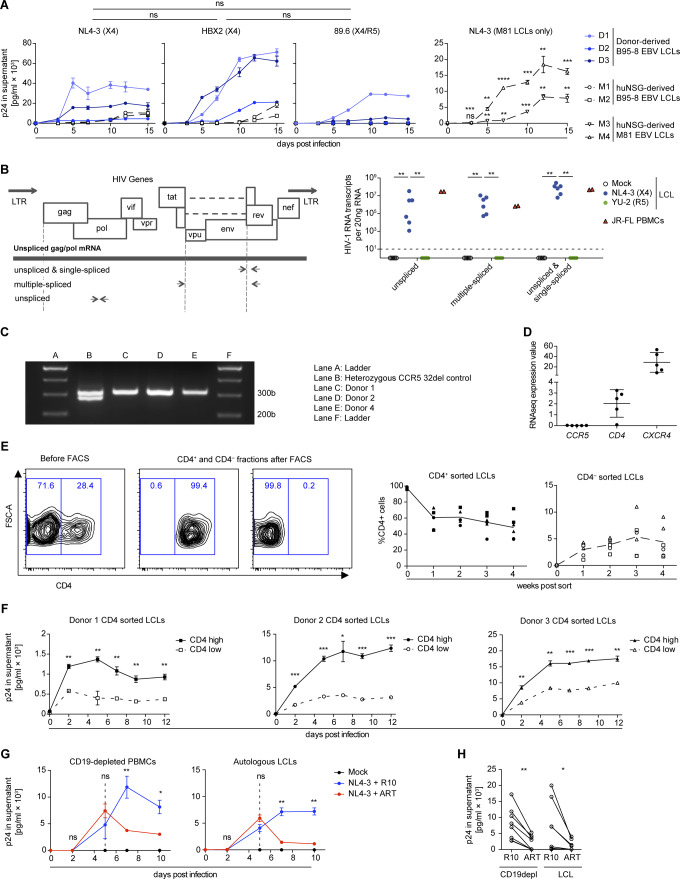
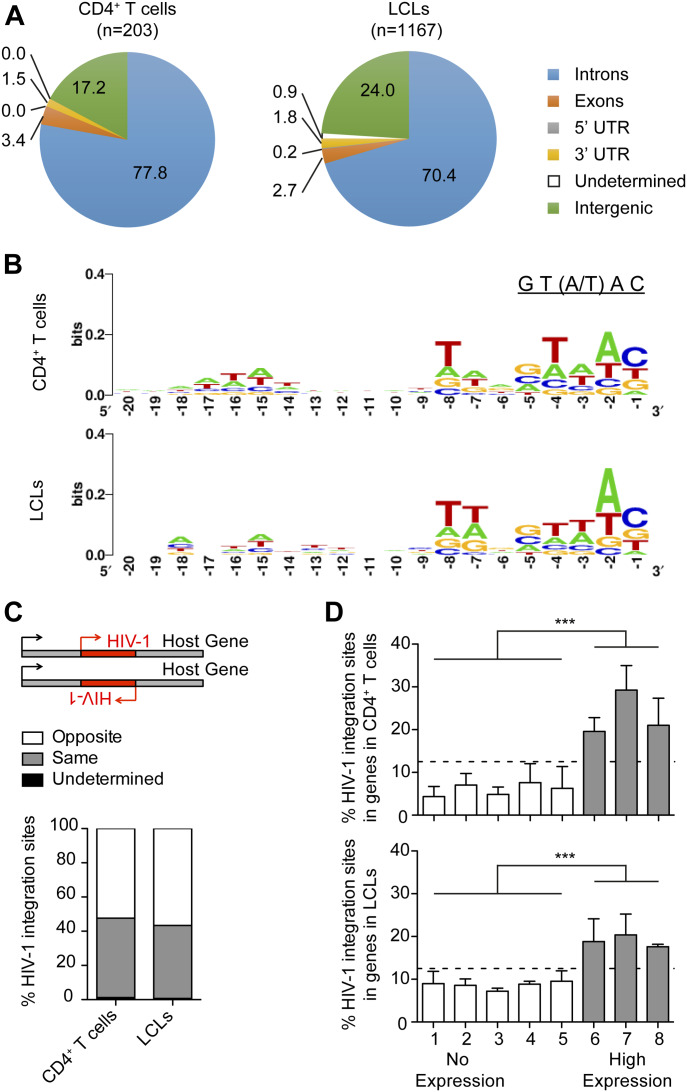
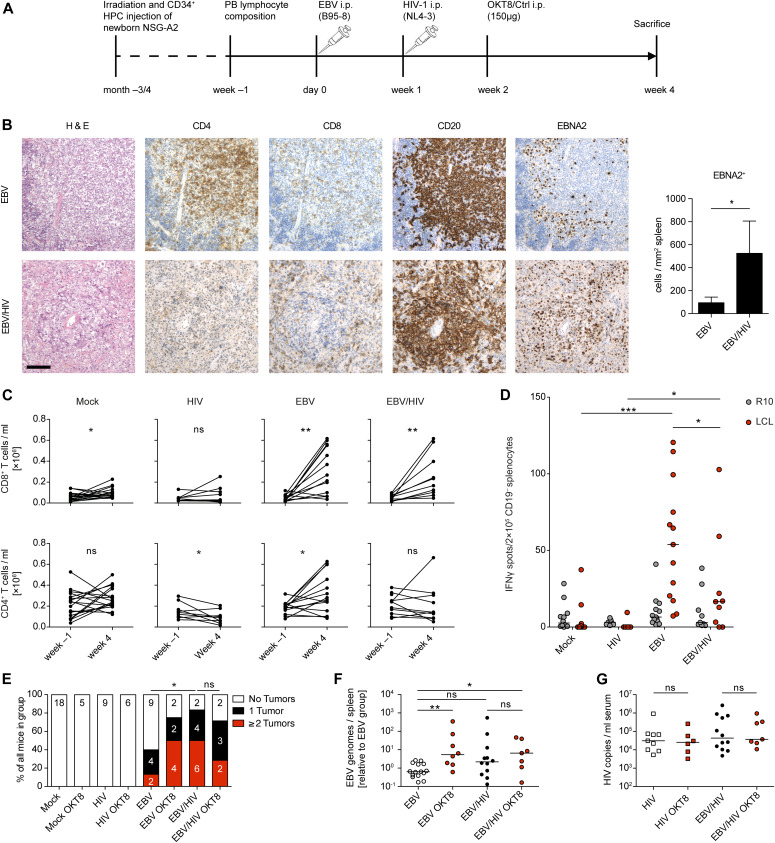
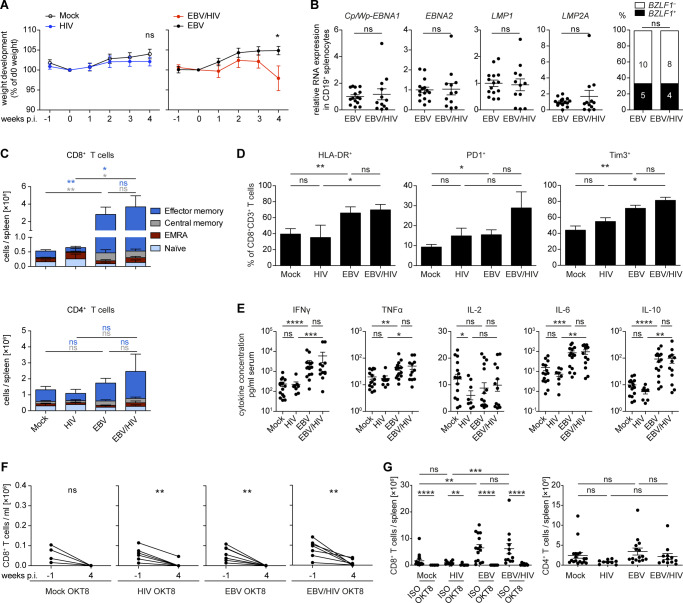
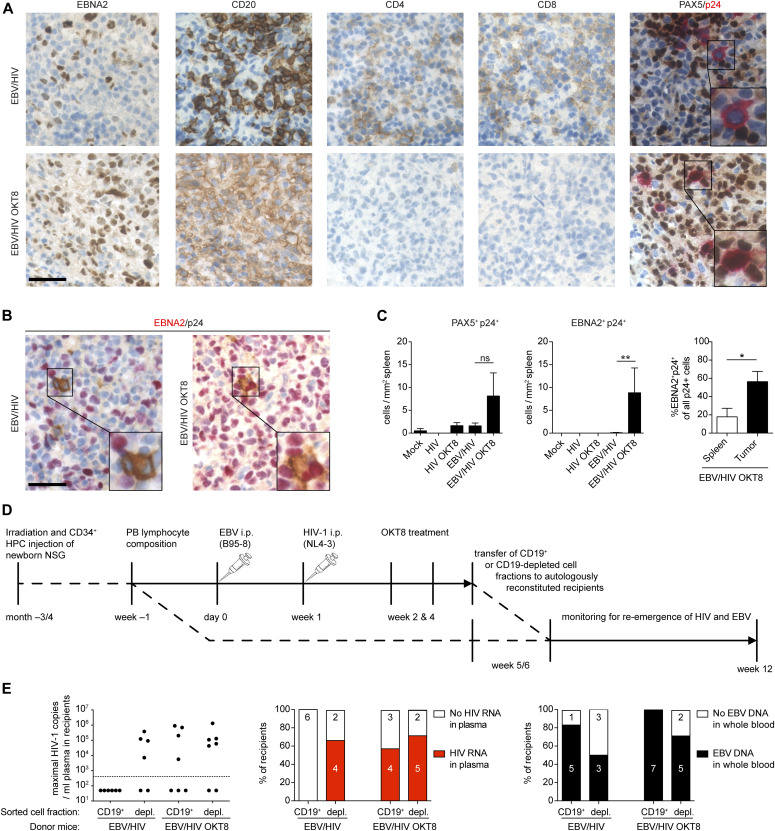
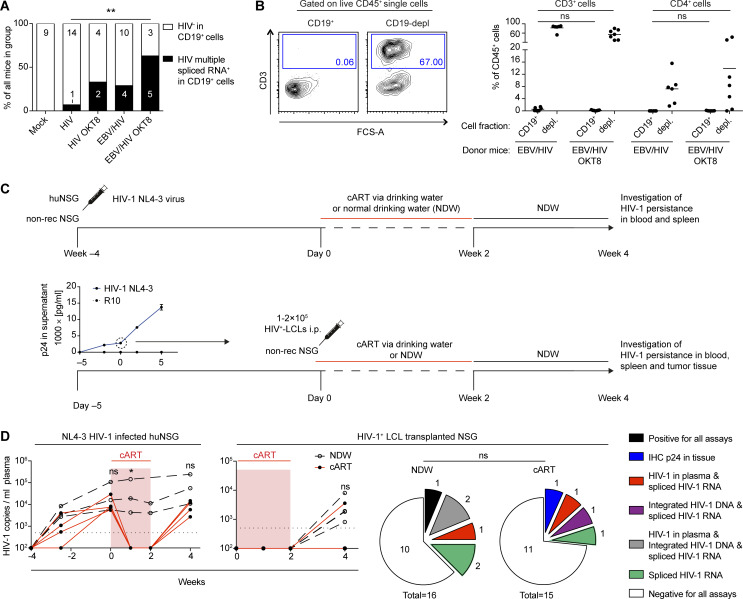
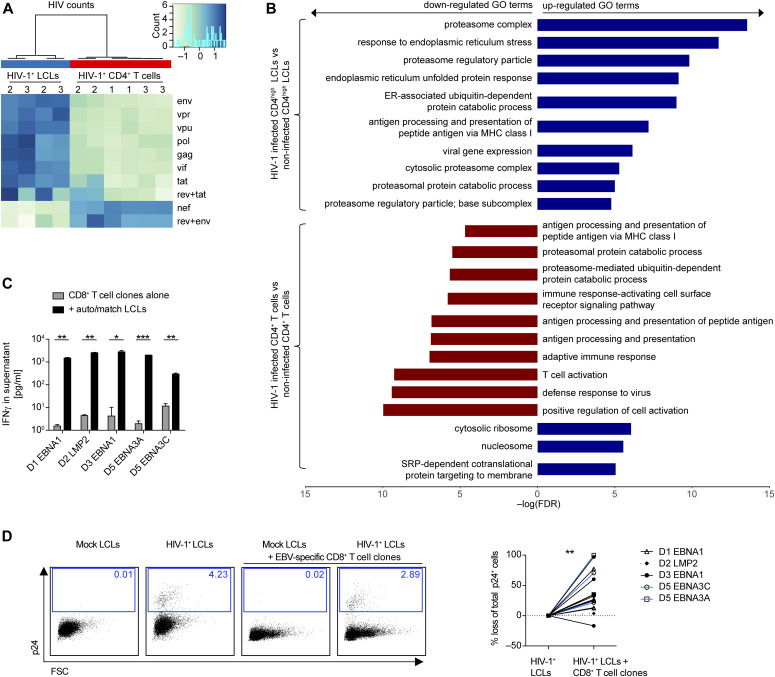
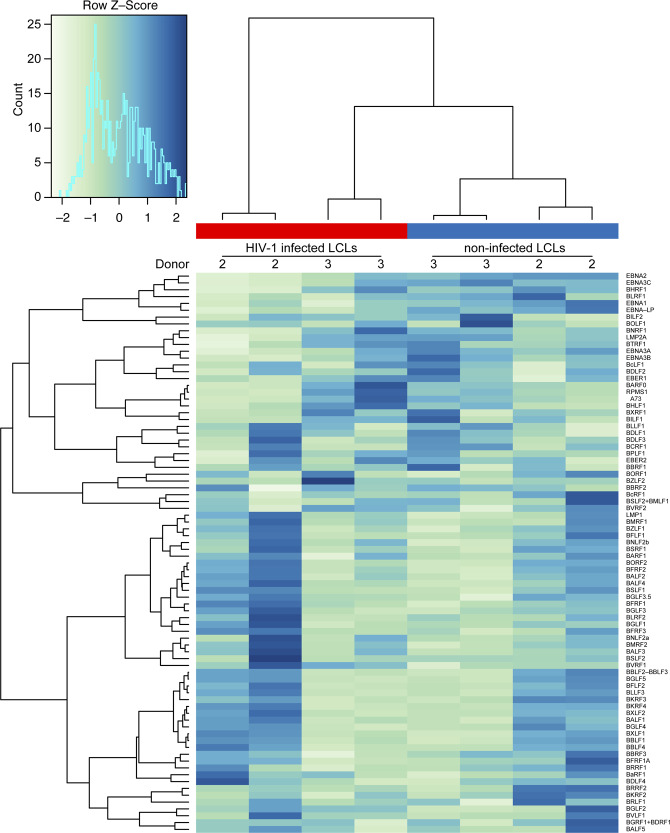
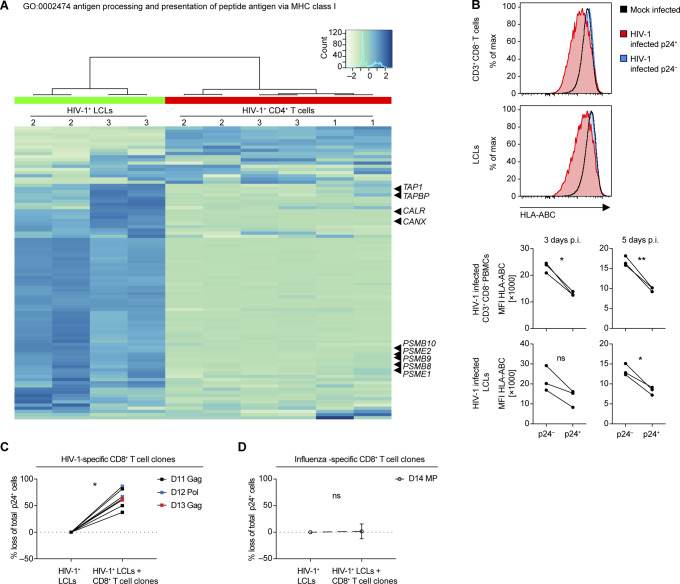
HIV and EBV are human pathogens that cause a considerable burden to worldwide health. In combination, these viruses are linked to AIDS-associated lymphomas. We found that EBV, which transforms B cells, renders them susceptible to HIV-1 infection in a CXCR4 and CD4-dependent manner in vitro and that CXCR4-tropic HIV-1 integrates into the genome of these B cells with the same molecular profile as in autologous CD4+ T cells. In addition, we established a humanized mouse model to investigate the in vivo interactions of EBV and HIV-1 upon coinfection. The respective mice that reconstitute human immune system components upon transplantation with CD34+ human hematopoietic progenitor cells could recapitulate aspects of EBV and HIV immunobiology observed in dual-infected patients. Upon coinfection of humanized mice, EBV/HIV dual-infected B cells could be detected, but were susceptible to CD8+ T-cell-mediated immune control.


Conflict of interest statement

RF Speck and R Myburgh are shareholders of Transcure Bioservices (http://www.transcurebioservices.com/), a service provider using HIV-1–infected humanized mice for preclinical drug testing. The remaining authors have declared that no conflict of interest exists.

Figures

Figure 1.
Figure 1.. X4-tropic HIV-1 replicates in EBV-transformed B cells in vitro.
(A) Quantification of p24 via ELISA in supernatants collected over 10 d from in vitro HIV-1–infected CD19+ B-cell–depleted PBMCs, purified CD19+ B cells and lymphoblastoid cell lines (LCLs) from two donors. Cells were either mock-infected, infected with JR-CSF (R5-tropic HIV-1), or NL4-3 (X4-tropic HIV-1). Data from two donors are depicted. Adjusted P-value summaries for comparison of NL4-3 and JR-CSF versus Mock are indicated in blue and grey, respectively, from two-tailed unpaired t tests, corrected by the Holm–Sidak method. (B) Quantification of p24 in supernatants collected over 15 d from HIV-1–infected LCLs derived from four donors and two EBV-infected humanized mice reconstituted with fetal liver-derived CD34+ cells. Cells were infected with YU-2 (R5-tropic HIV-1) or NL4-3. The area under the curve (AUC, p24 in the supernatant versus time postinfection) was compared via two-tailed unpaired t test with Welch’s correction. (C) Representative flow cytometry plots and histograms of LCLs and autologous purified B cells stained for CD45, CD4, and CXCR4. (D) Correlation of NL4-3 HIV-1 replication in different LCLs with the level of CXCR4 and CD4 surface expression before infection. HIV-1 replication was approximated via analyzing the AUC for each LCL as shown in (B). Relative surface expression of HIV entry receptors for each LCL was approximated by multiplying the frequency of CD4+ cells with the median fluorescence intensity of CXCR4 as determined by flow cytometry immune phenotyping. Correlation, **P = 0.0074, Pearson’s r = 0.9287. (E) Representative flow cytometry immune phenotyping logarithmic contour plots and quantification of CD4 surface expression on CD19+ B cells from controls (healthy blood donors and 1 EBV hemophagocytic lymphohistiocytosis [HLH] patient) and EBV+ infectious mononucleosis or EBV+ posttransplant lymphoproliferative disorder (PTLDs) patients. Events were pre-gated on single cells/lymphocytes/CD3/CD19+ cells. **P = 0.001 (Mann–Whitney test). (F) Dual EBER in situ hybridization (blue) CD4 immunohistochemistry (IHC, brown) on tissue microarrays of two cases of EBV+ PTLD. I-2-l and I-3-a are separate sections from the same PTLD. Scale bar: 20 μm. Inserts are a 2× magnification of a section of the main image. In (A, B, C), data are represented as mean ± SEM and were performed in triplicate. Results representative of four donors. P-values are reported as ns > 0.05, * < 0.05, ** < 0.01, *** < 0.001, **** < 0.0001.
Figure S1.
Figure S1.. HIV-1 infects lymphoblastoid cell lines (LCLs) in a X4- and CD4-dependent manner.
(A) Quantification of p24 by ELISA in supernatants collected from in vitro NL4-3, HBX2, and 89.6 HIV-1–infected LCLs. The mean AUC (p24 in the supernatant versus time postinfection) from five LCLs was compared via the Mann–Whitney test. M81 EBV LCLs derived from EBV-infected humanized mice generated from two individual human fetal liver donors. Adjusted P-value summaries for comparison of NL4-3–infected M81 LCLs versus Mock are depicted from two-tailed unpaired t tests, corrected by the Holm–Sidak method. Data are represented as mean ± SEM and were performed in triplicates. (B) Wild-type HIV-1 gene map showing position of primers used to detect unspliced, single-spliced, and multiple-spliced HIV-1 mRNA transcripts (left). Quantification of HIV-1 RNA transcripts per 20 ng of RNA in six LCLs (four derived from donors and two from EBV-infected humanized mice) and one PBMC donor was performed 15 d postinfection (right). LCLs were infected with X4-tropic NL4-3 and R5-tropic YU-2 HIV-1 strains, and control PBMCs were infected with JR-FL R5-tropic HIV-1 strain (two-tailed Fischer’s exact test for presence versus absence of HIV-1–specific transcripts). (C) Representative PCR results for genotyping CCR5 alleles in LCLs donors used in this study. Amplification of the homozygous wild-type allele (CCR5+/+) results in a single band of 311 bp. Amplification of the heterozygous allele (CCR5+/delta32) results in two bands of 311 and 279 bp. (D) Mean expression values as determined by RNA-seq for CCR5, CD4, and CXCR4 transcripts in five different LCLs (two humanized mice-derived and three donor-derived LCLs) are plotted. Each plotted value is the mean expression value (=RPKM) from three biological replicates (RNA sequencing data from McHugh et al (53)). (E) Sorted CD4+ and CD4 LCLs populations and subsequent quantification of the frequency of CD4 surface expression over 4 wk of in vitro culture. Two independent experiments with three donors; means are indicated with connecting lines. (F) Quantification of p24 by ELISA in supernatants collected from in vitro NL4-3 HIV-1–infected CD4 high and CD4 low LCLs from three donors. The infection was performed in triplicate 4 wk after sorting for CD4. Data are represented as mean ± SEM. Adjusted P-value summaries for comparison of CD4 high versus low LCLs are depicted from two-tailed unpaired t tests, corrected by the Holm–Sidak method. (G) Anti-retroviral treatment (ART) of in vitro NL4-3 HIV-1–infected LCLs and autologous CD19+ B-cell–depleted PBMCs. 5 d postinfection, the cells were treated with AZT and Efaverenz or medium (R10). Data are represented as mean ± SEM and were performed in triplicate. Results are representative of four donors. Adjusted P-value summaries for comparison of ART-treated versus R10 treated are depicted from two-tailed unpaired t tests, corrected by the Holm–Sidak method. (H) Summary of mean p24 concentrations in culture supernatants of HIV-1–infected LCLs and autologous CD19-depleted PBMCs cultured in R10 with or without ART treatment. CD19depl **P = 0.001; LCL *P = 0.049 (two-tailed paired t test). (A, B, F, H) *P < 0.05, **P < 0.01, ***P < 0.001, ****P < 0.0001.
Figure 2.
Figure 2.. X4-tropic HIV-1 host genome integration profile in lymphoblastoid cell lines (LCLs) and autologous T cells.
(A) Distribution of HIV-1 integration sites in the host genome comparing CD4+ T cells and autologous LCLs 2 d post in vitro infection with NL4-3 (n = number of integration sites). (B) Nucleotide sequence consensus upstream of HIV-1 5′LTR in the host genome. (C) Transcription orientation of intragenic HIV-1 relative to the host gene. HIV-1 integration events in loci of transcript variants or more than one gene with different features of interest are classified as undetermined. (D) Frequency of HIV-1 integrations in genes of autologous donor CD4+ T cells and LCLs. Host genes in noninfected LCLs and CD4+ T cells were ranked from non-expressed to highly expressed genes based on reads per kilobase of RNA transcript per million mapped reads (RPKM). The host genes were grouped into eight bins of equal size based on RPKM. Only the grey bins contain genes with an RPKM value greater than 0. The relative distribution of the total HIV-1 integration sites among the eight bins is summarized for the CD4+ T cells and LCLs. ***P < 0.0001 (Chi-squared test). (A, B, C, D) Data derived from three donors: two LCLs and three CD4+ T cells each with two separate HIV-1 or mock infections; two of the T cells were autologous to the investigated LCLs.
Figure 3.
Figure 3.. EBV/HIV dual-infection of humanized mice.
(A) Experimental setup: newborn NSG-A2 mice were irradiated and received intrahepatic injection of human CD34+ hematopoietic progenitor cells. Before infection, baseline blood lymphocyte composition was determined by flow cytometry and mice were grouped. At day 0, mice were infected i.p. with EBV or PBS and 1 wk later with HIV-1 or PBS. At week 2 post-infection, mice received a single injection of a CD8-depleting monoclonal antibody (OKT8) or an isotype control antibody. In one experiment, mice were left untreated. Mice were euthanized 4 wk post-EBV infection. (B) Representative histological panel of formalin-fixed, paraffin-embedded spleen sections from EBV and EBV/HIV–infected huNSG-A2 mice depicting H&E, CD4, CD8, CD20 and EBNA2 IHC stainings. Scale bar: 100 μm. Quantification of EBNA2+ cells per square millimeter with n = 7 and 5 mice, respectively. *P = 0.030 (Mann–Whitney test, MWT). (C) Number of CD8+ and CD4+ T cells per ml blood at week −1 and at week 4. Mock; CD8+ *P = 0.049. HIV; CD4+ *P = 0.042. EBV; CD8+ **P = 0.001 and CD4+ *P = 0.021. EBV/HIV; CD8+ **P = 0.007 (two-tailed paired t test). (D) EBV-specific T cell ELISpot assay. Mean IFNγ release was quantified upon co-culture of CD19-depleted splenocytes derived from humanized mice of the indicated groups with autologous EBV-transformed B cells (lymphoblastoid cell lines or LCLs) or medium (R10). Mock versus EBV ***P < 0.001; HIV versus EBV/HIV *P = 0.013; EBV versus EBV/HIV *P = 0.045 (MWT). (E) Presence of macroscopically visible EBV-associated tumors in animals from the indicated experimental groups. *P = 0.016 (MWT for tumor score). (F) Total splenic EBV DNA burden was determined for each mouse by qPCR for EBV BamHI W fragment and plotted relative to EBV-infected animals. EBV versus EBV OKT8 treated *P = 0.005; EBV versus EBV/HIV P = 0.060; EBV versus EBV/HIV OKT8 treated **P = 0.035; EBV/HIV versus EBV/HIV OKT8 treated P = 0.583 (MWT). (G) Serum HIV RNA copy numbers were determined by RT-qPCR at week 4 (MWT). (B, C, D, E, F, G) Represents pooled data from three experiments. (F, G) Individual values for each mouse and median are depicted.
Figure S2.
Figure S2.. Characteristics of humanized mice during EBV/HIV dual-infection.
(A) Weight development comparing Mock versus HIV P = 0.326 and EBV versus EBV/HIV *P = 0.029—infected mice relative to day 0 and up to week 4 post EBV infection (two-tailed unpaired t test at week 4). (B) Quantification of EBV transcripts Cp/Wp-EBNA1 P = 0.608, EBNA2 P = 0.643, LMP1 P = 0.714, and LMP2A P = 0.696 via RT-qPCR in CD19+ splenocytes of EBV-infected and EBV/HIV–infected mice. Data normalized to the mean of the EBV group values (Mann–Whitney test [MWT]). Frequency of detection of the BZLF1 transcript in CD19+ B cells from individual mice (Fischer’s exact test). (C) Differentiation status of splenic CD8+ and CD4+ T cells at termination. Mean ± SEM total number of CD8+ and CD4+ T cells per spleen is shown. Effector Memory: CD62L CD45RA. Central Memory: CD62L+ CD45RA. EMRA: CD62L CD45RA+. Naive: CD62L+ CD45RA+ (MWT for Central and Effector Memory). (D) Frequency of HLA-DR, PD1, and Tim3 surface expression on splenic CD8+ T cells at 4 wk post EBV infection (MWT). (E) Quantification of cytokines in the serum of mice 4 wk post EBV infection (MWT). (F) Number of CD8+ T cells per ml blood for individual mice at week −1 and week 4 in mice that received OKT8 treatment at week 2. Mock OKT8: P = 0.064. HIV OKT8: **P = 0.003. EBV OKT8: **P = 0.002. EBV/HIV OKT8: **P = 0.006 (two-tailed paired t test). (G) Absolute numbers of CD8+ and CD4+ T cells per spleen in mice from different experimental groups were quantified at week 4 (MWT). (A, B, C, D, E, F, G) Data pooled from two to four experiments and in (A, B, C, D, E, G) represented as mean ± SEM, ns P > 0.05, *P < 0.05, **P < 0.01, ***P < 0.001, ****P < 0.0001.
Figure 4.
Figure 4.. EBV/HIV dual-infected humanized mice replicate HIV-1 in B cells.
(A) Representative IHC stainings of EBNA2, CD20, CD4, CD8, and co-IHC for PAX5 (brown, nuclear stain) and p24 (red, cytoplasmic stain) of formalin-fixed, paraffin-embedded spleen sections from EBV/HIV–infected and EBV/HIV–infected OKT8-treated mice (EBV/HIV OKT8). (B) Representative co-immunohistochemistry stainings for EBNA2 (red, nuclear staining) and p24 (brown, cytoplasmic staining). (A, B) Scale bar: 40 μm. Inserts are a 2× magnification of a section of the main image. (C) Quantification of PAX5+/p24+ (left) and EBNA2+/p24+ (mid) cells in the spleen from the indicated experimental groups and EBNA2+/p24+ as % of total p24+ (right) cells in non-tumorous spleen and tumor tissue within the EBV/HIV OKT8 group. N = respectively; Mock: 4 & 5, HIV: 6 & 3, HIV OKT8: 7 & 5, EBV/HIV: 14 & 12, EBV/HIV OKT8: 15 & 14, “Spleen”: 5, “Tumor”: 4. PAX5+/p24+ P = 0.112; EBNA2+/p24+: **P = 0.006, Spleen versus Tumor: *P = 0.032 (Mann–Whitney test). (D) Experimental setup for cell fraction transfer assay: Newborn NSG mice were irradiated and transplanted with fetal liver derived CD34+ hematopoietic progenitor cells. Donor mice were infected with EBV and 1 wk later with X4-tropic HIV-1. At week 2 and 4, donor mice either received the CD8-depleting antibody (OKT8) treatment or PBS. At week 5 or 6, the donors were sacrificed, and splenic lymphocytes were MACS separated into CD19+ and CD19-depleted fractions. Recipient mice received either CD19+ or CD19-depleted cells i.p. from either EBV/HIV or EBV/HIV OKT8-treated mice. Recipient mice were monitored up to week 12 for HIV-1 RNA in plasma and for EBV DNA in whole blood. (E) The highest number of HIV-1 RNA copies measured in plasma of individual-recipient mice and the frequency of recipients with detectable HIV RNA in the plasma and EBV DNA in the peripheral blood after receiving either CD19+ or CD19-depleted cells from either EBV/HIV or EBV/HIV OKT8-treated donor mice.
Figure S3.
Figure S3.. Characteristics of CD19 MACS-purified cell fractions and EBV-transformed B cells as a HIV-1–putative reservoir during combined anti-retroviral therapy (cART) treatment in vivo.
(A) Frequency of detection of HIV-1 multiple spliced transcripts via RT-qPCR in CD19+ B cells from individual-mice from the indicated experimental groups. HIV versus EBV/HIV OKT8 **P = 0.009. Data pooled from four experiments (two-tailed Fisher’s exact test of raw numbers). (B) Representative flow cytometry plots (left) indicating T-cell content in CD19+ and CD19-depleted (depl.) MACS purified splenocyte fractions and quantification (right) from all mice used as donors for experiments presented in Fig 4 (Mann–Whitney test). (C) Scheme of in vivo HIV-1 latency model. Top (controls): At week −4 humanized mice (huNSG) and non-reconstituted NSG mice were infected with NL4-3 live virus preparations. cART (Abacavir, Lamivudine, Dolutegravir) was administered to a subset of huNSG via the drinking water MediDrop Sucralose solution starting on day 0 for 2 wk. The remaining huNSG mice received normal drinking water (NDW) for 2 wk, after which, all mice received NDW for another 2 wk. Bottom: Quantification of p24 by ELISA in supernatants collected from the ex vivo NL4-3 HIV-1–infected lymphoblastoid cell lines (LCLs) (confirmed as B cells via RNA-seq) used for transfer into mice at day 0. cART (Abacavir, Lamivudine, Dolutegravir) was administered to half the mice via the drinking water in Medidrop-sucralose solution starting on day 0 for 2 wk, after which all mice received NDW for another 2 wk. (D) Left: Number of HIV-1 RNA copies/ml in the plasma of cART treated and control (NDW) huNSG mice and cART treated and control HIV-1+ LCL transplanted NSG mice (Mann–Whitney test). Right: Summary of HIV-1 detection data from cART-treated and control NSG mice transplanted with HIV-1+ LCLs, including HIV-1 RNA copies in plasma, p24 immunohistochemistry (IHC) of tissue, integrated HIV-1 DNA (HIV-1 Alu-PCR integration assay), and spliced HIV-1 RNA (HIV-1 specific spliced transcripts via RT-qPCR). Data from two individual experiments (Fischer’s exact test for positive versus negative outcome in any assay).
Figure 5.
Figure 5.. Susceptibility of HIV-1–infected lymphoblastoid cell lines (LCLs) to T-cell clones in vitro.
(A) Heat map depicting the HIV transcriptome in HIV-1–infected LCLs (2 donors) and three PB CD4+ T cells. Two of the CD4+ T cells investigated were autologous to the LCLs. Two separate infections were performed for each cell type. (B) Bar chart depicting selected results from gene set enrichment analysis of HIV-1–infected T cells and LCLs relative to mock-infected controls. (A, B) RNA was extracted 2 d after HIV-1 infection. (C) Reactivity of 5 EBV-specific CD8+ T-cell clones from four donors with or without autologous or HLA-matched LCLs (auto/match) measured by IFNγ ELISA of the culture supernatant. Donor and specificity for EBV protein: D1 EBNA1, D2 LMP2, D3 EBNA1, D5 EBNA3A, and D5 EBNA3C. Mean ± SD (two-tailed unpaired t tests, corrected by the Holm–Sidak method). (D) Representative flow cytometry plots from intracellular staining for p24 of mock-infected LCLs, HIV-1–infected LCLs, mock-infected LCLs mixed with an autologous EBV-specific CD8+ T-cell clone and HIV-1–infected LCLs mixed with an autologous EBV-specific CD8+ T-cell clone indicating percentage of p24-positive of total LCL population. Plots were pre-gated on live, single, total LCLs-labelled before co-culture with a lipophilic membrane dye (PKH67). Specific elimination of p24+ autologous or HLA-matched LCLs by individual EBV-specific CD8+ T-cell clones expressed as percentage loss of % p24+ cells in cocultures with T-cell clones compared with conditions without. Pooled from eight individual experiments, each condition was performed with 2–4 technical replicates (Wilcoxon matched pairs test). (C, D) P-values are reported as ns P > 0.05, *P < 0.05, **P < 0.01, ***P < 0.001.
Figure S4.
Figure S4.. Effect of HIV-1 infection on EBV transcriptome.
Heat map of the EBV transcriptome comparing X4-tropic HIV-1-infected lymphoblastoid cell lines 2 d postinfection and noninfected lymphoblastoid cell lines.
Figure S5.
Figure S5.. Effect of HIV-1 infection in lymphoblastoid cell lines (LCLs) and T cells on genes in the GO set “0002474 antigen processing and presentation of peptide antigen via MHC class I,” HLA class I surface expression and specific elimination of HIV-1 infected LCLs via HIV-1 specific CD8+ T cell clones.
(A) Heat map of relative gene expression in the gene set “GO:0002474 antigen processing and presentation of peptide antigen via MHC class I” of host transcriptome of HIV-infected LCLs and CD4+ T cells. Indicated genes: TAP1 (peptide transporter TAP1), TAPBP (Tapasin), CALR (calreticulin), CANX (calnexin), PSMB10 (Mecl-1), PSME2 (Pa28β), PSMB9 (LMP2), PSMB8 (LMP7), and PSME1 (Pa28α). (B) Representative flow cytometry plots 3 d post HIV-1 infection (top panel) and summary of median fluorescence intensity of HLA class I (pan-A/B/C) detected on the surface of mock-infected or HIV-1–infected (p24 and p24+ populations) CD3+ CD8 T cells and LCLs 3 and 5 d postinfection for three donors (bottom panel) (two-tailed unpaired t test). (C) Specific elimination of p24+ autologous or HLA-matched LCLs by three individual HIV-1–specific CD8+ T-cell clones expressed as percentage loss of total p24+ cells. (D) Specific elimination of p24+ LCLs by influenza-specific CD8+ T-cell clones (Influenza MP [GIL] - specific) expressed as percentage loss of total p24+ cells. Data from two experiments using different (matched) target cells each time. (C, D) ns P > 0.05, *P < 0.05, **P < 0.01 (Wilcoxon matched-pairs test).

References

    1. Cesarman E. (2011) Gammaherpesvirus and lymphoproliferative disorders in immunocompromised patients. Cancer Lett 305: 163–174. 10.1016/j.canlet.2011.03.003 - DOI - PMC - PubMed
    1. Luzuriaga K, Sullivan JL (2010) Infectious mononucleosis. New Engl J Med 362: 1993–2000. 10.1056/nejmcp1001116 - DOI - PubMed
    1. Xu GJ, Kula T, Xu Q, Li MZ, Vernon SD, Ndung’u T, Ruxrungtham K, Sanchez J, Brander C, Chung RT, et al. (2015) Viral immunology. Comprehensive serological profiling of human populations using a synthetic human virome. Science 348: aaa0698 10.1126/science.aaa0698 - DOI - PMC - PubMed
    1. Kutok JL, Wang F (2006) Spectrum of Epstein-Barr virus-associated diseases. Annu Rev Pathol 1: 375–404. 10.1146/annurev.pathol.1.110304.100209 - DOI - PubMed
    1. Douek DC, Roederer M, Koup RA (2009) Emerging concepts in the immunopathogenesis of AIDS. Annu Rev Med 60: 471–484. 10.1146/annurev.med.60.041807.123549 - DOI - PMC - PubMed

Publication types

MeSH terms