. 2020 Jul 29;40(31):5970-5989.
doi: 10.1523/JNEUROSCI.2875-19.2020. Epub 2020 Jun 23.

Discharge and Role of GABA Pontomesencephalic Neurons in Cortical Activity and Sleep-Wake States Examined by Optogenetics and Juxtacellular Recordings in Mice

Affiliations

Discharge and Role of GABA Pontomesencephalic Neurons in Cortical Activity and Sleep-Wake States Examined by Optogenetics and Juxtacellular Recordings in Mice

Youssouf Cissé et al. J Neurosci. .

Abstract

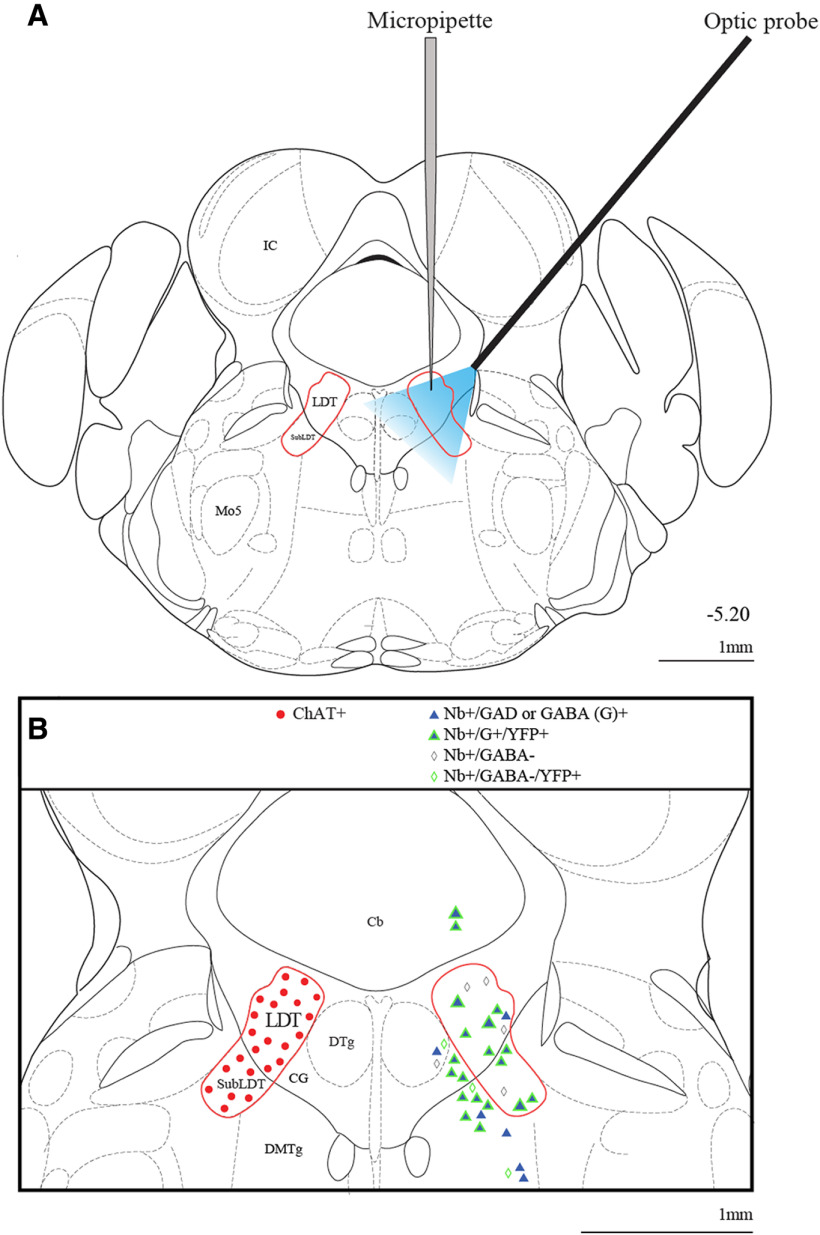
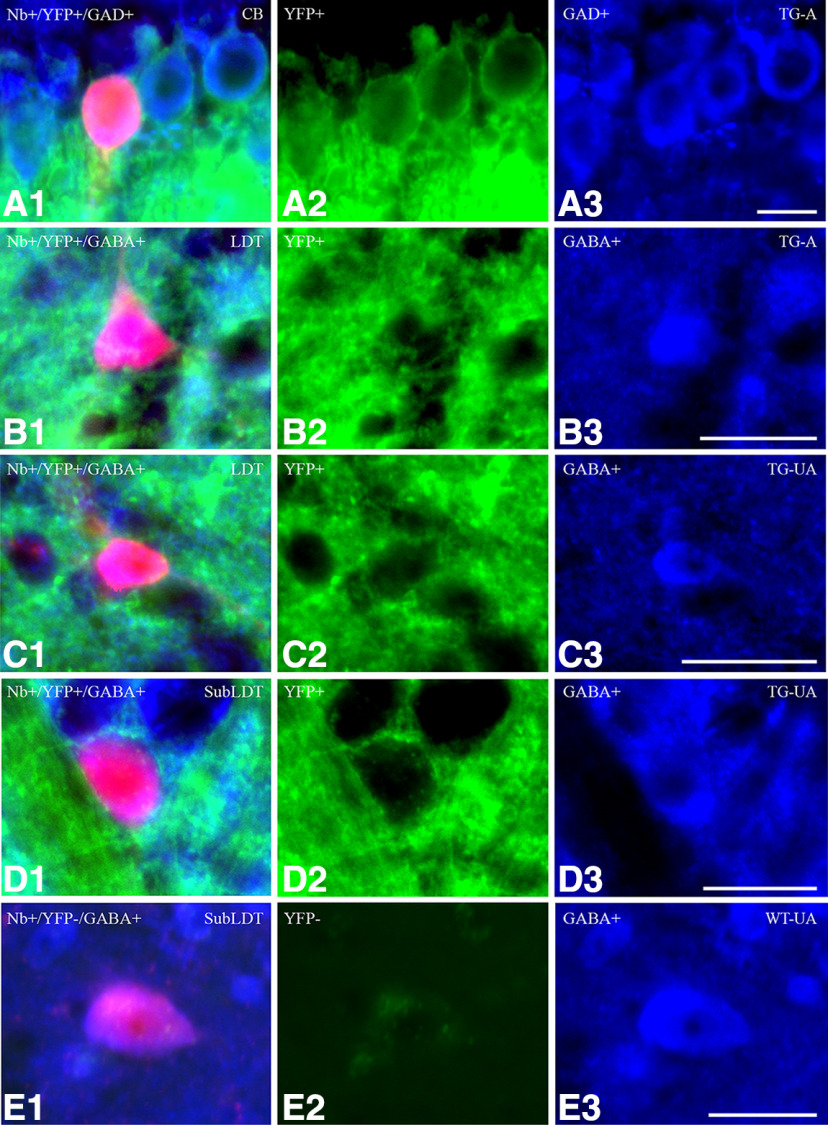
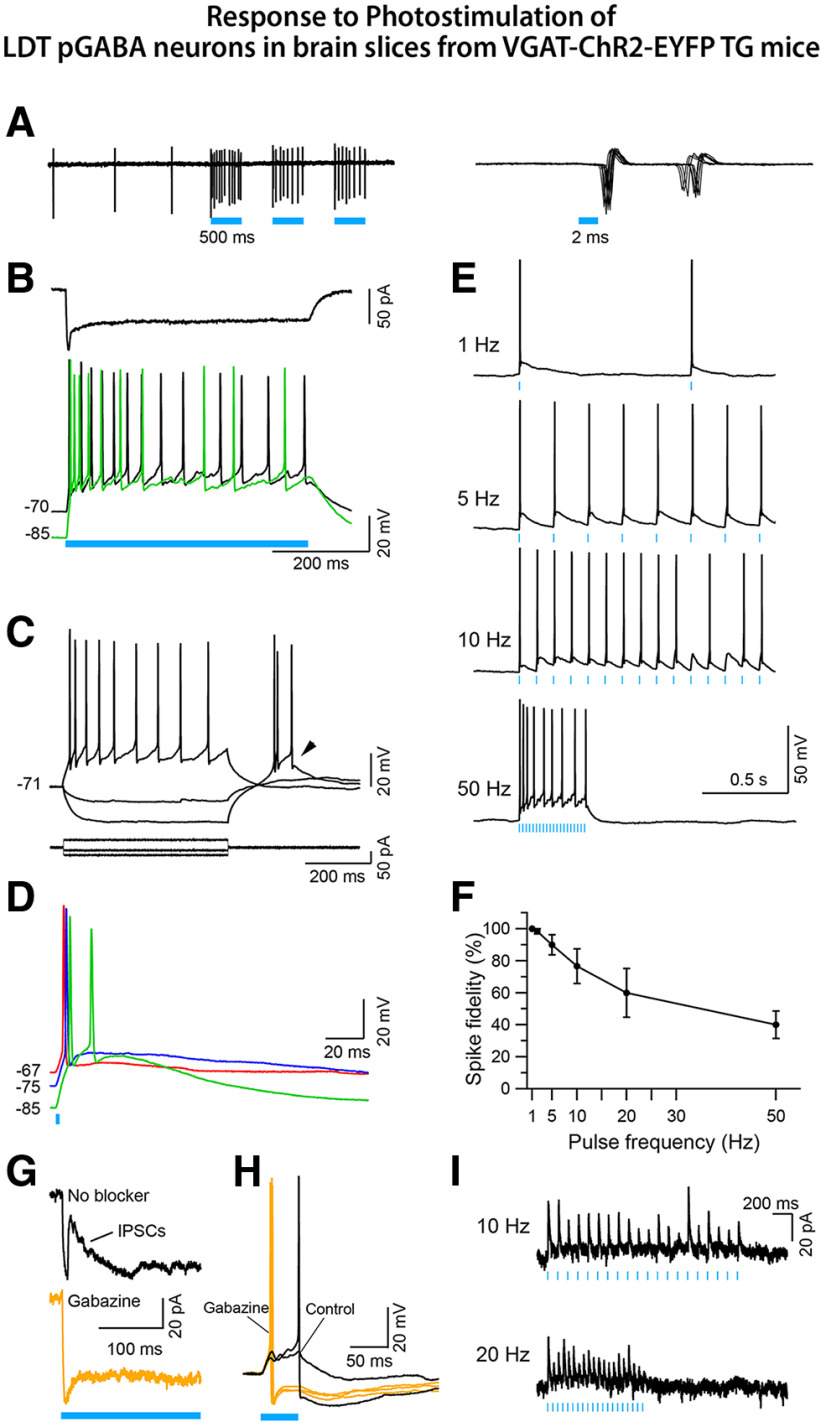
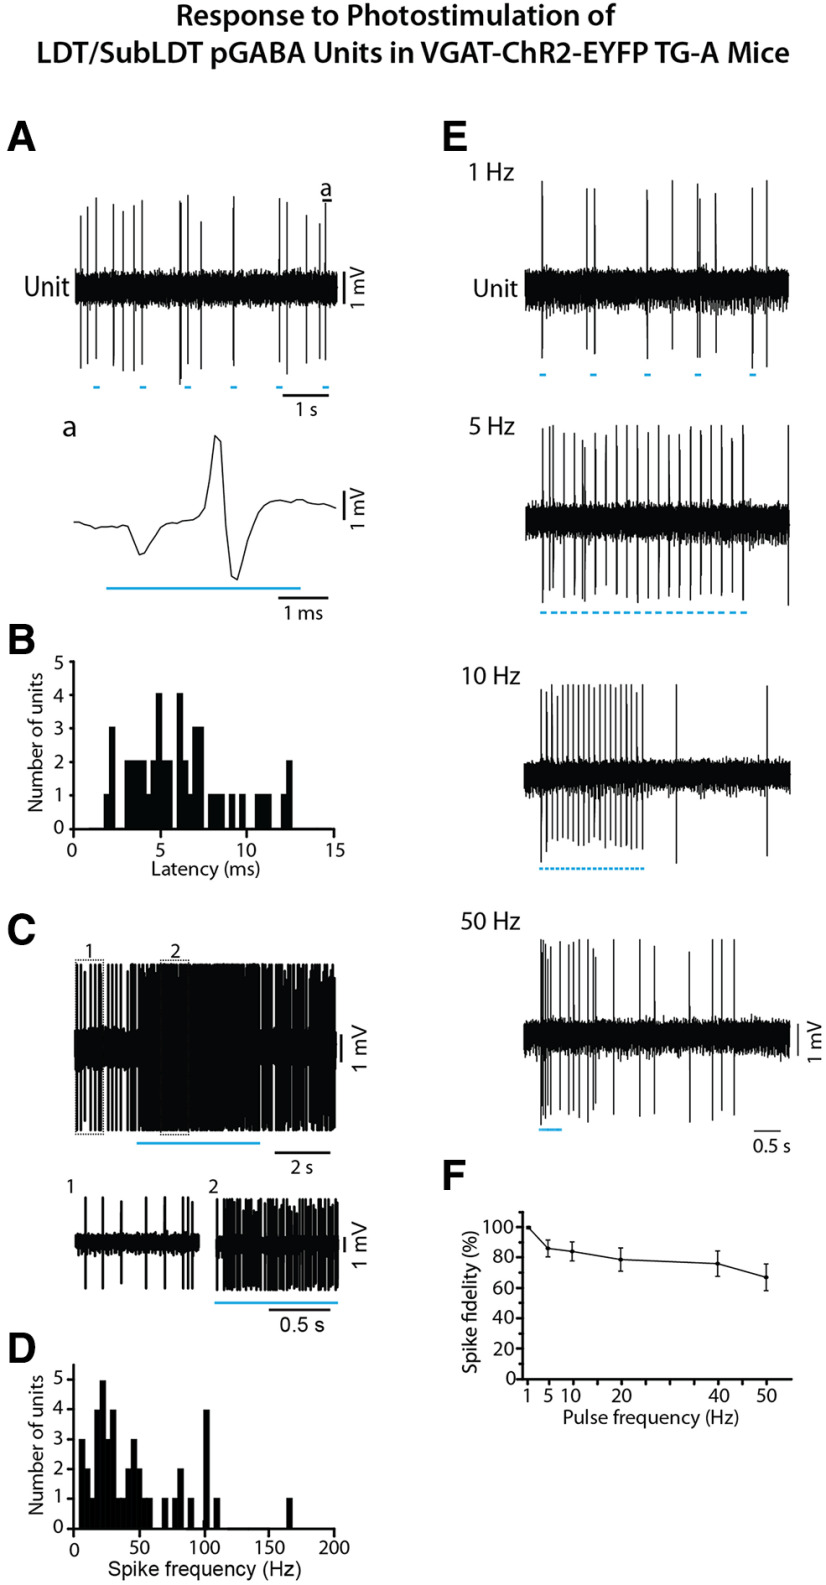
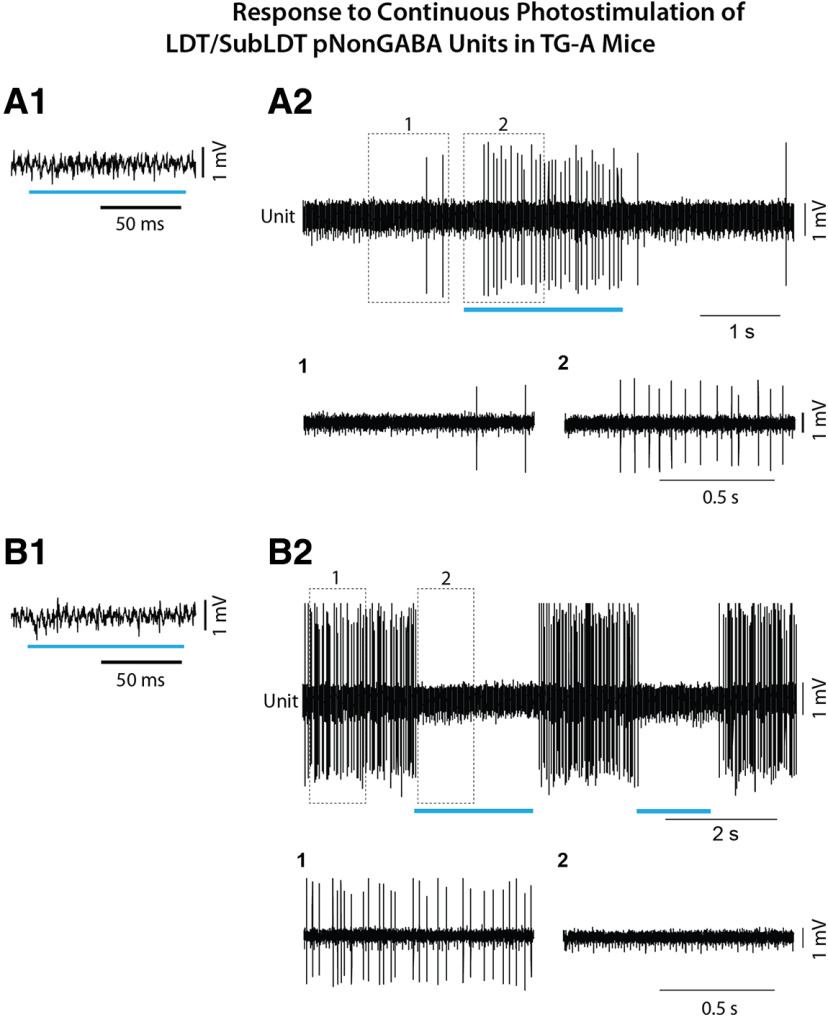
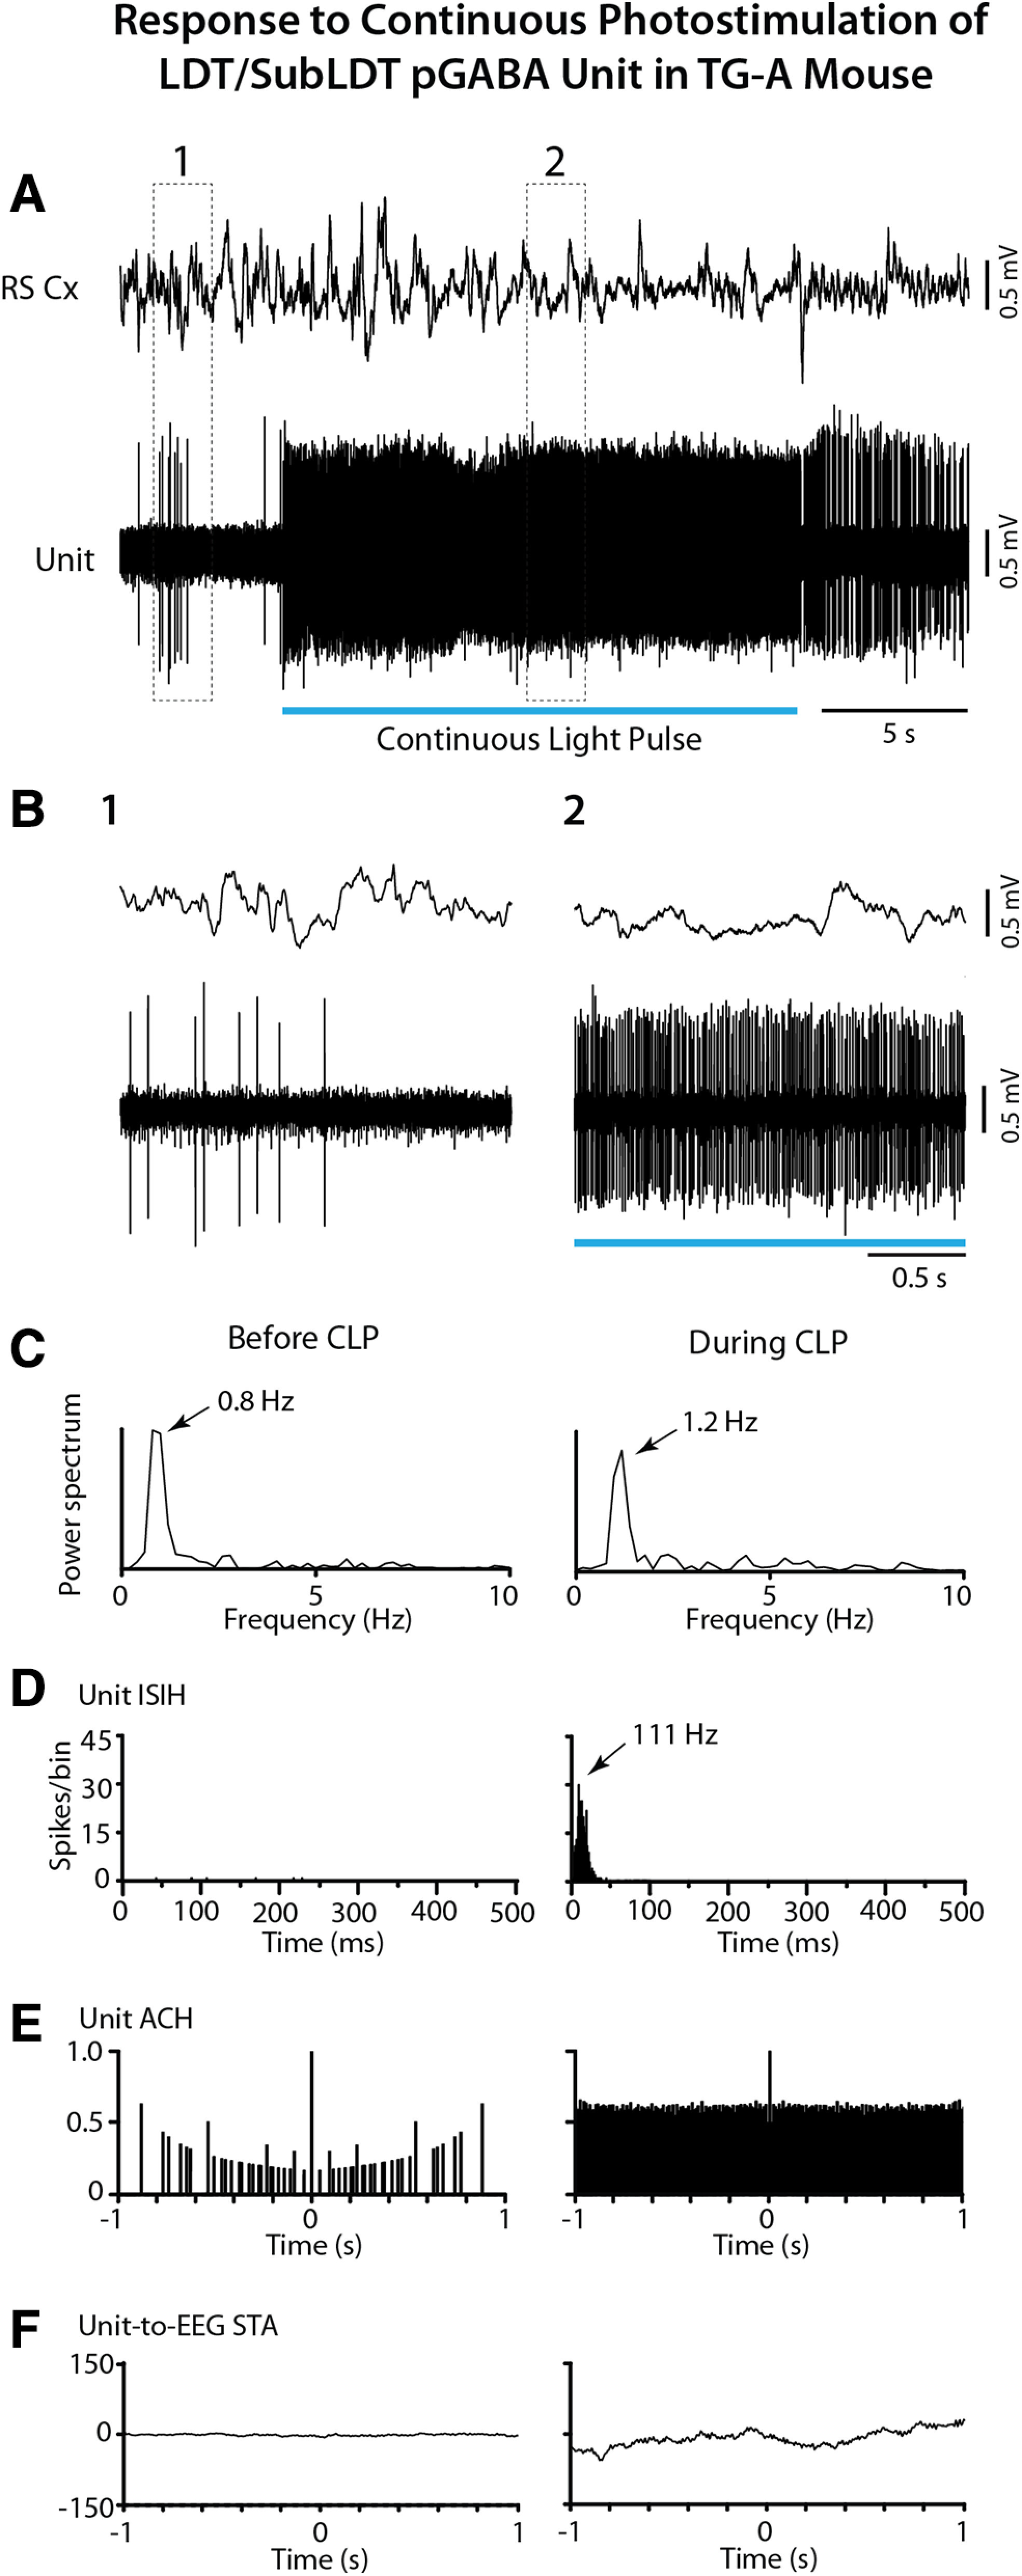
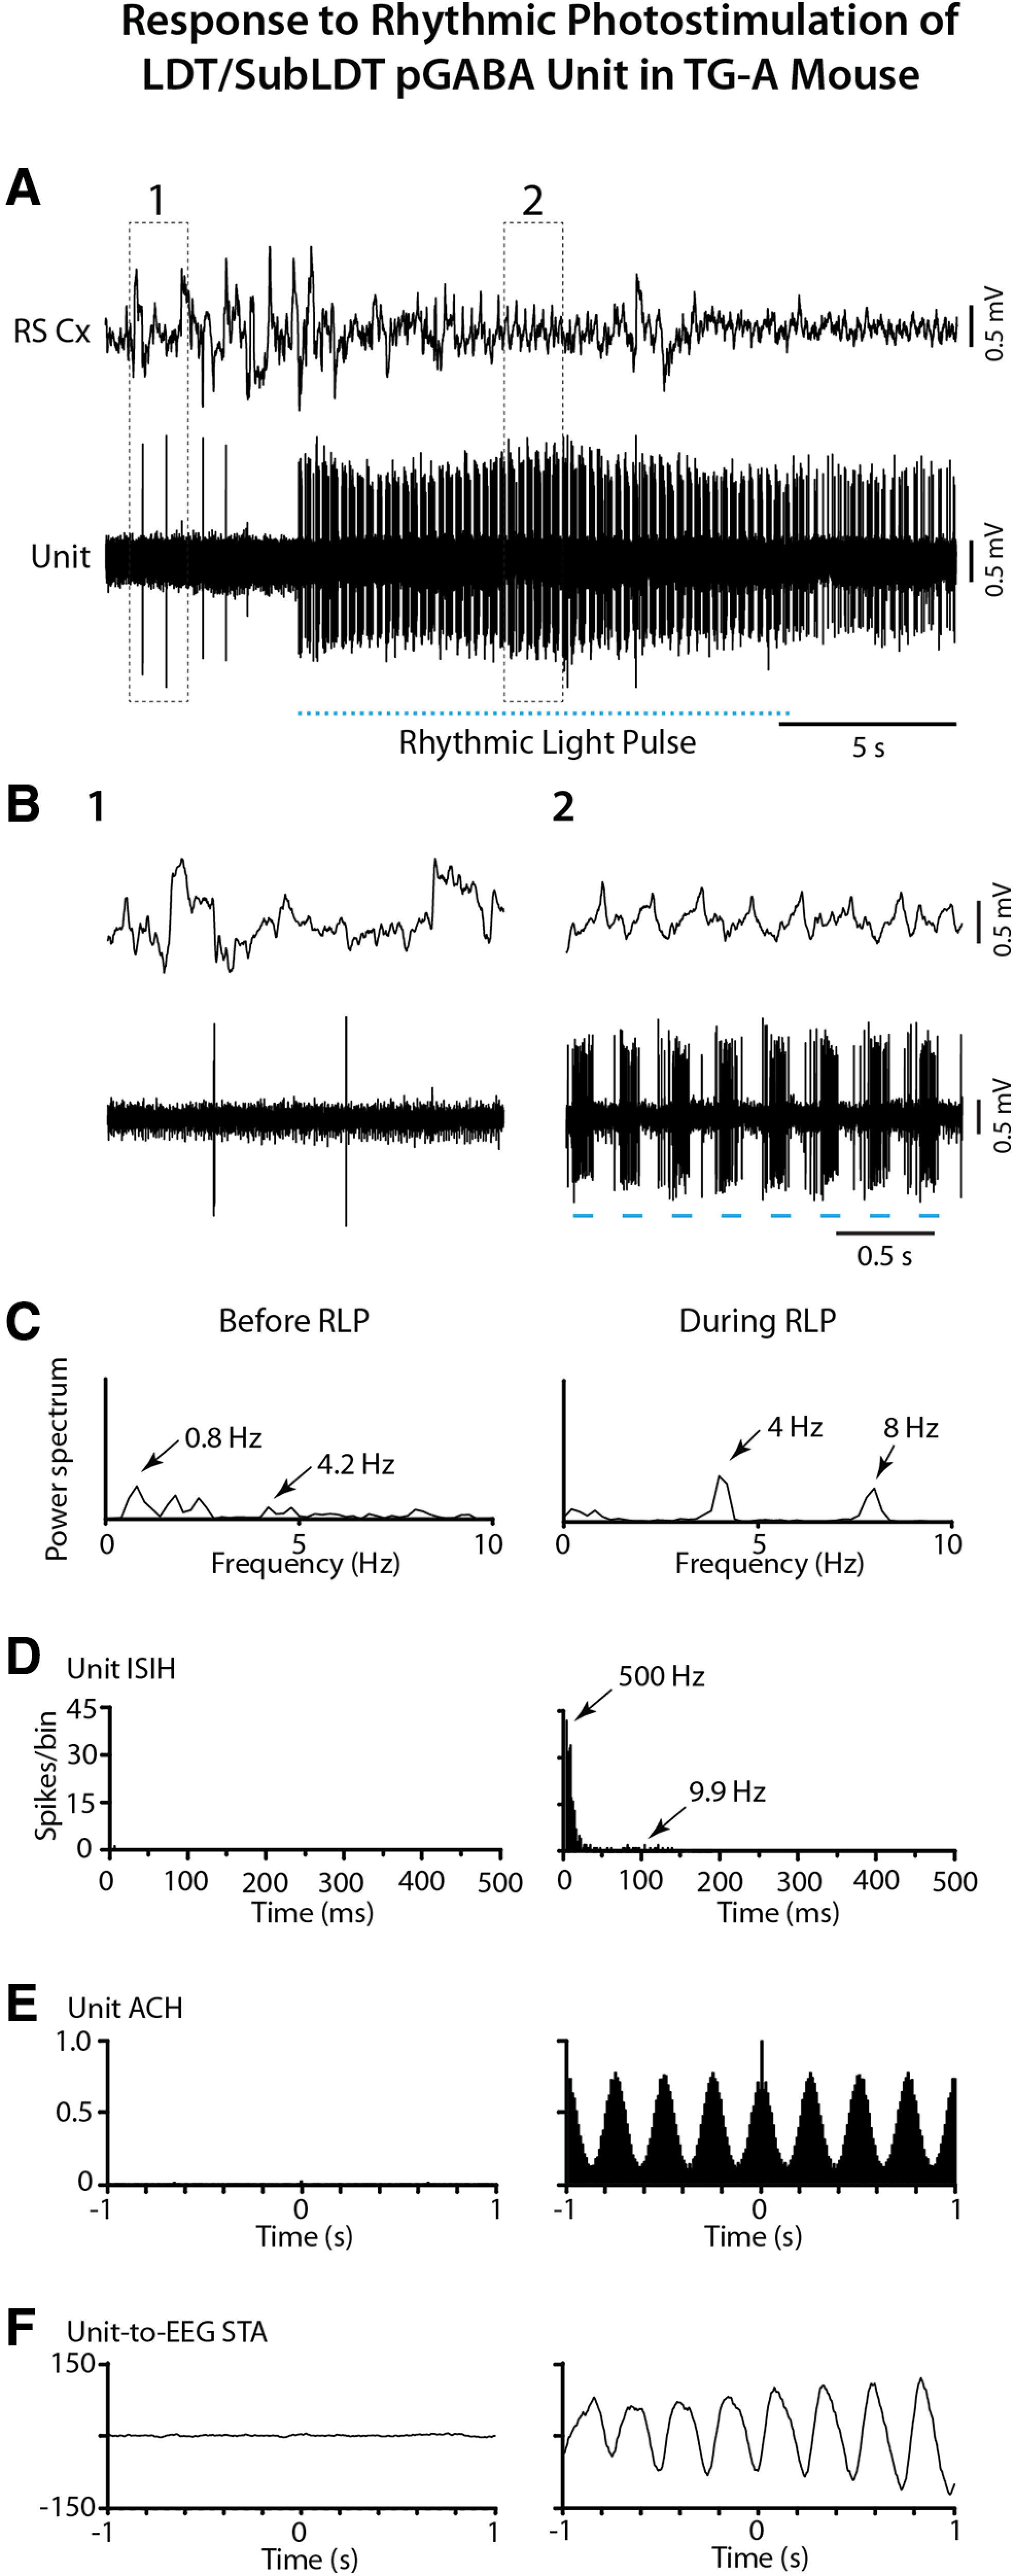
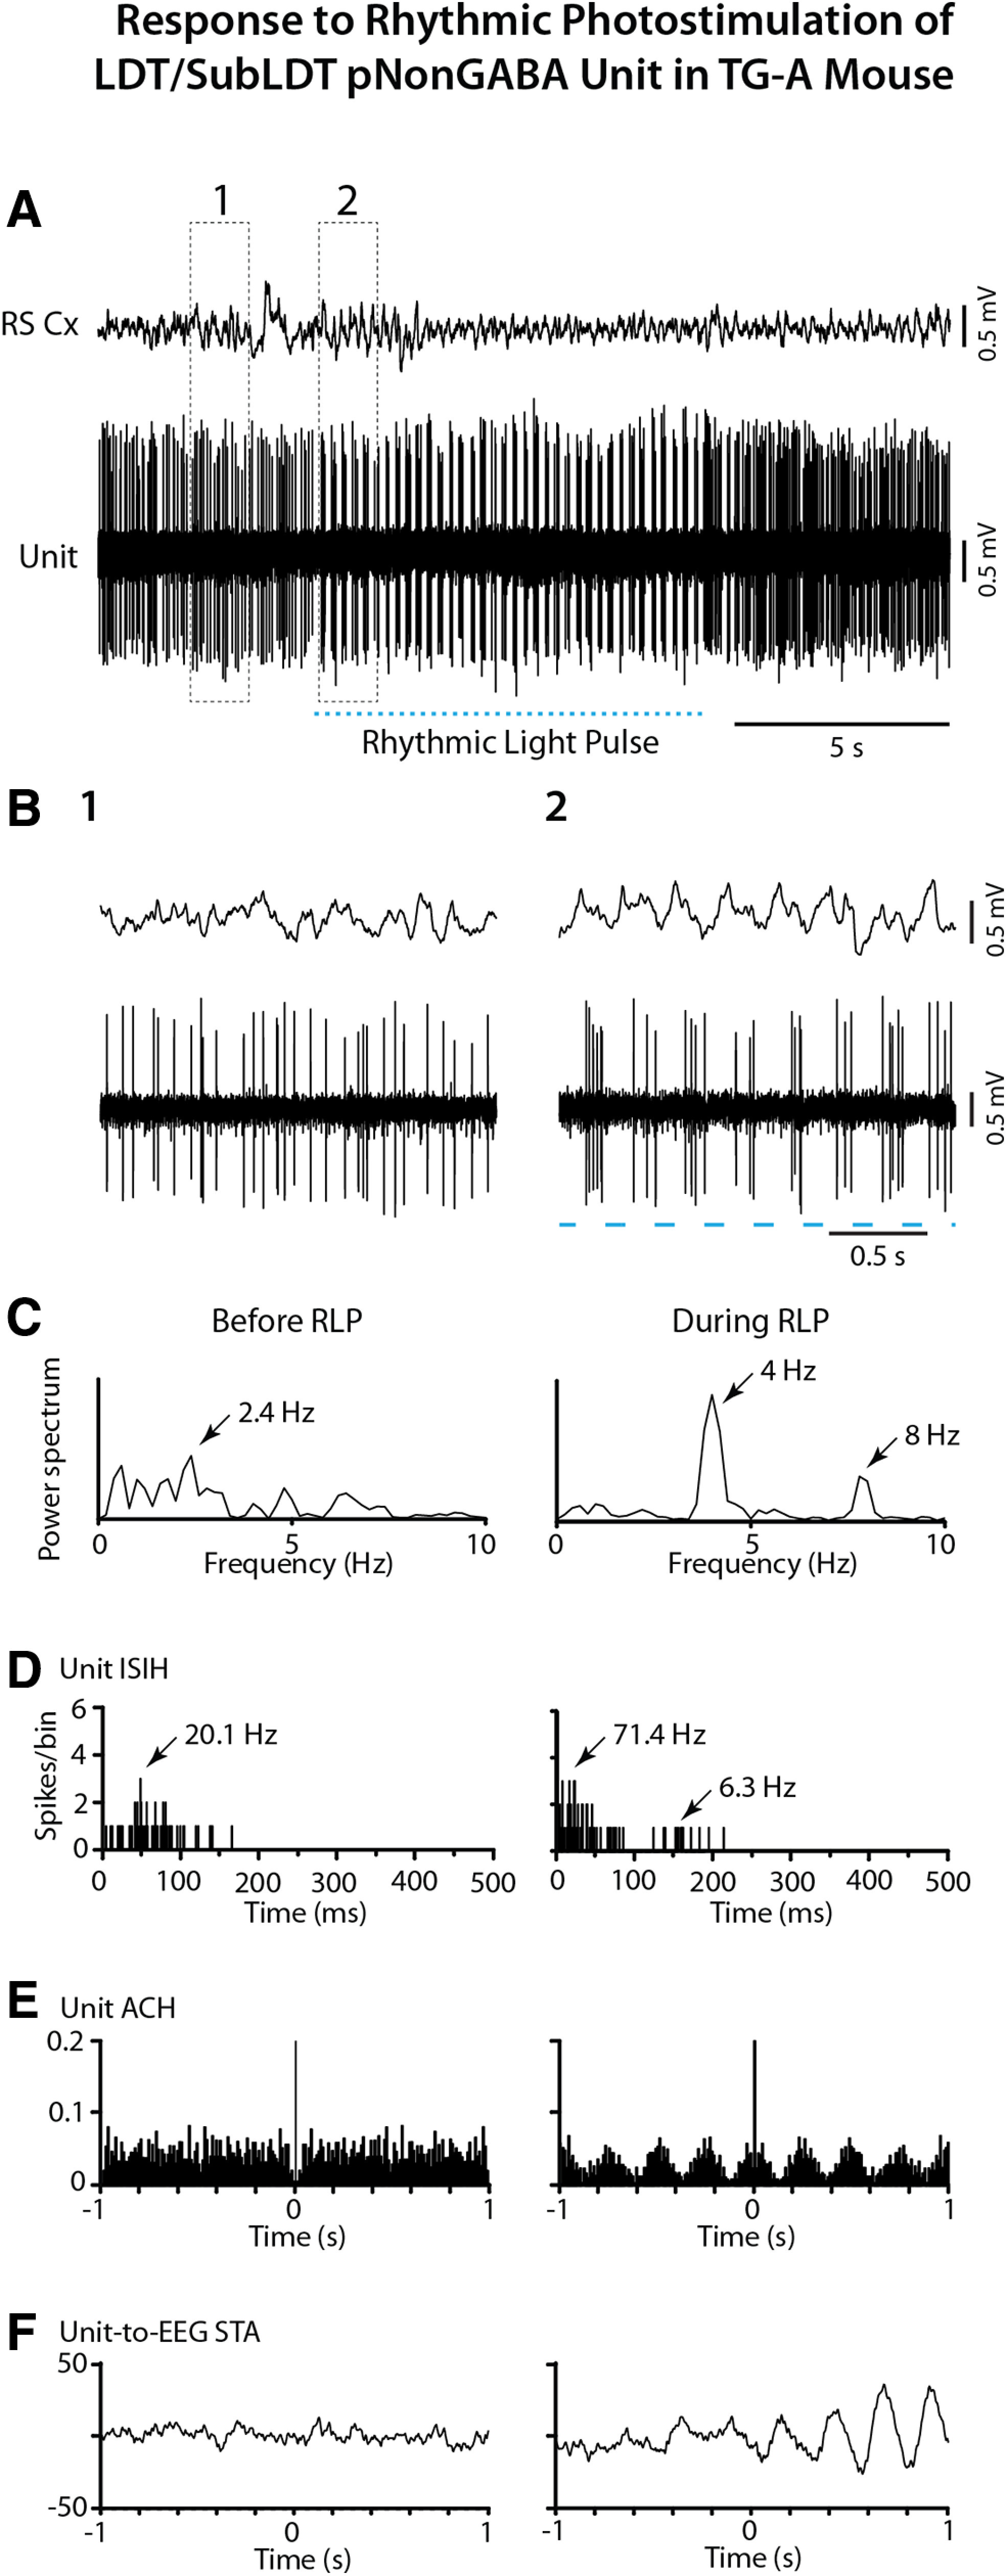
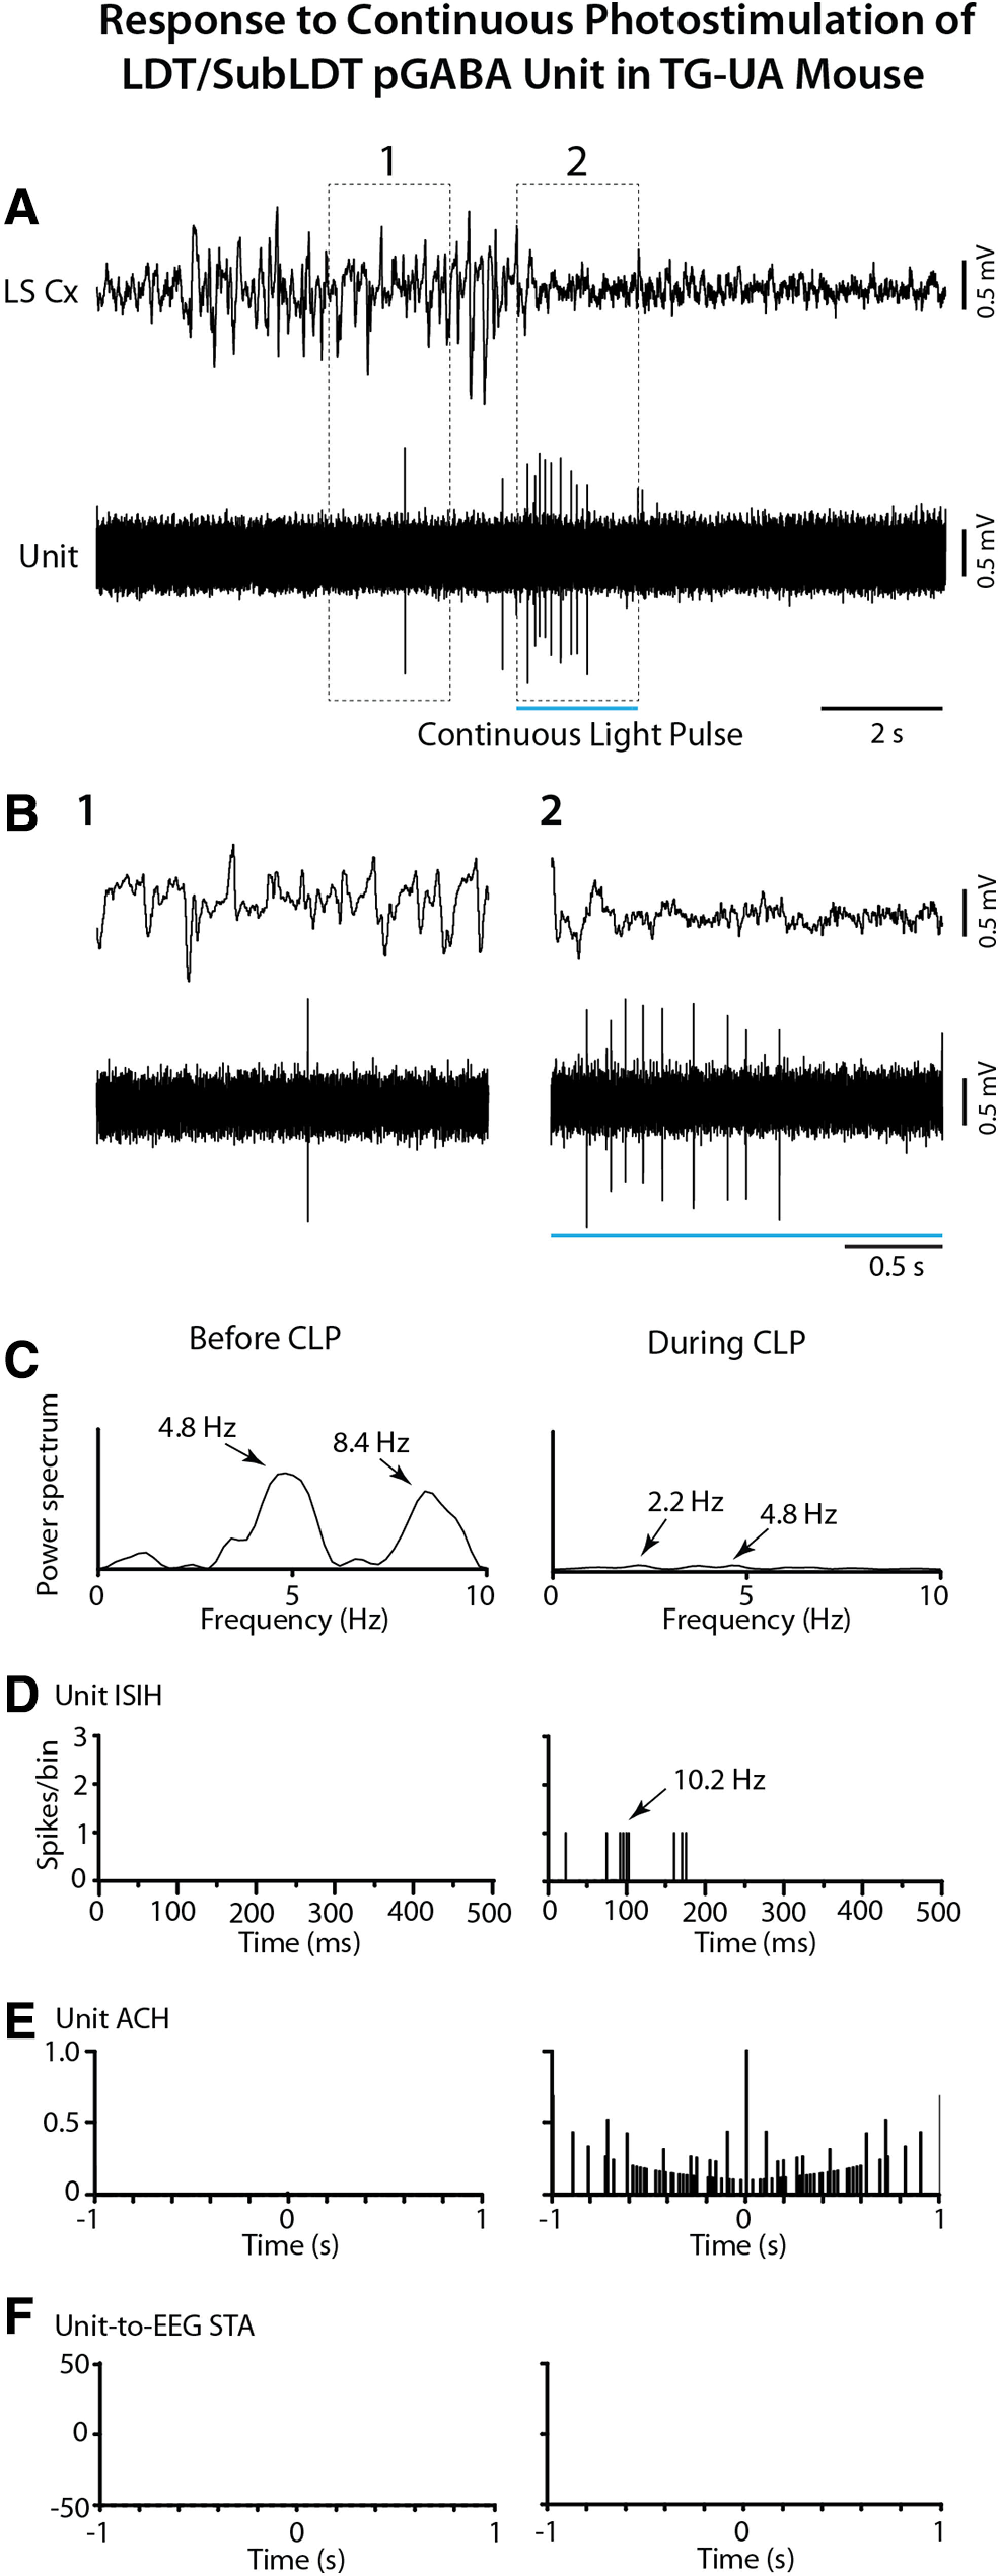
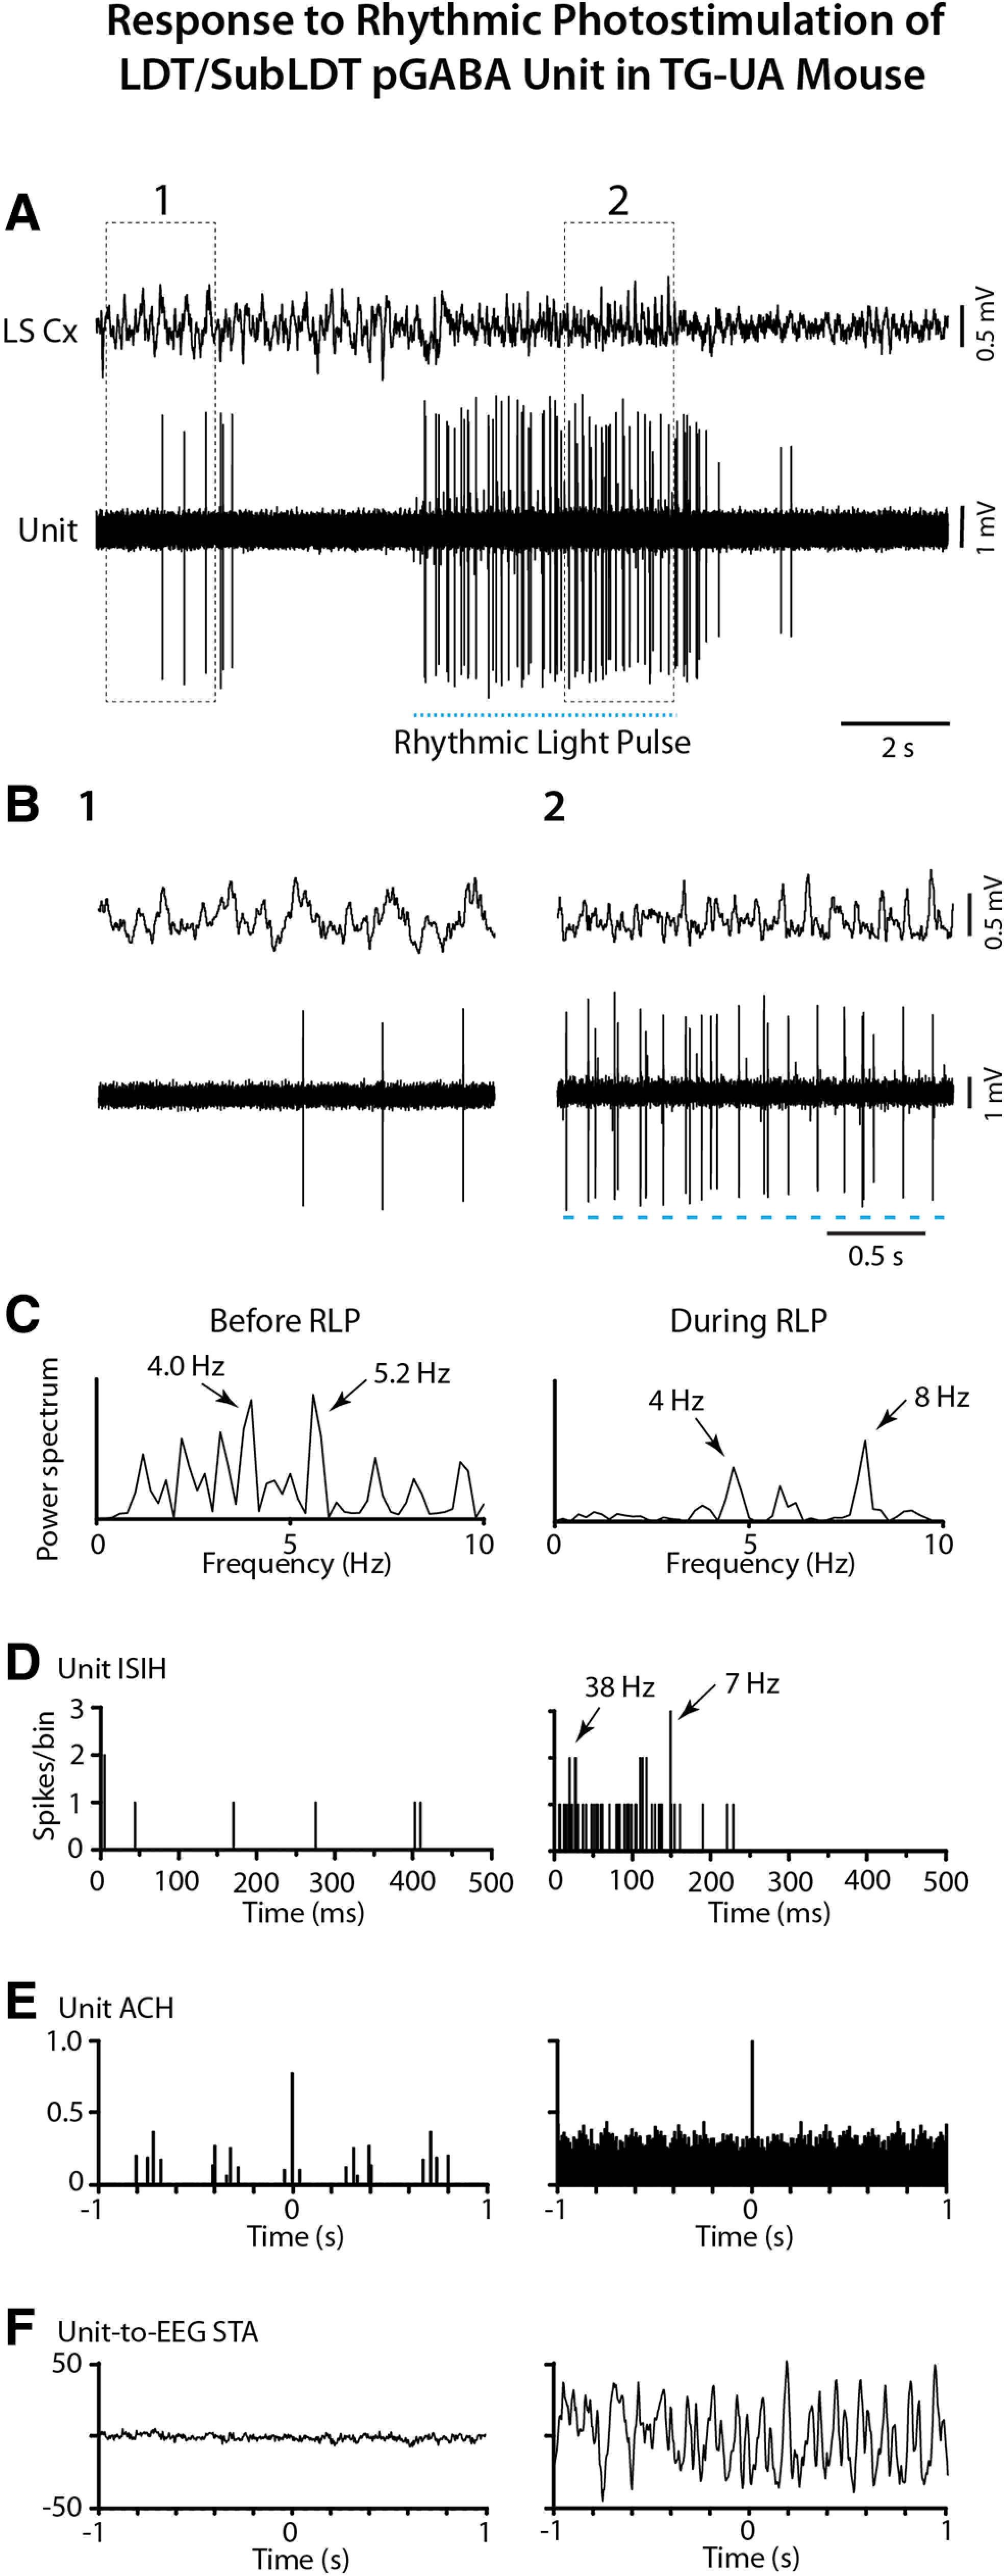
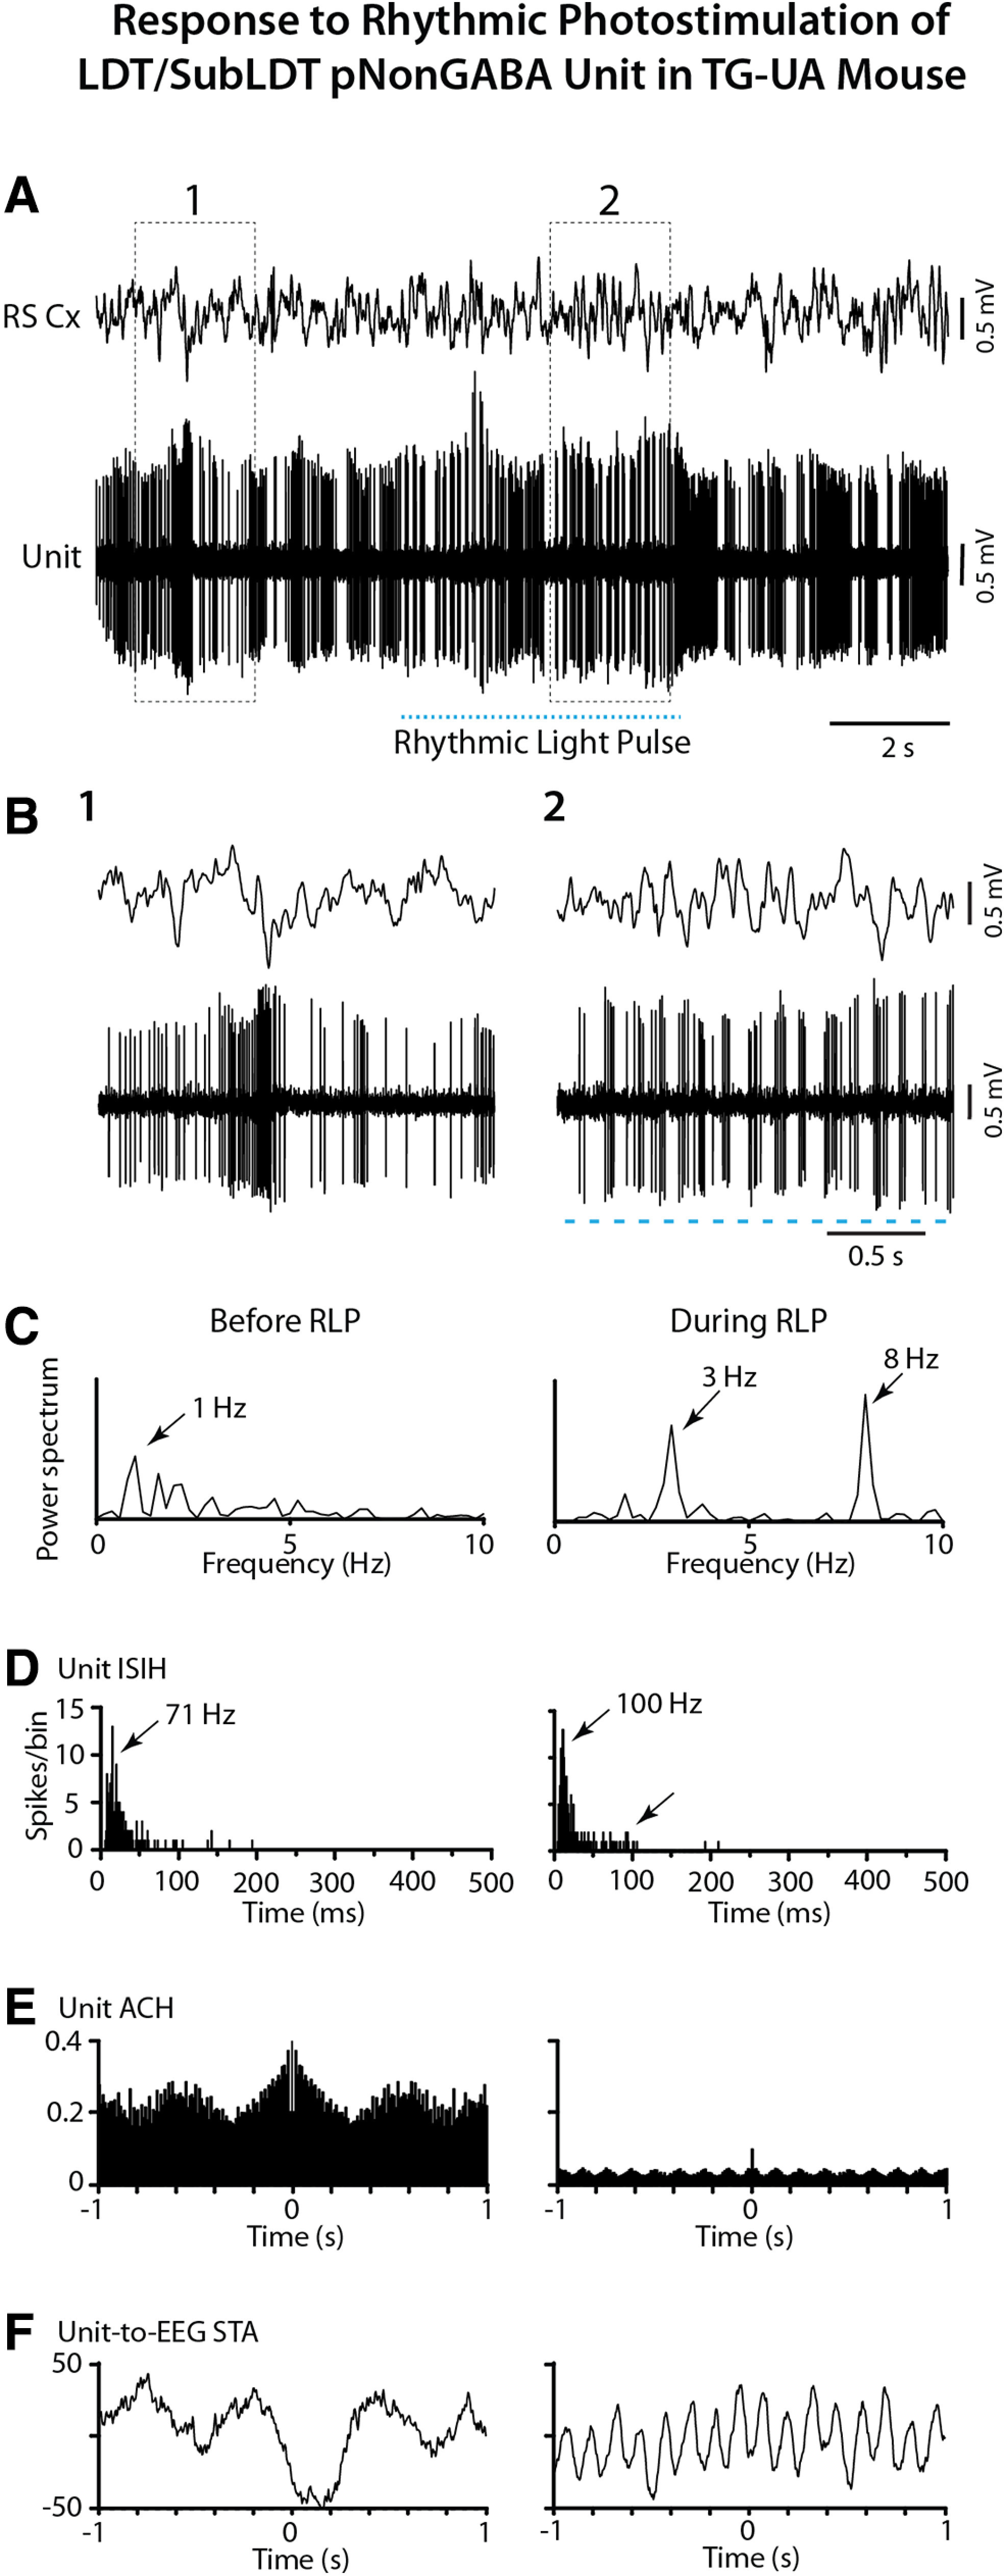
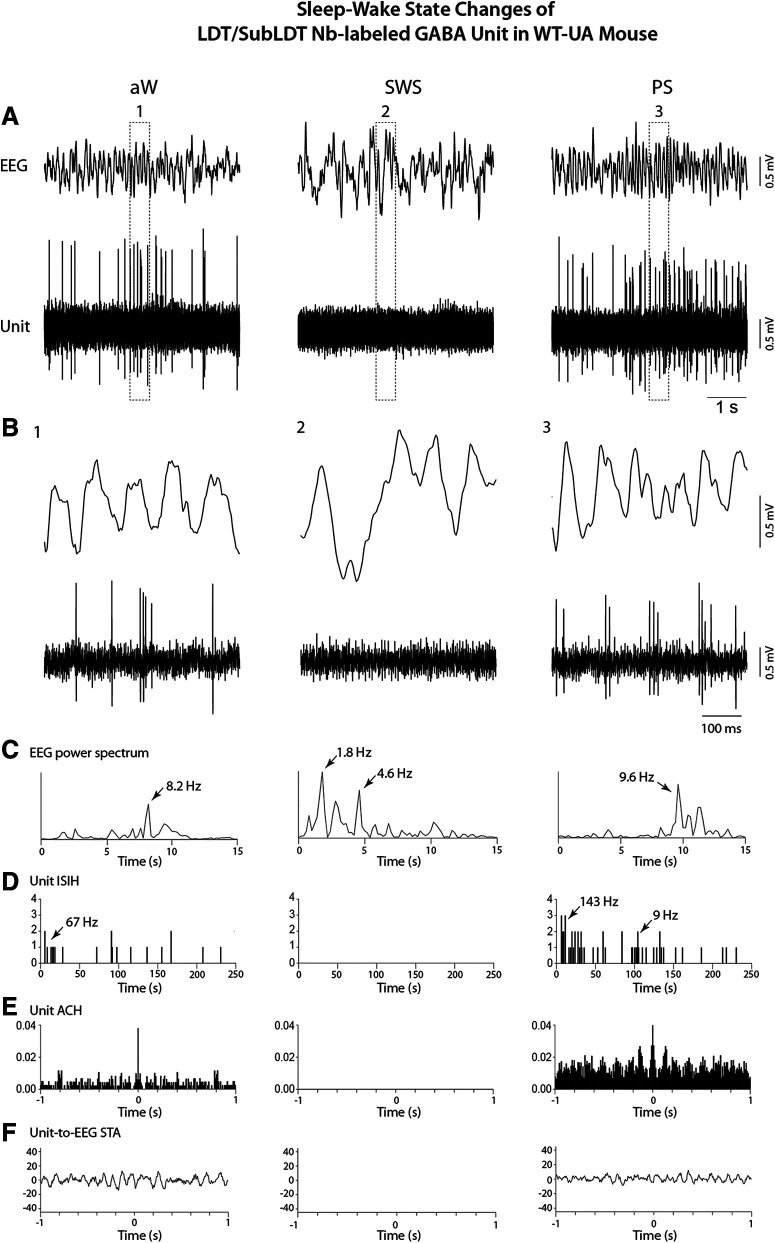
The cholinergic neurons in the pontomesencephalic tegmentum have been shown to discharge in association with and promote cortical activation during active or attentive waking and paradoxical or rapid eye movement sleep. However, GABA neurons lie intermingled with the cholinergic neurons and may contribute to or oppose this activity and role. Here we investigated in vitro and in vivo the properties, activities, and role of GABA neurons within the laterodorsal tegmental and sublaterodorsal tegmental nuclei (LDT/SubLDT) using male and female transgenic mice expressing channelrhodopsin-(ChR2)-EYFP in vesicular GABA transporter (VGAT)-expressing neurons. Presumed GABA (pGABA) neurons were identified by response to photostimulation and verified by immunohistochemical staining following juxtacellular labeling in vivo pGABA neurons were found to be fast-firing neurons with the capacity to burst when depolarized from a hyperpolarized membrane potential. When stimulated in vivo in urethane-anesthetized or unanesthetized mice, the pGABA neurons fired repetitively at relatively fast rates (∼40 Hz) during a continuous light pulse or phasically in bursts (>100 Hz) when driven by rhythmic light pulses at theta (4 or 8 Hz) frequencies. pNon-GABA, which likely included cholinergic, neurons were inhibited during each light pulse to discharge rhythmically in antiphase to the pGABA neurons. The reciprocal rhythmic bursting by the pGABA and pNon-GABA neurons drove rhythmic theta activity in the EEG. Such phasic bursting by GABA neurons also occurred in WT mice in association with theta activity during attentive waking and paradoxical sleep.SIGNIFICANCE STATEMENT Neurons in the pontomesencephalic tegmentum, particularly cholinergic neurons, play an important role in cortical activation, which occurs during active or attentive waking and paradoxical or rapid eye movement sleep. Yet the cholinergic neurons lie intermingled with GABA neurons, which could play a similar or opposing role. Optogenetic stimulation and recording of these GABA neurons in mice revealed that they can discharge in rhythmic bursts at theta frequencies and drive theta activity in limbic cortex. Such phasic burst firing also occurs during natural attentive waking and paradoxical sleep in association with theta activity and could serve to enhance sensory-motor processing and memory consolidation during these states.

Keywords: EEG; REM sleep; paradoxical sleep; slow wave sleep; theta; waking.


Figures

Figure 1.
Figure 1.
Photostimulation with juxtacellular recording and labeling of pGABA neurons in VGAT-ChR2-EYFP TG mice. GABA neurons were targeted for recording and photostimulation in vitro in LDT and in vivo in LDT/SubLDT. A, Approximate position of the optic fiber and the estimated distribution of blue light in vivo are shown reaching the LDT/SubLDT at a 40° angle and the Nb-filled micropipette at 90°. B, Left, Distribution of ChAT-immunopositive, ACh neurons was restricted to the LDT and SubLDT nuclei. Right, Nb-labeled neurons are plotted, which were retrieved from juxta-submitted, responding or pGABA units within the LDT/SubLDT or adjacent areas of TG-A (n = 34) and TG-UA (n = 12) mice. Shown with different symbols are the Nb-labeled neurons (Nb+), which were G-positive (filled blue triangles represent GAD- or GABA-immunopositive) or GABA (black open diamonds represent GABA-immunonegative) and which were ChR2-EYFP+ (green outline represents YFP+) or ChR2- EYFP. Large symbols represent the Nb-labeled/G+/ChR2-EYFP+ cells shown in Figure 2A–D. Neurons were plotted onto one atlas level representing the central level for the LDT/SubLDT (∼−5.20 from bregma). Cb, cerebellum; CG, central gray; DMTg, dorsomedial tegmental area; DTg, dorsal tegmental nucleus; IC, inferior colliculus; LDT, lateral dorsal tegmental nucleus; Mo5, motor trigeminal nucleus; SubLDT, sublaterodorsal tegmental nucleus. Plates adapted from Paxinos and Franklin (2001). Scale bars, 1 mm.
Figure 2.
Figure 2.
Fluorescent images of recorded and Nb-labeled GABA neurons. Neurons that were recorded and labeled with Nb (red) were identified as GABA neurons by immunofluorescent staining for GAD or GABA (blue). A, Large Purkinje cell, which was recorded and juxta-labeled with Nb in a TG-A mouse (Mouse VGAT77) in which all juxta-submitted units responded to a SLP and were thus considered pGABA units. The Nb+ neuron along with adjacent Purkinje cells were immunopositive for GAD and manifested clear YFP fluorescence in the plasma membrane reflecting ChR2-EYFP expression. B, Small recorded and Nb-labeled neuron in the LDT of a TG-A mouse (Mouse VGAT81) in which all juxta-submitted units were pGABA. The Nb+ neuron was GABA-immunopositive and appeared to show some YFP fluorescence over the plasma membrane. C, Small recorded and Nb-labeled neuron in the LDT of a TG-UA mouse (Mouse CVGAT9) in which all juxta-submitted units were pGABA. The Nb+ neuron was GABA+ and appeared to show YFP fluorescence over the plasma membrane. D, Small recorded, Nb-labeled GABA+ neuron in the SubLDT of a TG-UA mouse (Mouse CVGAT13) in which only pGABA units were juxta-submitted. The Nb+/GABA+ neuron also manifested YFP fluorescence over the plasma membrane. E, Small recorded, Nb-labeled GABA+ neuron located in the SubLDT of a WT (WT-UA) mouse (Mouse CWT4) in which units that resembled pGABA units and discharged across natural sleep-wake states were juxta-submitted. Scale bars, 20 µm.
Figure 3.
Figure 3.
In vitro responses of LDT neurons to blue light stimulation in brain slices from VGAT-ChR2-EYFP TG mice. A, Tight-seal recording of LDT pGABA neuron. Blue light stimulation (500 ms pulse, blue bars) caused repetitive spiking (left), and brief pulses (2 ms) produced reliable short latency spike couplets (right). B, Top, The characteristic photocurrent measured in voltage-clamp mode (holding potential −65 mV). Bottom, The depolarization and spiking produced by this photocurrent from two subthreshold membrane potentials (black trace, −70 mV; green trace, −85 mV). At −85 mV, the same photocurrent produced higher-frequency firing near the beginning of the pulse. C, Membrane potential responses (top) of the same neuron to injected current pulses (bottom). The intrinsic properties of this pGABA neuron showed rebound low-threshold spiking following the termination of hyperpolarizing current pulses (arrow) typical of T-currents. D, These intrinsic properties shaped responses to brief light pulses (1 ms) by a cell, which fired a single spike from −67 mV (red trace) but fired a couple of spikes from −85 mV (green trace). E, Spiking produced by trains of 20 light pulses (5 ms duration) delivered at 1, 5, 10, and 50 Hz from ∼−70 mV for the same cell illustrated in B-D. Blue bars represent the timing and duration of the light pulses. F, Summary of spike fidelity of pGABA LDT neurons versus light pulse frequency (mean ± SEM; n = 5). G, In pGABA neurons, IPSCs appeared just after the onset of the inward photocurrent (top, black) and were absent in the presence of gabazine (20 μm; bottom, yellow). H, The presence of photo-evoked IPSCs could delay or block spikes produced by photocurrents (two black traces). Gabazine blocked the IPSCs and shortened the spike latency (three superimposed traces; yellow). I, IPSCs were observed in LDT neurons lacking photocurrents, including putative ACh neurons and reliably followed trains (10 Hz, top; 20 Hz, bottom) of light pulses (10 ms).
Figure 4.
Figure 4.
Response of LDT/SubLDT units to blue light stimulation in vivo in VGAT-ChR2-EYFP TG mice. pGABA units were studied in urethane-anesthetized mice. A, In vivo, spiking in response to SLPs (∼5 ms duration applied every second) by a pGABA unit in a TG-A mouse (unit #13 in Mouse VGAT77). Segment of trace a is expanded below and shows a brief hyperpolarization at ∼1 ms preceding the spike at ∼2 ms. B, The spike latencies of units identified as pGABA (n = 63 units from 6 TG-A mice). C, Response of pGABA unit (#13 inVGAT77) to a CLP (∼5 s), expanded in 1 and 2 below. D, The IFFs of pGABA units (n = 58) during long (1-5 s) CLPs when they fired repetitively. E, Spiking of pGABA unit (#13 inVGAT77) in response to short (∼10 ms) light pulses at different frequencies. F, Spike fidelity of pGABA units (n = 15 from Mouse VGAT77) to SLPs at different frequencies (mean ± SEM).
Figure 5.
Figure 5.
Response of LDT/SubLDT pNon-GABA units to long light pulses in TG-A mice. A, Unit (#8 in Mouse VGAT77) identified as pNon-GABA by the failure to spike during SLPs (here ∼100 ms, A1) responded during a long (∼2 s) CLP by a delayed increase in discharge, as illustrated in expanded segments (1, 2 below, A2). B, Another pNon-GABA unit (#7 in Mouse VGAT84) identified by the failure to spike during light pulses (here ∼100 ms, B1) ceased firing during a long (∼2 s) CLP, as illustrated in expanded segments (1, 2 below, B2).
Figure 6.
Figure 6.
Response of LDT/SubLDT pGABA unit along with EEG to CLP stimulation in TG-A mouse (unit #2 in Mouse VGAT77). A, A long (∼20 s) CLP was delivered during EEG irregular slow activity and elicited an immediate and continuous increase in spiking of the unit, which was associated with a progressive change in EEG activity. B, Shown in segments expanded from before (1) and during (2) the CLP, the unit increased its discharge to very high-frequency spiking, whereas the EEG showed a gradual reduction in slow wave activity and greater predominance of higher frequency activity. C, As evident in the power spectra, there was a slight shift in the low-frequency peak. D, The unit ISI histogram (ISIH) revealed high IFFs (the reciprocal of the interval values) with a mode (indicated by arrow) at 111 Hz during the CLP. E, In the ACH, the unit showed no rhythmicity in its spiking. F, In the Unit-to-EEG STAs (with mV on vertical axis), there was no evidence of rhythmic or cross-correlated activity before or during periods of analysis corresponding to the ∼5 s periods from EEG and unit activities illustrated.
Figure 7.
Figure 7.
Response of LDT/SubLDT pGABA unit along with EEG to RLP stimulation in a TG-A mouse (#2 in Mouse VGAT77, as shown in Fig. 6). A, A series of RLPs (100 ms at 4 Hz for ∼10 s) were delivered during a period of EEG irregular slow activity and elicited rhythmic phasic spiking of the unit along with EEG RSA. B, As shown in the expanded traces 1 and 2, the pGABA unit was driven by the light pulses to fire in high-frequency trains or bursts of spikes, whereas the EEG was progressively driven into RSA. C, Evident in the power spectra, the EEG shifted from irregular slow activity (∼0.8 Hz) before the RLPs to RSA at 4 Hz with a harmonic at 8 Hz during RLPs. D, In the ISIH, the unit firing occurred in high-frequency bursts during the RLPs (primary mode at 500 Hz) with a recurrence at slower frequencies (arrow in middle of broad low-frequency mode). E, In the ACH, the unit firing showed rhythmicity at ∼4 Hz. F, In the Unit-to-EEG STA, unit activity was cross-correlated with the EEG RSA at 4 Hz. For graph details and abbreviations, see legend to Figure 6.
Figure 8.
Figure 8.
Response of LDT/SubLDT pNon-GABA unit along with EEG to RLP stimulation in a TG-A mouse (#3 in Mouse VGAT77). A, A series of RLPs (100 ms at 4 Hz for ∼8 s) was delivered during a period of EEG irregular activity and elicited rhythmic phasic spiking of the unit along with EEG RSA. B, As shown in the expanded traces 1 and 2, the pNon-GABA unit was inhibited by the light pulses and thereby driven to fire phasically during the off period of the RLP stimulation, whereas the EEG was driven into RSA. C, Evident in the power spectra, the EEG shifted from irregular activity before the RLPs to RSA at 4 Hz with a harmonic at 8 Hz during the RLPs. D, In the ISIH, the unit firing in high-frequency spike trains during the off phase of the RLPs was evident (with a mode at 71 Hz) along with a secondary low-frequency mode near the RSA frequency. E, In the ACH, the unit firing showed some rhythmicity at ∼4 Hz. F, In the Unit-to-EEG STA, the unit activity was very minimally cross-correlated with the EEG RSA at 4 Hz. For graph details and abbreviations, see legend to Figure 6.
Figure 9.
Figure 9.
Response of LDT/SubLDT pGABA unit to CLP stimulation in a TG-UA mouse (#5 in Mouse CVGAT18). A, A long (∼2 s) CLP was delivered during EEG irregular activity and elicited an increase in spiking of the unit at the onset of the CLP, which was associated with a rapid change in EEG activity. B, Shown in segments expanded from before (1) and during (2) the CLP, the unit increased its discharge to low-frequency tonic spiking, whereas the EEG showed a reduction in slow activity and greater predominance of low amplitude faster activity. C, As evident in the power spectra, there was an overall reduction in slower EEG activity. D, As evident in the ISIH, the unit fired at a relatively low frequency. E, In the ACH, the unit showed no rhythmicity in its spiking. F, In the Unit-to-EEG STA, there was no evidence of rhythmic or cross-correlated activity. For graph details and abbreviations, see legend to Figure 6.
Figure 10.
Figure 10.
Response of LDT/SubLDT pGABA unit along with EEG to RLP stimulation in a TG-UA mouse (#5 in Mouse CVGAT18 as shown in Fig. 9). A, RLP stimulation at high theta frequency (50 ms, 8 Hz for ∼5 s) was delivered during a period of EEG irregular activity. B, As shown in the expanded traces 1 and 2, the pGABA unit was driven by the light pulses to fire phasically during the RLPs, whereas the EEG was progressively driven into a theta-like rhythm. C, Evident in the power spectra, the EEG shifted from irregular activity before the RLPs to high theta activity at 8 Hz during the RLPs. D, In the ISIH, the unit firing appeared variable around a γ frequency (30-80 Hz) in the high-frequency range with recurrence in a low-frequency range around the high theta frequency (6-10 Hz). E, In the ACH, the unit firing showed some rhythmicity at ∼8 Hz. F, In the Unit-to-EEG STA, unit activity was cross-correlated with the EEG high theta at ∼8 Hz. For graph details and abbreviations, see legend to Figure 6.
Figure 11.
Figure 11.
Response of LDT/SubLDT pNon-GABA unit along with EEG to RLP stimulation in a TG-UA mouse (#5 in Mouse CVGAT8). A, RLP stimulation at high theta frequency (50 ms, 8 Hz for ∼5 s) was delivered during a period of EEG irregular activity. B, As shown in the expanded traces 1 and 2, the pNon-GABA unit was driven by the light pulses to fire phasically during the off phase of the RLPs, whereas the EEG was progressively driven into a theta-like rhythm. C, Evident in the power spectra, the EEG shifted from irregular activity before the RLPs to high theta activity at 8 Hz during the RLPs. D, In the ISIH, the unit firing was variable and included high-frequency burst-like spiking (∼100 Hz) and lower frequency recurrence around a high theta range. E, In the ACH, the unit firing showed weak rhythmicity at ∼8 Hz. F, In the Unit-to-EEG STA, unit activity was cross-correlated with the EEG high theta at ∼8 Hz. For graph details and abbreviations, see legend to Figure 6.
Figure 12.
Figure 12.
Response of Nb-labeled GABA unit in WT-UA mouse to sleep-wake state changes. A, The unit (#8 in Mouse CWT4) was recorded in association with EEG during aW, SWS, and PS. B, As evident in expanded segments 1, 2, and 3, the unit discharged during aW and PS and was virtually silent during SWS. The pattern of firing reflected phasic burst discharge in association with high theta EEG activity during aW and PS. C, In EEG power spectra, the activity reflected theta activity (at 8.2 Hz) during W, slow wave activity with a peak at 1.8 Hz during SWS, and rhythmic theta at frequencies of >9 Hz (peak at 9.6 Hz) during PS. D, In the Unit ISIH, evidence of bursting activity (mode at 143 Hz) is present with some recurrent spiking (low-frequency mode ∼9 Hz) during PS. E, In the Unit ACH, there was minimal indication of rhythmic firing. F, In the Unit-to-EEG STA, there was minimal cross-correlated rhythmic activity with high theta EEG activity of PS. Data analysis was performed on 5 s periods of W, SWS, and PS as illustrated. For graph details and abbreviations, see legend to Figure 6.

Similar articles

Cited by

References

    1. Bassant MH, Poindessous-Jazat F (2001) Ventral tegmental nucleus of Gudden: a pontine hippocampal theta generator? Hippocampus 11:809–813. 10.1002/hipo.1096 - DOI - PubMed
    1. Boucetta S, Jones BE (2009) Activity profiles of cholinergic and intermingled GABAergic and putative glutamatergic neurons in the pontomesencephalic tegmentum of urethane-anesthetized rats. J Neurosci 29:4664–4674. 10.1523/JNEUROSCI.5502-08.2009 - DOI - PMC - PubMed
    1. Boucetta S, Cisse Y, Mainville L, Morales M, Jones BE (2014) Discharge profiles across the sleep-waking cycle of identified cholinergic, GABAergic, and glutamatergic neurons in the pontomesencephalic tegmentum of the rat. J Neurosci 34:4708–4727. 10.1523/JNEUROSCI.2617-13.2014 - DOI - PMC - PubMed
    1. Boyce R, Glasgow SD, Williams S, Adamantidis A (2016) Causal evidence for the role of REM sleep theta rhythm in contextual memory consolidation. Science 352:812–816. 10.1126/science.aad5252 - DOI - PubMed
    1. Brown RE, Basheer R, McKenna JT, Strecker RE, McCarley RW (2012) Control of sleep and wakefulness. Physiol Rev 92:1087–1187. 10.1152/physrev.00032.2011 - DOI - PMC - PubMed

Publication types

MeSH terms

Substances

LinkOut - more resources