. 2020 Sep 15;26(18):4933-4946.
doi: 10.1158/1078-0432.CCR-20-0479. Epub 2020 Jun 23.

The MD Anderson Prostate Cancer Patient-derived Xenograft Series (MDA PCa PDX) Captures the Molecular Landscape of Prostate Cancer and Facilitates Marker-driven Therapy Development

Affiliations

The MD Anderson Prostate Cancer Patient-derived Xenograft Series (MDA PCa PDX) Captures the Molecular Landscape of Prostate Cancer and Facilitates Marker-driven Therapy Development

Nallasivam Palanisamy et al. Clin Cancer Res. .

Abstract

Purpose: Advances in prostate cancer lag behind other tumor types partly due to the paucity of models reflecting key milestones in prostate cancer progression. Therefore, we develop clinically relevant prostate cancer models.

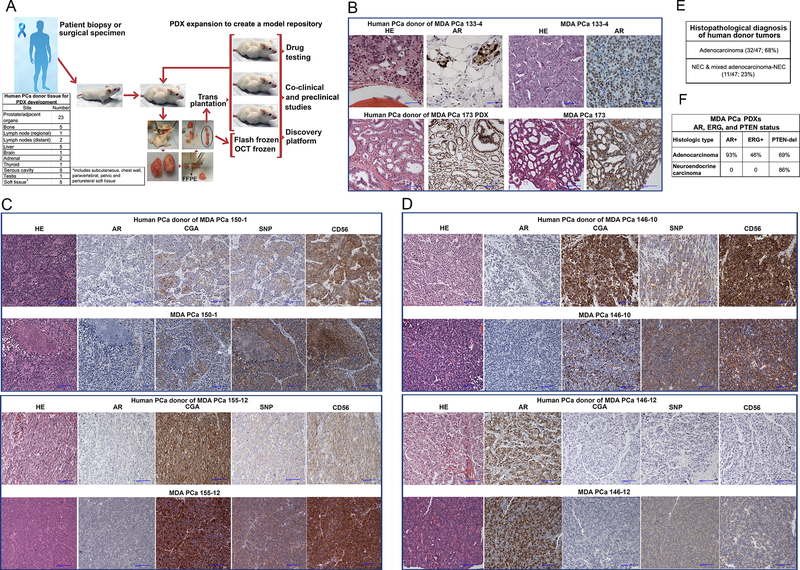
Experimental design: Since 1996, we have generated clinically annotated patient-derived xenografts (PDXs; the MDA PCa PDX series) linked to specific phenotypes reflecting all aspects of clinical prostate cancer.

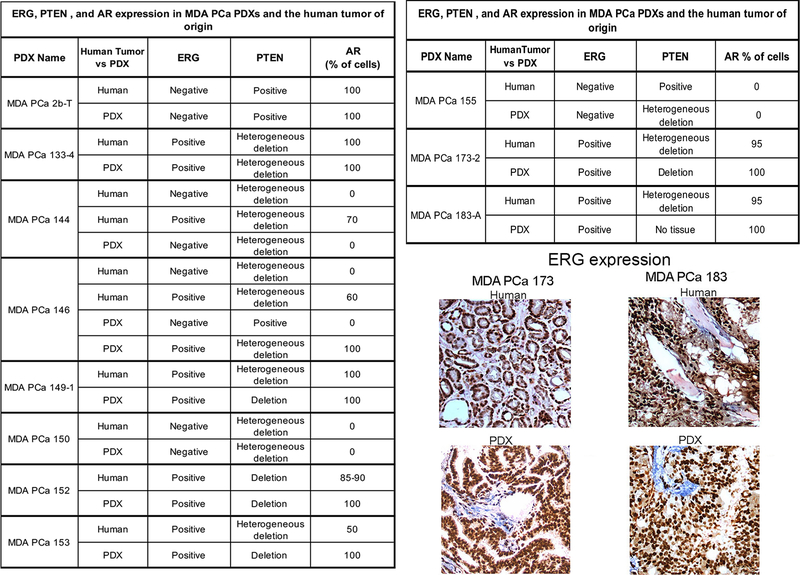
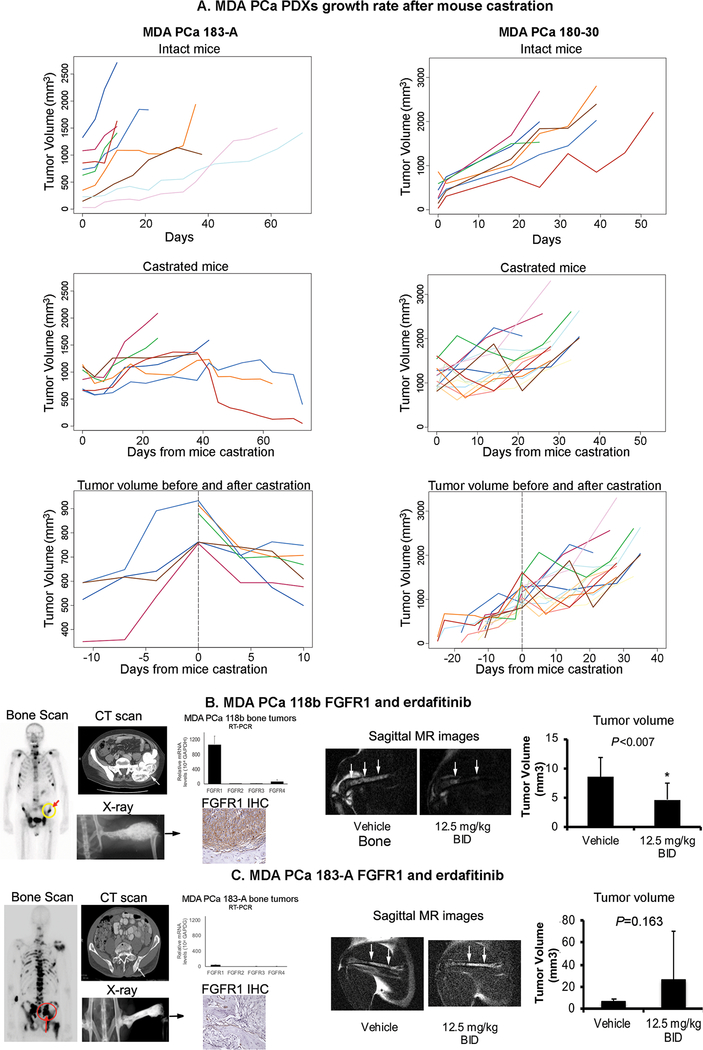
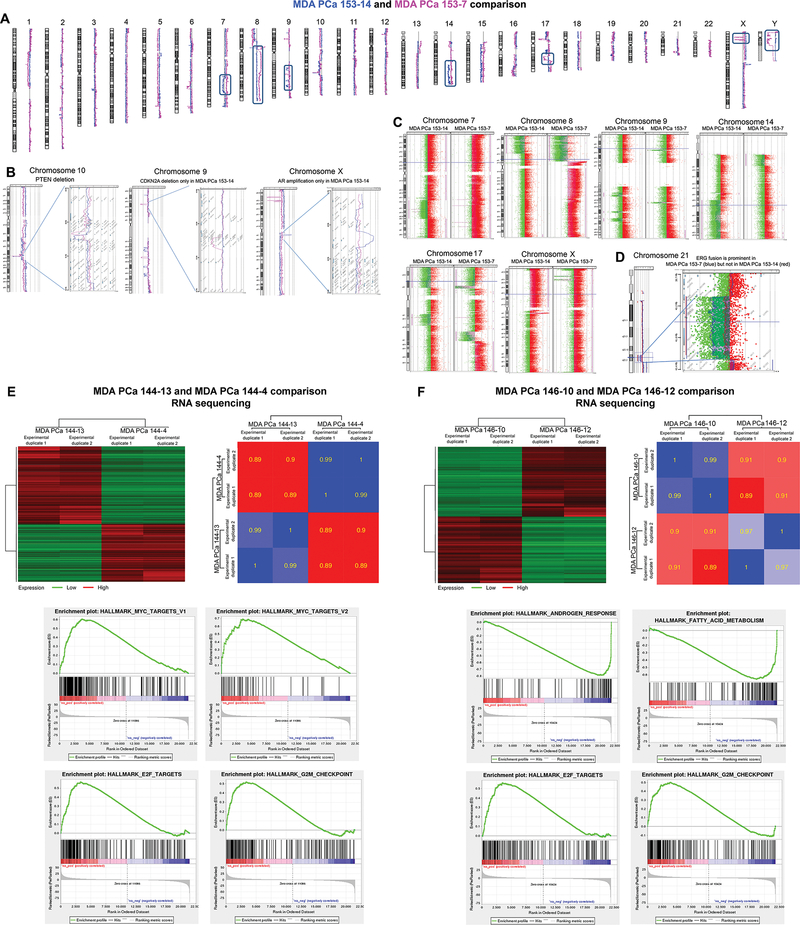
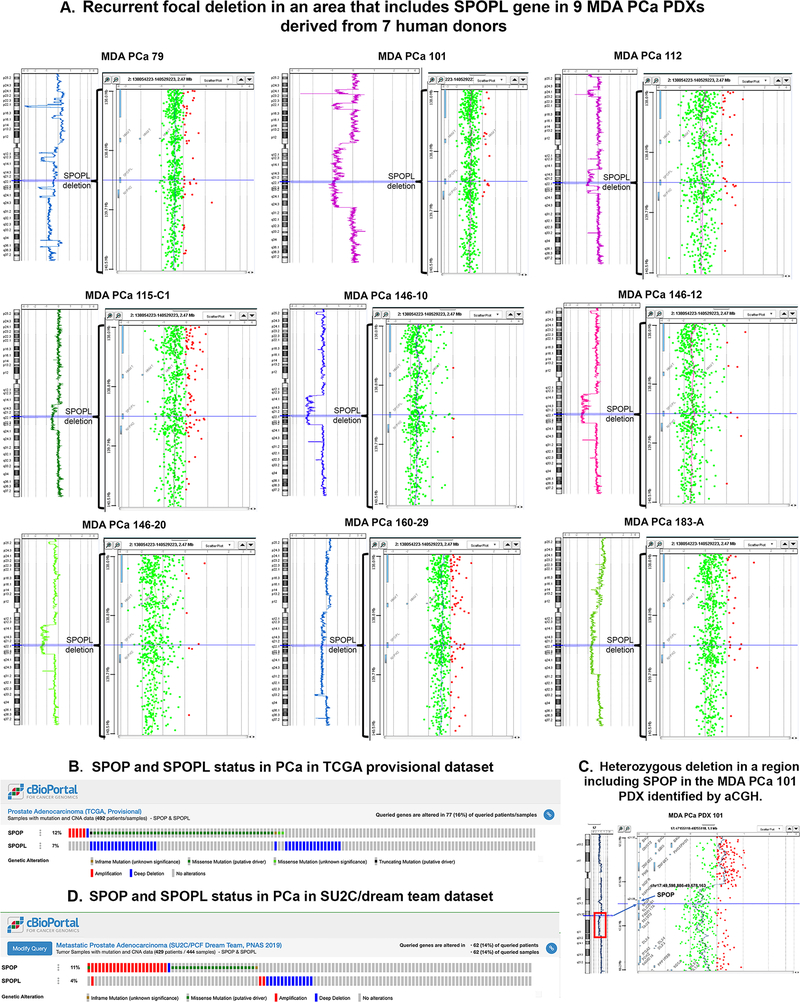
Results: We studied two cell line-derived xenografts and the first 80 PDXs derived from 47 human prostate cancer donors. Of these, 47 PDXs derived from 22 donors are working models and can be expanded either as cell lines (MDA PCa 2a and 2b) or PDXs. The histopathologic, genomic, and molecular characteristics (androgen receptor, ERG, and PTEN loss) maintain fidelity with the human tumor and correlate with published findings. PDX growth response to mouse castration and targeted therapy illustrate their clinical utility. Comparative genomic hybridization and sequencing show significant differences in oncogenic pathways in pairs of PDXs derived from different areas of the same tumor. We also identified a recurrent focal deletion in an area that includes the speckle-type POZ protein-like (SPOPL) gene in PDXs derived from seven human donors of 28 studied (25%). SPOPL is a SPOP paralog, and SPOP mutations define a molecular subclass of prostate cancer. SPOPL deletions are found in 7% of The Cancer Genome Atlas prostate cancers, which suggests that our cohort is a reliable platform for targeted drug development.

Conclusions: The MDA PCa PDX series is a dynamic resource that captures the molecular landscape of prostate cancers progressing under novel treatments and enables optimization of prostate cancer-specific, marker-driven therapy.


Conflict of interest statement

Financial disclosure. None of the contributing authors have any conflict of interest relevant to this manuscript

Figures

Fig 1.
Fig 1.
(A) Schematic diagram outlining the strategy for MDA PCa PDX development, expansion, and storage. PCa tissue samples are implanted subcutaneously into mice. Once the tumor grows, PDXs are expanded in mice to passage 5. At each passage, representative samples of PDX tissue are stored in various forms (e.g., fresh-frozen, formalin-fixed and paraffin-embedded) to create a PDX model repository. The table “Human PCa Donor for PDX Development” indicates the origin of the samples that developed into the MDA PCa PDXs used in this work. (B) Human donor adenocarcinomas and corresponding PDXs have the same morphological and immunohistochemical profile. Representative photomicrographs of HE sections and immunohistochemical stains for AR. PCa donor tumor of MDA PCa 133 was a bone metastasis and PCa donor tumor of MDA PCa 173 was a primary PCa. (C) Human donor neuroendocrine carcinomas and corresponding PDXs have the same morphological and immunohistochemical profile. Representative photomicrographs of HE sections and immunohistochemical stains for AR, and markers of neuroendocrine differentiation CGA, SNP, and CD56. PCa donor tumor of MDA PCa 150 was a bone metastasis, and PCa donor tumor of MDA PCa 155 was a primary PCa. (D) PDXs derived from a mixed adenocarcinoma/neuroendocrine human PCa. Representative photomicrographs showing the adenocarcinoma and neuroendocrine components of human PCa reflected in different PDXs. PCa donor tumor of MDA PCa 146 was a primary PCa. (E) Morphological distribution (adenocarcinoma and neuroendocrine carcinoma) of MDA PCa PDXs reported in this work. (F) AR, ERG, and PTEN status of MDA PCa PDXs reported in this work. HE, hematoxylin and eosin; AR, androgen receptor; CGA, chromogranin; SNP, synaptophysin.
Fig 2.
Fig 2.
Table outlines the status of ERG, PTEN, and AR in 11 pairs of human PCa (Tumor) and corresponding PDX (PDX). Representative photomicrographs show examples of ERG staining in the human prostate donor tumor and PDX in two different pairs. Note that in those cases in which multiple PDXs were generated from different areas of the same tumor (e.g., MDA PCa 144–4, −13, etc; and MDA PCa 146–10; −12, etc) we did not include a suffix that uniquely identifies each individual PDX because this is only an illustration of the different phenotypes found. Table S2 lists the specific phenotype identified in each of these unique PDXs.
Fig 3.
Fig 3.
(A) Effect of mouse castration on the growth of two MDA PCa PDXs. MDA PCa 183-A. Intact mice. Tumor volume monitoring detected a significant increase over time (n = 9, slope = 18.0; P < 0.0001, linear mixed models). Castrated mice. Tumor volume monitoring after mouse castration did not detect any significant change over time (n = 7, slope = −0.4; P = 0.85). There was a statistically significant difference between the slopes of tumor volume between the intact and castrated mice (P < 0.0001). Tumor volume before and after castration. A piecewise linear mixed model, with castration day as the cutoff, suggests that there was a statistically significant increase in tumor volume before castration (n = 4, slope = 26.8, P < 0.0001), and there was a statistically significant decrease in tumor volume after castration (n = 6, slope = −18.0, P < 0.0001). MDA PCa 180–30. Intact mice. Tumor volume monitoring detected a significant increase over time (n = 7, slope = 41.7; P < 0.0001, linear mixed models). Castrated mice. Tumor volume monitoring after mouse castration detected a significant increase over time, although the rate of increase (i.e., slope) was smaller than in intact mice (n = 14, slope = 26.4; P < 0.0001). There was a statistically significant difference between the two slopes (P = 0.008). Tumor volume before and after castration. A piecewise linear mixed model, with castration day as the cutoff, suggests that there was a statistically significant increase in tumor volume before castration (n = 14, slope = 36.3, P < 0.0001). Also, there was a statistically significant increase (although at a lower rate) in tumor volume after castration (n = 14, slope = 30.9, P < 0.0001). Tumor volumes based on caliper measurements were calculated by the modified ellipsoidal formula: 1/2(length × width2). (B) Effect of erdafitinib in MDA PCa 118b PDXs growing in the bone of immunodeficient mice. Bone scan (front view) and contrast enhanced CT scan show the lesion involving the left ilium (arrow) that was the source of MDA PCa 118b PDX. X-ray of a mouse pelvis and rear limbs 5 weeks after intrafemoral implantation of MDA PCa 118b–derived cells. mRNA expression by RT-PCR of FGFR1, FGFR2, FGFR3, FGFR4 in mouse femurs using human-specific primers. FGFR1 immunohistochemistry (IHC) of an MDA PCa 118b–bearing femur shows high FGFR1 expression. An example of MR images of MDA PCa 118b tumor–bearing femur in erdafitinib and vehicle-treated mice. The graph shows the quantification of tumor volume. (C) Effect of erdafitinib in MDA PCa 183-A PDXs growing in the bone of immunodeficient mice. Bone scan (rear view) and CT scan show the bone lesion involving the sacrum that was the source of the MDA PCa 183 cells (arrow). X-ray of a mouse pelvis and rear limbs 9 weeks after intrafemoral implantation of MDA PCa 183-A–derived cells. mRNA expression by RT-PCR of FGFR1, FGFR2, FGFR3, FGFR4 in mouse femurs using human-specific primers. FGFR1 IHC of MDA PCa 183-A–bearing femur shows no FGFR1 expression. An example of MR images of MDA PCa 183-A–bearing femur in erdafitinib and vehicle-treated mice. The graph shows the quantification of tumor volume. T, tumor; B, bone.
Fig 4.
Fig 4.. A-C, whole-genome analysis of MDA PCa 153 PDXs.
(A) Comparison of copy number changes at whole genome level in MDA PCa 153–7 (red) and MDA PCa 153–14 (blue) identified many common losses and gains, as well as notable differences in copy number between the two PDXs (boxed areas). (B) Both MDA PCa 153–7 (red) and MDA PCa 153–14 (blue) have a PTEN deletion. However, MDA PCa 153–14 (but not −7) has AR amplification and a deletion in the area encompassing the cyclin-dependent kinase inhibitor 2A (CDKN2A). (C) Notable differences in copy number between the two PDXs can be appreciated at higher resolution. (D) Chromosome view and gene view of ERG fusion by deletion, which is very prominent in MDA PCa 153–7 but not in 153–14. E-F, RNA sequencing analysis of MDA PCa 144 and MDA PCa 146 pairs. (E) Heat maps illustrate correlation and differential expression of genes between MDA PCa 144 and MDA PCa 146 PDX pairs. For the differential expression analysis, significant genes are defined using FDR 0.01 and fold change of 2. (F) Four hallmark gene sets among the most significantly enriched in MDA PCa 144–13 vs MDA PCa 144–4 (left panels) and MDA PCa 146–10 vs MDA PCa 146–12 (right panels).
Fig 5.
Fig 5.
(A) Recurrent focal deletion in areas that include the SPOPL gene in MDA PCa PDXs derived from 7 human donors. High resolution aCGH analysis identified focal deletion in the area encompassing SPOPL gene in 9 PDXs derived from 7 human PCa donors. B-D, SPOP and SPOPL status in PCa. (B) SPOP and SPOPL status in TCGA provisional dataset. (C) Heterozygous deletion in a region including SPOP (17q21.33) in the MDA PCa 101 PDX identified by aCGH. (D) SPOP and SPOPL status in SU2C/PCF dream team dataset. Data from TCGA and SU2C/PCF dream team were obtained from cBioPortal (39, 40).

Similar articles

Cited by

References

    1. Beltran H, Tomlins S, Aparicio A, Arora V, Rickman D, Ayala G, et al. Aggressive variants of castration-resistant prostate cancer. Clin Cancer Res. 2014;20(11):2846–50. - PMC - PubMed
    1. Logothetis CJ, Gallick GE, Maity SN, Kim J, Aparicio A, Efstathiou E, et al. Molecular classification of prostate cancer progression: foundation for marker-driven treatment of prostate cancer. Cancer discovery. 2013;3(8):849–61. - PMC - PubMed
    1. Vlachostergios PJ, Puca L, and Beltran H. Emerging Variants of Castration-Resistant Prostate Cancer. Current oncology reports. 2017;19(5):32. - PMC - PubMed
    1. Navone NM, van Weerden WM, Vessella RL, Williams ED, Wang Y, Isaacs JT, et al. Movember GAP1 PDX project: An international collection of serially transplantable prostate cancer patient-derived xenograft (PDX) models. Prostate. 2018;78(16):1262–82. - PubMed
    1. Li ZG, Mathew P, Yang J, Starbuck MW, Zurita AJ, Liu J, et al. Androgen receptor-negative human prostate cancer cells induce osteogenesis in mice through FGF9-mediated mechanisms. J Clin Invest. 2008;118(8):2697–710. - PMC - PubMed

Publication types

Substances