. 2020 Jun 23;5(3):e00292-20.
doi: 10.1128/mSystems.00292-20.

High-Resolution Longitudinal Dynamics of the Cystic Fibrosis Sputum Microbiome and Metabolome through Antibiotic Therapy

Affiliations

High-Resolution Longitudinal Dynamics of the Cystic Fibrosis Sputum Microbiome and Metabolome through Antibiotic Therapy

Ruma Raghuvanshi et al. mSystems. .

Abstract

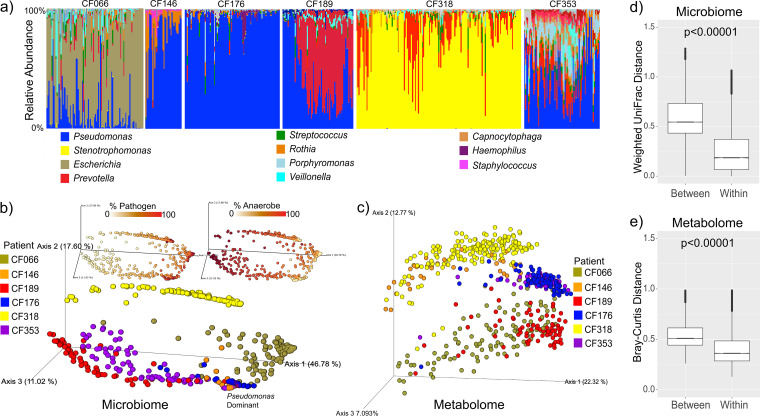
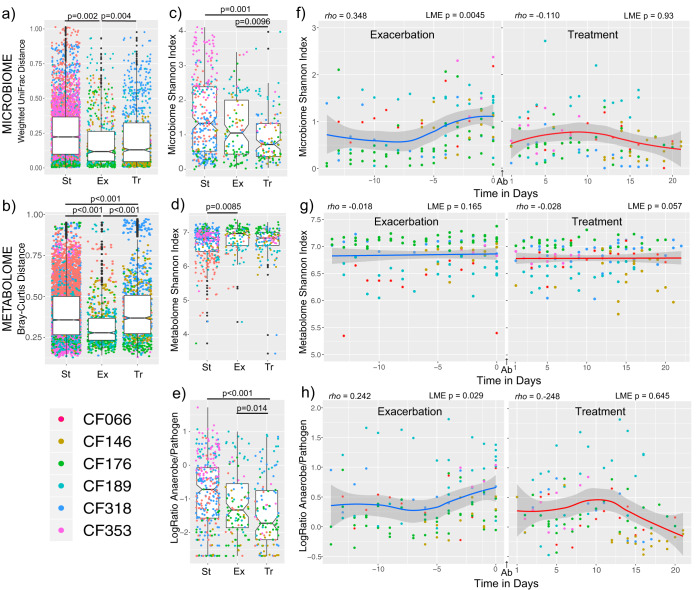
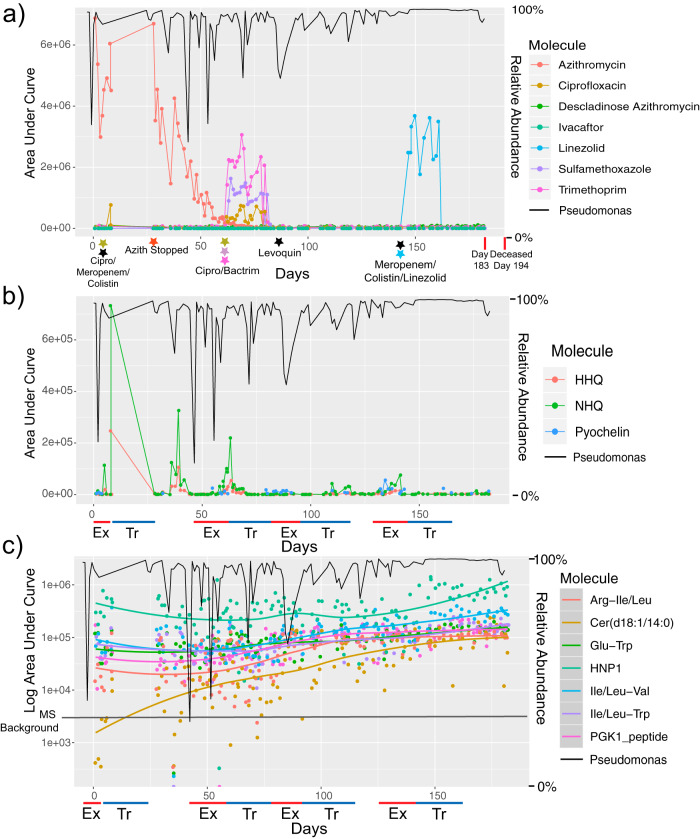
Microbial diversity in the cystic fibrosis (CF) lung decreases over decades as pathogenic bacteria such as Pseudomonas aeruginosa take over. The dynamics of the CF microbiome and metabolome over shorter time frames, however, remain poorly studied. Here, we analyze paired microbiome and metabolome data from 594 sputum samples collected over 401 days from six adult CF subjects (subject mean = 179 days) through periods of clinical stability and 11 CF pulmonary exacerbations (CFPE). While microbiome profiles were personalized (permutational multivariate analysis of variance [PERMANOVA] r 2 = 0.79, P < 0.001), we observed significant intraindividual temporal variation that was highest during clinical stability (linear mixed-effects [LME] model, P = 0.002). This included periods where the microbiomes of different subjects became highly similar (UniFrac distance, <0.05). There was a linear increase in the microbiome alpha-diversity and in the log ratio of anaerobes to pathogens with time (n = 14 days) during the development of a CFPE (LME P = 0.0045 and P = 0.029, respectively). Collectively, comparing samples across disease states showed there was a reduction of these two measures during antibiotic treatment (LME P = 0.0096 and P = 0.014, respectively), but the stability data and CFPE data were not significantly different from each other. Metabolome alpha-diversity was higher during CFPE than during stability (LME P = 0.0085), but no consistent metabolite signatures of CFPE across subjects were identified. Virulence-associated metabolites from P. aeruginosa were temporally dynamic but were not associated with any disease state. One subject died during the collection period, enabling a detailed look at changes in the 194 days prior to death. This subject had over 90% Pseudomonas in the microbiome at the beginning of sampling, and that level gradually increased to over 99% prior to death. This study revealed that the CF microbiome and metabolome of some subjects are dynamic through time. Future work is needed to understand what drives these temporal dynamics and if reduction of anaerobes correlate to clinical response to CFPE therapy.IMPORTANCE Subjects with cystic fibrosis battle polymicrobial lung infections throughout their lifetime. Although antibiotic therapy is a principal treatment for CF lung disease, we have little understanding of how antibiotics affect the CF lung microbiome and metabolome and how much the community changes on daily timescales. By analyzing 594 longitudinal CF sputum samples from six adult subjects, we show that the sputum microbiome and metabolome are dynamic. Significant changes occur during times of stability and also through pulmonary exacerbations (CFPEs). Microbiome alpha-diversity increased as a CFPE developed and then decreased during treatment in a manner corresponding to the reduction in the log ratio of anaerobic bacteria to classic pathogens. Levels of metabolites from the pathogen P. aeruginosa were also highly variable through time and were negatively associated with anaerobes. The microbial dynamics observed in this study may have a significant impact on the outcome of antibiotic therapy for CFPEs and overall subject health.

Keywords: antibiotics; cystic fibrosis; metabolome; microbiome.


Figures

FIG 1
FIG 1
(a) Bar plots representing the microbiome of sputum samples from the six subjects plotted chronologically through the collection. Gaps in sample collection are not shown. (b) PCoA plot of the weighted UniFrac distances of the microbiome data colored by subject. Inset are the samples colored on a scale representing the percentage of the anaerobe or percentage of the pathogen as defined in Data Set S1, sheet 3. Samples where Pseudomonas is the dominant ASV in the plot are highlighted. (c) PCoA plot of the Bray-Curtis distance of the metabolomic data, including all detected metabolite features colored by subject. (d and e) Within-subject and between-subject distances of microbiome (weighted UniFrac distance) data (d) and metabolome (Bray-Curtis distance) data (e). Significance was tested with an LME model with subject as a fixed effect.
FIG 2
FIG 2
The microbiome and metabolome variation around CFPEs. (a and b) Notch plots of the (a) microbiome weighted UniFrac distances and (b) metabolome Bray-Curtis distances between samples classified as CFPE (−14 days from antibiotic treatment), treatment (during 21 days of antibiotic treatment), or stable (outside these time periods). Statistical significance across the class comparisons was tested using an LME model with subject as random effects and Tukey’s post hoc tests. (c and d) Shannon index of microbiome diversity (c) and metabolome diversity (d) in samples collected during different disease states. Statistical significance across the class comparisons was tested using an LME model with subject as random effects and Tukey’s post hoc tests. (e) Notch plots of the log ratios of anaerobes to pathogens in samples classified as CFPE, treatment, or stable. (Statistics are presented as described above). (f and g) Shannon index of microbiome diversity (f) and metabolome diversity (g) through the 14 days prior to a CFPE and the 21 days of treatment. Spearman’s rho and the corresponding P value from an LME model are shown for the regression with time in days. (h) Log ratio of anaerobes to pathogens through the 14 days prior to a CFPE and the 21 days of treatment. (Statistics are presented as described for panel f). Antibiotics were administered between day 0 and day 1 (denoted as “Ab” in panels f to h). All exacerbations for all subjects are shown in the plots.
FIG 3
FIG 3
Microbial and metabolite changes prior to death of subject CF176. (a) Area under curve abundance of antibiotics detected in the metabolomics data from this subject (left y axis). The right y axis shows the abundance of Pseudomonas in the microbiome data plotted as a black line for reference. The x-axis data represent continuous time in days of sample collection for this subject. Black stars indicate antibiotics administered to the subject but not detected in the metabolomic data. (b) Area under curve abundance of Pseudomonas aeruginosa virulence-associated metabolites detected in the metabolomics data (left y axis). The right y axis shows the abundance of Pseudomonas in the microbiome data plotted as a black line for reference. (c) Log10 area under curve abundance of increasing levels of metabolites in CF176 through the collection time. The abundances of the metabolites are plotted along with the locally estimated scatterplot smoothing (LOESS) regression line for each molecule. The Pseudomonas relative abundance data are again plotted as a black line on the right y axis for reference. Ex, exacerbation; HNP1, human neutrophil peptide 1; PGK1, phosphoglycerate kinase 1; Tr, treatment.

References

    1. Zhao J, Schloss PD, Kalikin LM, Carmody LA, Foster BK, Petrosino JF, Cavalcoli JD, VanDevanter DR, Murray S, Li JZ, Young VB, LiPuma JJ. 2012. Decade-long bacterial community dynamics in cystic fibrosis airways. Proc Natl Acad Sci U S A 109:5809–5814. doi:10.1073/pnas.1120577109. - DOI - PMC - PubMed
    1. Coburn B, Wang PW, Diaz Caballero J, Clark ST, Brahma V, Donaldson S, Zhang Y, Surendra A, Gong Y, Elizabeth Tullis D, Yau YCW, Waters VJ, Hwang DM, Guttman DS. 2015. Lung microbiota across age and disease stage in cystic fibrosis. Sci Rep 5:10241. doi:10.1038/srep10241. - DOI - PMC - PubMed
    1. Caverly LJ, Zhao J, LiPuma JJ. 2015. Cystic fibrosis lung microbiome: opportunities to reconsider management of airway infection. Pediatr Pulmonol 50(Suppl 4):S31–S38. doi:10.1002/ppul.23243. - DOI - PubMed
    1. Quinn RA, Whiteson K, Lim Y-W, Salamon P, Bailey B, Mienardi S, Sanchez SE, Blake D, Conrad D, Rohwer F. 2015. A Winogradsky-based culture system shows an association between microbial fermentation and cystic fibrosis exacerbation. ISME J 9:1052–1052. doi:10.1038/ismej.2014.266. - DOI - PMC - PubMed
    1. Carmody LA, Caverly LJ, Foster BK, Rogers MAM, Kalikin LM, Simon RH, VanDevanter DR, LiPuma JJ. 2018. Fluctuations in airway bacterial communities associated with clinical states and disease stages in cystic fibrosis. PLoS One 13:e0194060. doi:10.1371/journal.pone.0194060. - DOI - PMC - PubMed