. 2020 Jul 7;117(27):15581-15590.
doi: 10.1073/pnas.2001788117. Epub 2020 Jun 23.

Multifaceted deregulation of gene expression and protein synthesis with age

Affiliations

Multifaceted deregulation of gene expression and protein synthesis with age

Aleksandra S Anisimova et al. Proc Natl Acad Sci U S A. .

Abstract

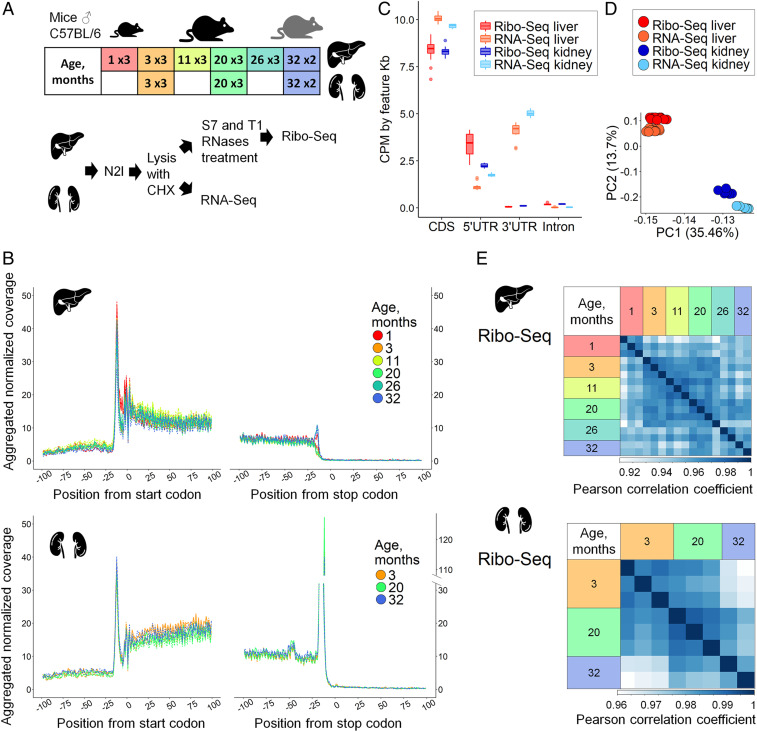
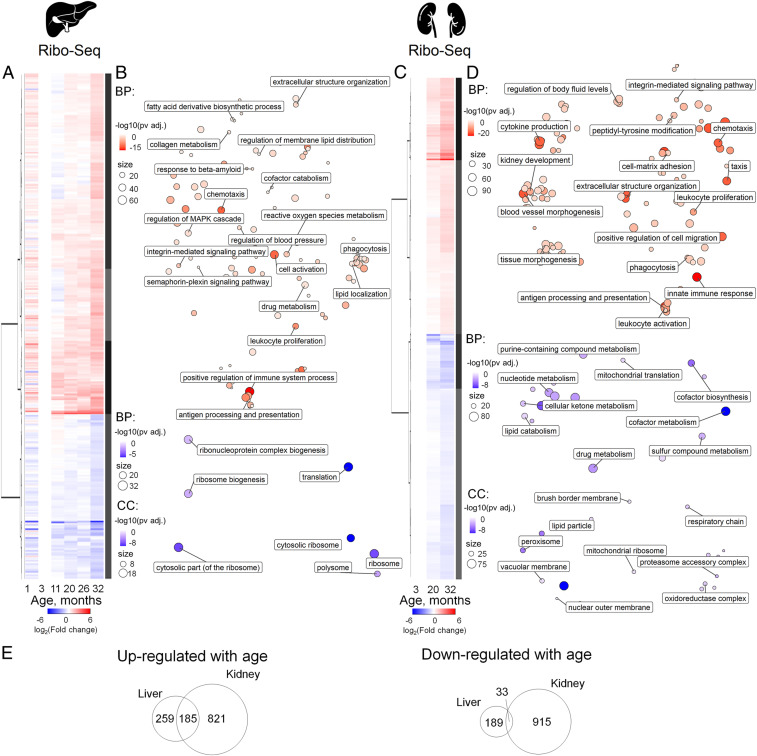
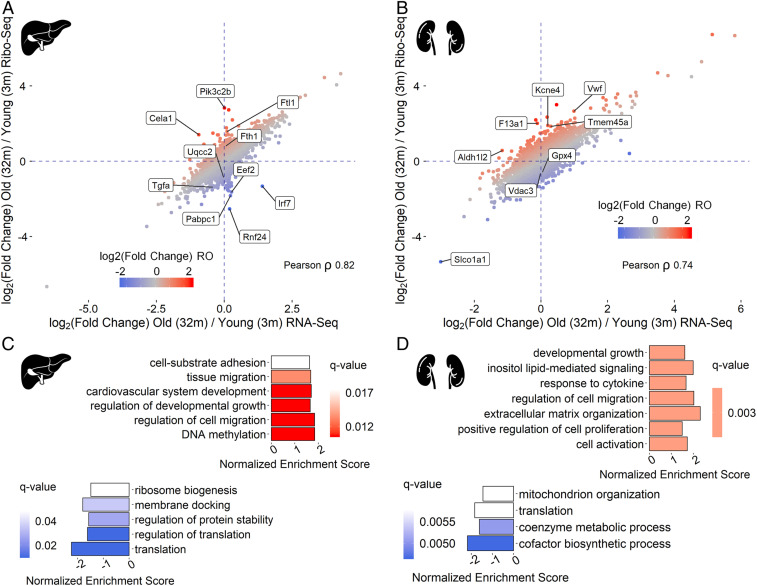
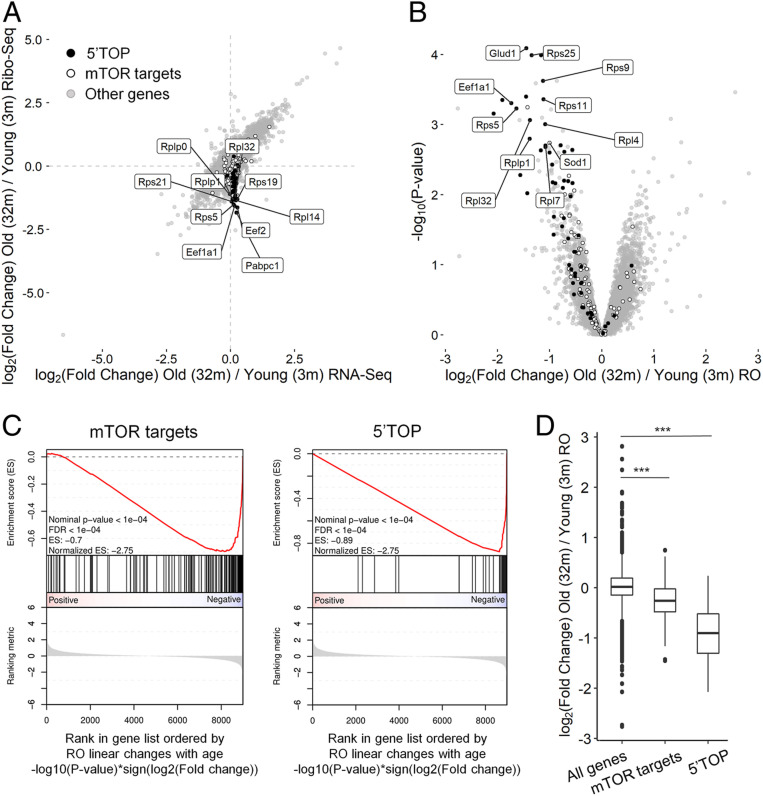
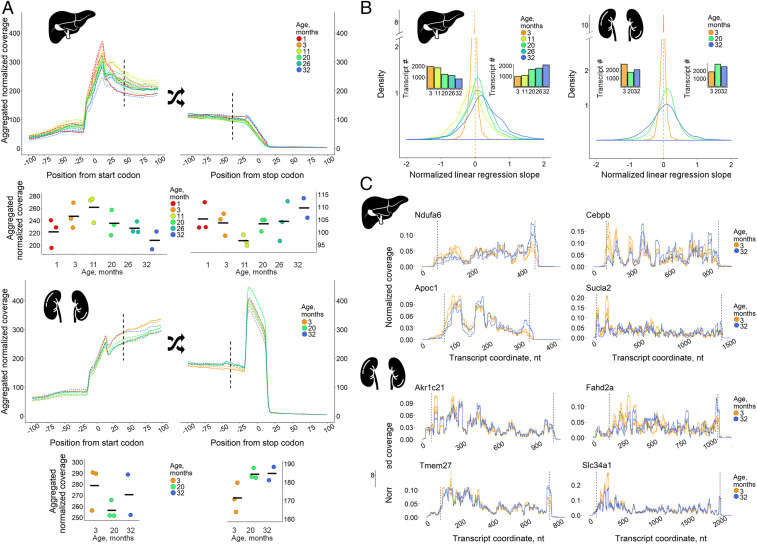
Protein synthesis represents a major metabolic activity of the cell. However, how it is affected by aging and how this in turn impacts cell function remains largely unexplored. To address this question, herein we characterized age-related changes in both the transcriptome and translatome of mouse tissues over the entire life span. We showed that the transcriptome changes govern those in the translatome and are associated with altered expression of genes involved in inflammation, extracellular matrix, and lipid metabolism. We also identified genes that may serve as candidate biomarkers of aging. At the translational level, we uncovered sustained down-regulation of a set of 5'-terminal oligopyrimidine (5'-TOP) transcripts encoding protein synthesis and ribosome biogenesis machinery and regulated by the mTOR pathway. For many of them, ribosome occupancy dropped twofold or even more. Moreover, with age, ribosome coverage gradually decreased in the vicinity of start codons and increased near stop codons, revealing complex age-related changes in the translation process. Taken together, our results reveal systematic and multidimensional deregulation of protein synthesis, showing how this major cellular process declines with age.

Keywords: 5′-TOP; aging; proteostasis; ribosome profiling; transcriptome.


Conflict of interest statement

The authors declare no competing interest.

Figures

Fig. 1.
Fig. 1.
Ribo-seq and RNA-seq of aging mouse liver and kidney. (A) Overview of experimental design. Mouse livers representing six age groups (1-, 3-, 11-, 20-, 26-, and 32-mo-old) and kidneys representing three age groups (3-, 20-, and 32-mo-old) were used. For each age, three biological replicates were prepared (three C57BL/6 male mice), except for the 32-mo group (two mice). Ribo-seq and RNA-seq libraries were prepared from the same cytoplasmic cell lysate. (B) Metagene profiles of ribosomal footprint 5′ ends in 200-nt windows centered at start and stop codons built for 2,920 and 4,566 transcripts for liver and kidney, respectively. For each transcript, raw Ribo-seq coverage was normalized to the sum of transcript coverage divided by its length. Normalized transcript coverage in the window was then aggregated for all selected transcripts. (C) Distribution of Ribo-seq and RNA-seq coverage in different gene regions. (D) Principal-component analysis (PCA) of 8,562 genes in Ribo-seq and RNA-seq datasets of mouse liver and kidney. (E) Heatmaps of Pearson correlation coefficients for replicates of mouse liver and kidney analyzed by Ribo-seq. For PCA and calculation of Pearson correlation coefficients, and further in the study, Ribo-seq was analyzed together with the RNA-seq dataset, but separately for organs. In total, the number of genes covered in each sample was 8,992 in liver and 11,461 in kidney.
Fig. 2.
Fig. 2.
Expression profiling of aging mouse liver and kidney by Ribo-seq. (A and C) Heatmap of age-related gene expression changes in liver (A) and kidney (C). For each age, differential expression, in comparison to that of 3-mo-old mice, was calculated. Data from three mice per age were analyzed except for the 32-mo-old samples (two mice). For DE genes with adjusted P value less than 0.05, at least in one age compared to 3 mo old, log2(Fold change) values were clustered and presented on a heatmap (Dataset S2). The number of DE genes is summarized in SI Appendix, Fig. S3. (B and D) GO BP (biological process) and GO CC (cellular compartment) functional enrichment of genes up-regulated (red) or down-regulated (blue) with age in liver (B) and kidney (D) (Dataset S3). (E) Comparison of gene sets differentially expressed in liver and kidney. Venn diagrams show genes up- or down-regulated with age according to Ribo-seq data.
Fig. 3.
Fig. 3.
Age-dependent changes in ribosome occupancy of functional gene groups. (A and B) Comparison of transcriptional (RNA-seq) and translational output (Ribo-seq) for liver (A) and kidney (B) of 32-mo-old mice (two replicates) vs. 3-mo-old-mice (three replicates) (Dataset S2). (C and D) Functional groups of genes with age-related changes in RO presented as the GSEA results. RO linear changes with age (from 3- to 32-mo-old mice) were estimated with edgeR (14 mice in total). Genes were sorted according to their signed P values [−log10(P value)*sign(log2(Fold change))], in liver (C) and kidney (D). GO BP terms with q value less than 0.25 are shown (Dataset S3).
Fig. 4.
Fig. 4.
Decreased ribosome occupancy of transcripts encoding ribosomal and other translation-related proteins with age in liver. (A) Comparison of transcriptome (RNA-seq) and translation output (Ribo-seq) log2(Fold change) between 32-mo-old mice (two mice) and 3-mo-old-mice (three mice). (B) The volcano plot shows the log2(Fold change) of the RO between 32-mo-old mice (two mice) and 3-mo-old-mice (three mice). (C) GSEA of age-related changes in RO of 41 5′-TOP and 160 mTOR-sensitive genes (59) in liver. RO linear changes with age (from 3- to 32-mo-old mice) were estimated with edgeR (14 mice in total). Genes were sorted according to their signed P values [−log10(P value)*sign(log2(Fold change))]. (D) Box plot showing distribution of mTOR regulated and 5′-TOP genes ROs. Statistical significance was calculated with Mann–Whitney U test.
Fig. 5.
Fig. 5.
Gradual age-related rearrangement of ribosome footprints toward the 3′ end of coding sequence. (A) Metagene profiles of ribosomal coverage in the vicinity of start and stop codons (200-nt windows) of 2,920 and 4,566 transcripts for liver and kidney, respectively. Metagene coverage values at +42-nt position from start codons and at −42-nt position from stop codons are presented on separate graphs below the main graphs (coverage values in replicates, mean shown as horizontal lines). (B) Distribution of linear regression slopes for ribosome footprint profiles normalized to mean coverage at 3 mo and smoothed with the relative transcript coordinate as the predictor variable (SI Appendix, Supplementary Methods, section 5). Bar plots depict the number of transcripts with negative (Left) and positive (Right) slopes. Data from three mice per age were analyzed except for the 32-mo-old samples (two mice). (C) Representative transcripts exhibiting increased ribosome footprint coverage in liver and kidney with age. The dashed lines denote start and stop codons.

Similar articles

Cited by

References

    1. Hipp M. S., Kasturi P., Hartl F. U., The proteostasis network and its decline in ageing. Nat. Rev. Mol. Cell Biol. 20, 421–435 (2019). - PubMed
    1. Steffen K. K., Dillin A., A ribosomal perspective on proteostasis and aging. Cell Metab. 23, 1004–1012 (2016). - PubMed
    1. Morimoto R. I., Cuervo A. M., Proteostasis and the aging proteome in health and disease. J. Gerontol. A Biol. Sci. Med. Sci. 69 (suppl. 1), S33–S38 (2014). - PMC - PubMed
    1. Gerashchenko M. V., Peterfi Z., Gladyshev V. N., Organ-specific translation elongation rates measured by in vivo ribosome profiling. bioRxiv:279257 (8 March 2018).
    1. Treaster S. B., et al. ., Superior proteome stability in the longest lived animal. Age 36, 9597 (2014). - PMC - PubMed

Publication types