

Repulsive guidance molecules lock growth differentiation factor 5 in an inhibitory complex
- PMID: 32576689
- PMCID: PMC7354924
- DOI: 10.1073/pnas.2000561117
Repulsive guidance molecules lock growth differentiation factor 5 in an inhibitory complex
Abstract
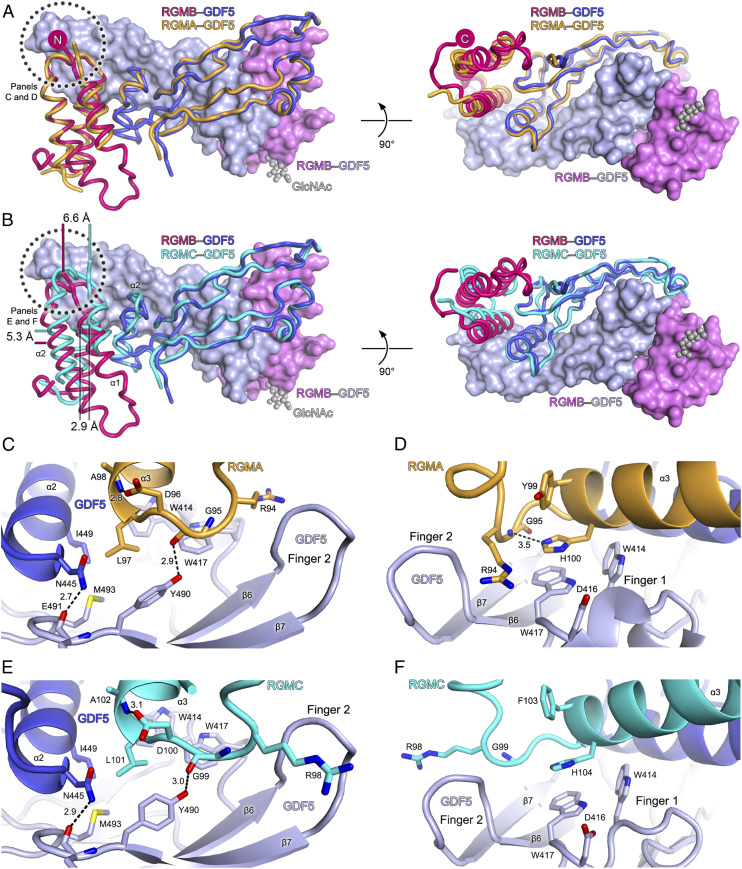
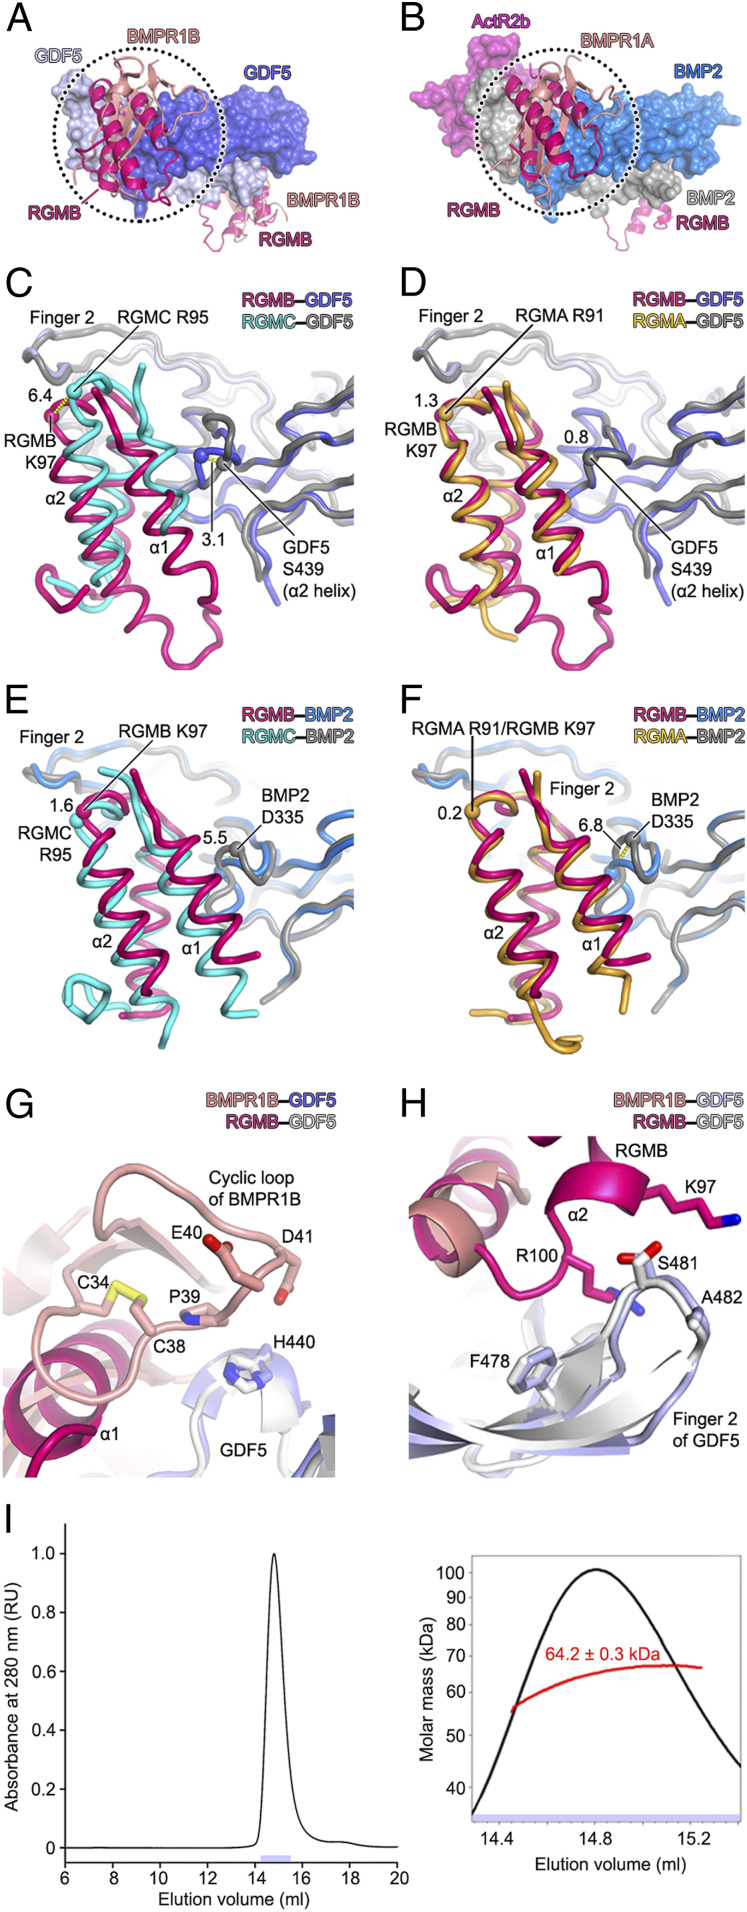
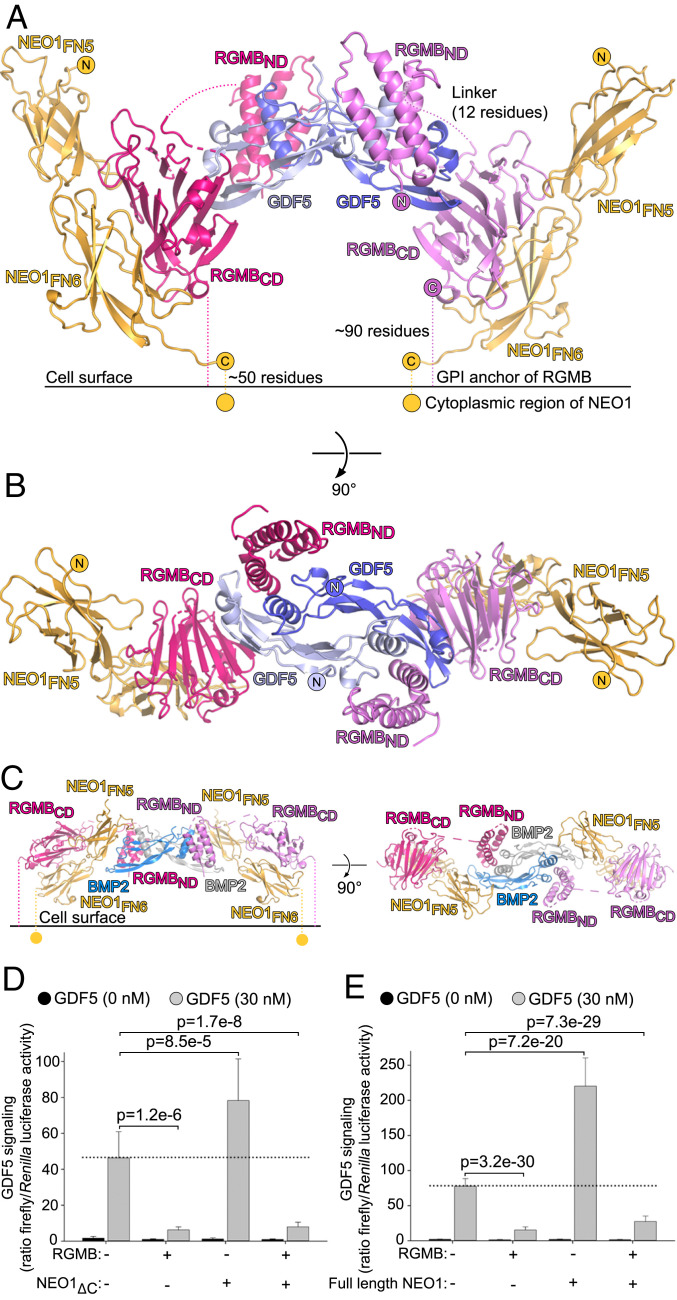
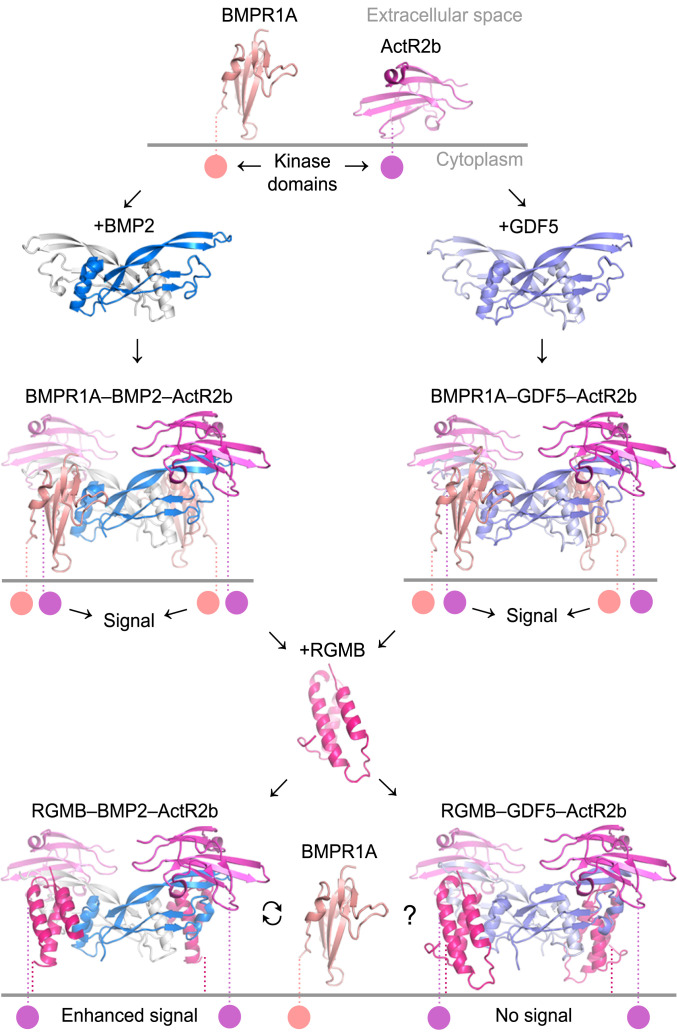
Repulsive guidance molecules (RGMs) are cell surface proteins that regulate the development and homeostasis of many tissues and organs, including the nervous, skeletal, and immune systems. They control fundamental biological processes, such as migration and differentiation by direct interaction with the Neogenin (NEO1) receptor and function as coreceptors for the bone morphogenetic protein (BMP)/growth differentiation factor (GDF) family. We determined crystal structures of all three human RGM family members in complex with GDF5, as well as the ternary NEO1-RGMB-GDF5 assembly. Surprisingly, we show that all three RGMs inhibit GDF5 signaling, which is in stark contrast to RGM-mediated enhancement of signaling observed for other BMPs, like BMP2. Despite their opposite effect on GDF5 signaling, RGMs occupy the BMP type 1 receptor binding site similar to the observed interactions in RGM-BMP2 complexes. In the NEO1-RGMB-GDF5 complex, RGMB physically bridges NEO1 and GDF5, suggesting cross-talk between the GDF5 and NEO1 signaling pathways. Our crystal structures, combined with structure-guided mutagenesis of RGMs and BMP ligands, binding studies, and cellular assays suggest that RGMs inhibit GDF5 signaling by competing with GDF5 type 1 receptors. While our crystal structure analysis and in vitro binding data initially pointed towards a simple competition mechanism between RGMs and type 1 receptors as a possible basis for RGM-mediated GDF5 inhibition, further experiments utilizing BMP2-mimicking GDF5 variants clearly indicate a more complex mechanism that explains how RGMs can act as a functionality-changing switch for two structurally and biochemically similar signaling molecules.
Keywords: Neogenin; Repulsive guidance molecule; TGFβ/BMP signaling; cell surface receptor; structural biology.
Copyright © 2020 the Author(s). Published by PNAS.
Conflict of interest statement
The authors declare no competing interest.
Figures


Similar articles
-
Repulsive guidance molecule is a structural bridge between neogenin and bone morphogenetic protein.Nat Struct Mol Biol. 2015 Jun;22(6):458-65. doi: 10.1038/nsmb.3016. Epub 2015 May 4. Nat Struct Mol Biol. 2015. PMID: 25938661 Free PMC article.
-
Repulsive guidance molecule (RGM) family proteins exhibit differential binding kinetics for bone morphogenetic proteins (BMPs).PLoS One. 2012;7(9):e46307. doi: 10.1371/journal.pone.0046307. Epub 2012 Sep 27. PLoS One. 2012. PMID: 23029472 Free PMC article.
-
Repulsive guidance molecules, novel bone morphogenetic protein co-receptors, are key regulators of the growth and aggressiveness of prostate cancer cells.Int J Oncol. 2012 Feb;40(2):544-50. doi: 10.3892/ijo.2011.1251. Epub 2011 Nov 4. Int J Oncol. 2012. PMID: 22076499
-
RGMs: Structural Insights, Molecular Regulation, and Downstream Signaling.Trends Cell Biol. 2017 May;27(5):365-378. doi: 10.1016/j.tcb.2016.11.009. Epub 2016 Dec 19. Trends Cell Biol. 2017. PMID: 28007423 Free PMC article. Review.
-
Repulsive guidance molecules (RGMs) and neogenin in bone morphogenetic protein (BMP) signaling.Mol Reprod Dev. 2013 Sep;80(9):700-17. doi: 10.1002/mrd.22199. Epub 2013 Jul 19. Mol Reprod Dev. 2013. PMID: 23740870 Free PMC article. Review.
Cited by
-
Simultaneous binding of Guidance Cues NET1 and RGM blocks extracellular NEO1 signaling.Cell. 2021 Apr 15;184(8):2103-2120.e31. doi: 10.1016/j.cell.2021.02.045. Epub 2021 Mar 18. Cell. 2021. PMID: 33740419 Free PMC article.
-
Cell type-specific transforming growth factor-β (TGF-β) signaling in the regulation of salivary gland fibrosis and regeneration.J Oral Biol Craniofac Res. 2024 May-Jun;14(3):257-272. doi: 10.1016/j.jobcr.2024.03.005. Epub 2024 Mar 21. J Oral Biol Craniofac Res. 2024. PMID: 38559587 Free PMC article.
-
A supernumerary "B-sex" chromosome drives male sex determination in the Pachón cavefish, Astyanax mexicanus.Curr Biol. 2021 Nov 8;31(21):4800-4809.e9. doi: 10.1016/j.cub.2021.08.030. Epub 2021 Sep 7. Curr Biol. 2021. PMID: 34496222 Free PMC article.
-
The role of axon guidance molecules in the pathogenesis of epilepsy.Neural Regen Res. 2025 May 1;20(5):1244-1257. doi: 10.4103/NRR.NRR-D-23-01620. Epub 2024 Apr 16. Neural Regen Res. 2025. PMID: 39075893 Free PMC article.
-
Molecular mechanism of BMP signal control by Twisted gastrulation.Nat Commun. 2024 Jun 11;15(1):4976. doi: 10.1038/s41467-024-49065-8. Nat Commun. 2024. PMID: 38862520 Free PMC article.
References
-
- Wrana J. L., Attisano L., Wieser R., Ventura F., Massagué J., Mechanism of activation of the TGF-beta receptor. Nature 370, 341–347 (1994). - PubMed
-
- Thomas J. T., et al. ., A human chondrodysplasia due to a mutation in a TGF-beta superfamily member. Nat. Genet. 12, 315–317 (1996). - PubMed
-
- Thomas J. T., et al. ., Disruption of human limb morphogenesis by a dominant negative mutation in CDMP1. Nat. Genet. 17, 58–64 (1997). - PubMed
Publication types
MeSH terms
Substances
Grants and funding
LinkOut - more resources
Full Text Sources
Other Literature Sources
Molecular Biology Databases
