. 2020 Jul 7;117(27):15852-15861.
doi: 10.1073/pnas.1920776117. Epub 2020 Jun 23.

Up-regulated cytotrophoblast DOCK4 contributes to over-invasion in placenta accreta spectrum

Affiliations

Up-regulated cytotrophoblast DOCK4 contributes to over-invasion in placenta accreta spectrum

Leah McNally et al. Proc Natl Acad Sci U S A. .

Abstract

In humans, a subset of placental cytotrophoblasts (CTBs) invades the uterus and its vasculature, anchoring the pregnancy and ensuring adequate blood flow to the fetus. Appropriate depth is critical. Shallow invasion increases the risk of pregnancy complications, e.g., severe preeclampsia. Overly deep invasion, the hallmark of placenta accreta spectrum (PAS), increases the risk of preterm delivery, hemorrhage, and death. Previously a rare condition, the incidence of PAS has increased to 1:731 pregnancies, likely due to the rise in uterine surgeries (e.g., Cesarean sections). CTBs track along scars deep into the myometrium and beyond. Here we compared the global gene expression patterns of CTBs from PAS cases to gestational age-matched control cells that invaded to the normal depth from preterm birth (PTB) deliveries. The messenger RNA (mRNA) encoding the guanine nucleotide exchange factor, DOCK4, mutations of which promote cancer cell invasion and angiogenesis, was the most highly up-regulated molecule in PAS samples. Overexpression of DOCK4 increased CTB invasiveness, consistent with the PAS phenotype. Also, this analysis identified other genes with significantly altered expression in this disorder, potential biomarkers. These data suggest that CTBs from PAS cases up-regulate a cancer-like proinvasion mechanism, suggesting molecular as well as phenotypic similarities in the two pathologies.

Keywords: DOCK4; cytotrophoblast; placenta accreta spectrum; transcriptomics.


Conflict of interest statement

Competing interest statement: S.J.F. is a consultant for Novo Nordisk.

Figures

Fig. 1.
Fig. 1.
CTB over-invasion and faulty decidualization at the maternal-fetal interface in PAS cases. Tissue sections from each case were: 1) stained with H&E (A, D, G, and J); 2) reacted with anti-CK to identify CTBs (B, E, H, and K); or reacted with anti-vimentin to identify decidual cells (C, F, I, and L). Gestational age-matched samples from nPTB cases served as controls. In nPTB cases, CK-positive CTBs were intercalated among vimentin-expressing cells of the decidua basalis (AC). In equivalent PAS samples, CK-positive CTBs were evident in the near absence of vimentin-positive cells (DF). The results from analyses of the basal plate region of additional case and control samples is shown in SI Appendix, Fig. S1. In nPTB, CTBs of the smooth chorion (scCTB) were juxtaposed with vimentin-positive cells of the decidua parietalis (GI). In comparable specimens from PAS cases, the CK-positive CTB layer had a normal appearance with no signs of invasion (JL). The results from analyses of the fetal membranes and adjacent decidua of additional case and control samples is shown in SI Appendix, Fig. S2. However, the adjacent maternal cells had low-to-no vimentin signals. PV, placental villi; BP, basal plate; FV, floating villi; FM, fetal membranes; SC, smooth chorion; MYO, myometrium. (Scale bar, 100 μm.)
Fig. 2.
Fig. 2.
In PAS cases, invasive CTBs up-regulated HLA-G expression in the basal plate and the adjacent myometrium (n = 7). The montages in AC were created from photomicrographs of tissue sections that were combined into a single image. (A) H&E staining showed that many of the samples contained the entire uterine wall as they were from hysterectomies done at the time of delivery. (B) Adjacent sections were double immunostained with anti-CK and anti-α-SMA), which enabled visualization of CTBs and uterine muscle cells, respectively. As illustrated by this case, placental cells were found throughout the muscle layer of the uterus. (C) Despite abnormally deep invasion, CTBs throughout the uterine wall up-regulated the expression of HLA-G. MYO, myometrium; BV, blood vessel; FV, floating villi. (Scale bar, 100 µm.)
Fig. 3.
Fig. 3.
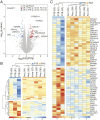
Transcriptomic profiling revealed PAS-associated CTB gene signatures. We compared the gene expression profiles of CTBs from PAS (over-invasion; n = 6) and gestation-matched nPTB cases (normal invasion; n = 3). There was no statistically significant difference in the gestational ages between the two sample sets (P = 0.11). (A) The statistical significance versus gene expression fold change is displayed as a volcano plot. In total, 118 genes were DE between the sample types (blue dots down-regulated and red dots up-regulated; P < 0.05). (B) Hierarchical clustering of the DE genes separated the two groups. (C) The 25 most highly up-regulated (Top cluster) and down-regulated genes (Bottom cluster) are shown. OE, overexpressed.
Fig. 4.
Fig. 4.
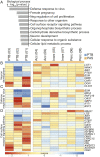
Mapping of the PAS-associated DE genes into GO Biological Processes. (A) DAVID was used to identify enriched GO Biological Processes for the DE genes (criteria: P ≤ 0.05; number of DE genes associated with enriched term ≥ 3). GO enrichment scores (−log10 P value) are displayed for selected terms that were associated with the up-regulated or down-regulated DE gene subsets. Clustering of DE genes within terms is shown for: (B) neuron development, (C) response to virus, and (D) cell surface receptor signaling pathway. The Z-scores represent the relative deviation in expression as compared to the average expression levels of all samples.
Fig. 5.
Fig. 5.
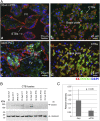
qRT-PCR validation of a subset of PAS-associated DE genes and extending analysis of B2M overexpression in PAS to the protein level. (A) We used qRT-PCR to validate expression, at the mRNA level, of specific genes identified as DE in the microarray analysis. For these experiments, we assayed two of the original PAS samples and five that were subsequently collected (n = 7). An equal number of CTB samples isolated from nPTB cases served as controls. The results confirmed higher expression of DOCK4, B2M, PAPD4, and ANKRD44 in accreta vs. nPTB; PRL was down-regulated. Circles represent nPTB samples and triangles represent PAS samples. Asterisks indicate significant differences between nPTB and PAS samples within each experiment (P < 0.05). (B) To confirm that differences in mRNA expression were also observed at the protein level, we immunolocalized B2M in biopsies from nPTB (n = 5) and PAS cases (n = 7). Lower immunoreactivity with anti-B2M was observed in association with CK-positive CTBs from nPTB (A and B) as compared to a PAS (increta; ICT) case (C and D). (C and D) Immunoblot analyses of CTB lysates corroborated these observations (n = 3 technical replicates). On average, B2M was expressed at fivefold higher levels by CTBs isolated from PAS vs. nPTB cases (P < 0.01). dd, ∆∆; FV, floating villi; STBs, syncytiotrophoblasts; ACT accreta; PCT, percreta. (Scale bars, 25 μm.)
Fig. 6.
Fig. 6.
Validation of CTB overexpression of DOCK4 in PAS versus nPTB cases. (A) We confirmed up-regulation of DOCK4 at the protein level. Immunolocalization failed to detect binding of anti-DOCK4 to STBs or CTBs in floating villi (FV) from either controls or cases (A and C). Analysis of basal plate biopsies from pregnancies complicated by nPTB (n = 5) revealed a relatively faint but consistent signal that was associated with invasive CTBs (B), which was significantly stronger in equivalent PAS samples (D, n = 7). (B and C) Immunoblotting confirmed and enabled quantification of this result. Four of the six CTB lysates isolated from PAS cases had an immunoreactive band that corresponded to the molecular weight of DOCK4 (225 kDa) and lower molecular weight splice variants. Notably, these bands were not observed in the two accreta samples. DOCK4 expression was ∼threefold higher in the setting of PAS as compared to PTB. ICT, increta; ACT accreta; PCT, percreta; IB, immunoblot. (Scale bars, 25 μm.)
Fig. 7.
Fig. 7.
Overexpression of DOCK4-increased CTB invasion. Cells for immunoblotting or quantification of invasion were processed at the conclusion of the experiment (36 h). (A and B) Immunoblotting and scanning densitometry showed significantly higher DOCK4 expression (P < 0.01) associated with the CTBs that were transduced with the DOCK4-containing vector as compared to control cells that received the empty vector (n = 3 biological replicates). (C) Up-regulation of DOCK4 increased CTB invasion, on average, by ∼3.7-fold (double cross; ANOVA; P < 0.001) as compared to the level observed in the control cultures (n = 3 biological replicates). Asterisks and double dagger symbols indicate significant differences between DOCK4+ and control within each experiment (P < 0.01).

Similar articles

Cited by

References

    1. Hunkapiller N. M., Fisher S. J., Chapter 12. Placental remodeling of the uterine vasculature. Methods Enzymol. 445, 281–302 (2008). - PMC - PubMed
    1. Lacroix M. C.et al. ., Stimulation of human trophoblast invasion by placental growth hormone. Endocrinology 146, 2434–2444 (2005). - PubMed
    1. Red-Horse K.et al. ., EPHB4 regulates chemokine-evoked trophoblast responses: A mechanism for incorporating the human placenta into the maternal circulation. Development 132, 4097–4106 (2005). - PubMed
    1. Pijnenborg R., Vercruysse L., Hanssens M., The uterine spiral arteries in human pregnancy: Facts and controversies. Placenta 27, 939–958 (2006). - PubMed
    1. Ferretti C., Bruni L., Dangles-Marie V., Pecking A. P., Bellet D., Molecular circuits shared by placental and cancer cells, and their implications in the proliferative, invasive and migratory capacities of trophoblasts. Hum. Reprod. Update 13, 121–141 (2007). - PubMed

Publication types

Substances