. 2020 Jun 23;11(1):3165.
doi: 10.1038/s41467-020-16983-2.

Crystal structures of SAMHD1 inhibitor complexes reveal the mechanism of water-mediated dNTP hydrolysis

Affiliations

Crystal structures of SAMHD1 inhibitor complexes reveal the mechanism of water-mediated dNTP hydrolysis

Elizabeth R Morris et al. Nat Commun. .

Abstract

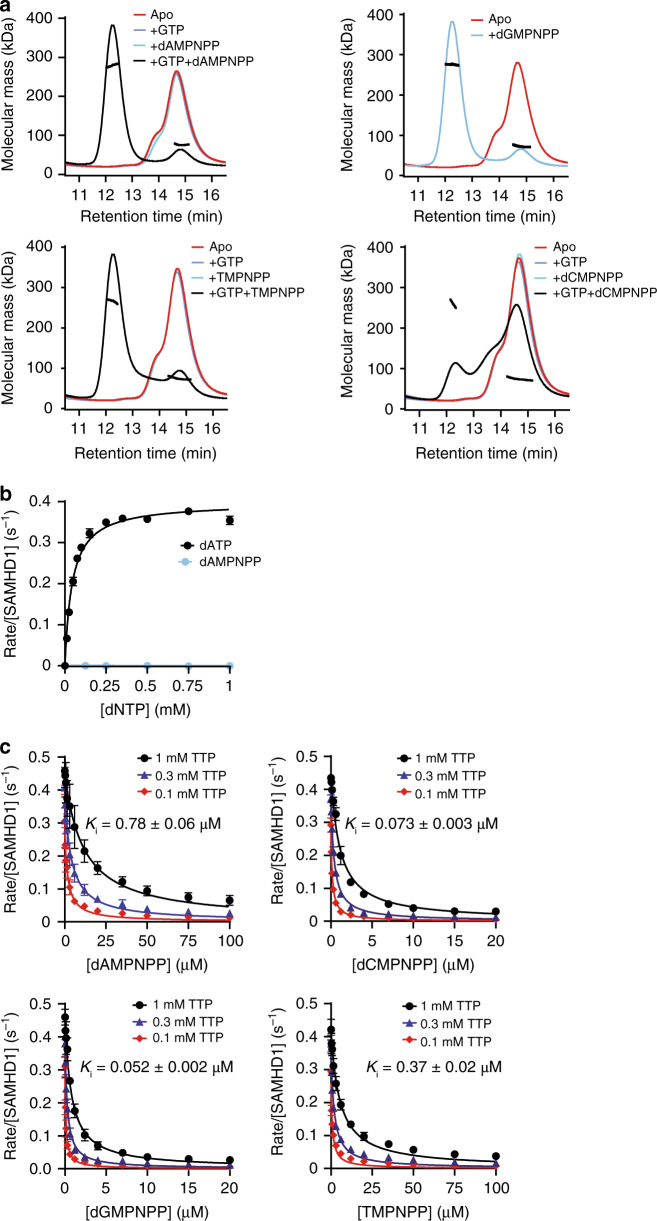
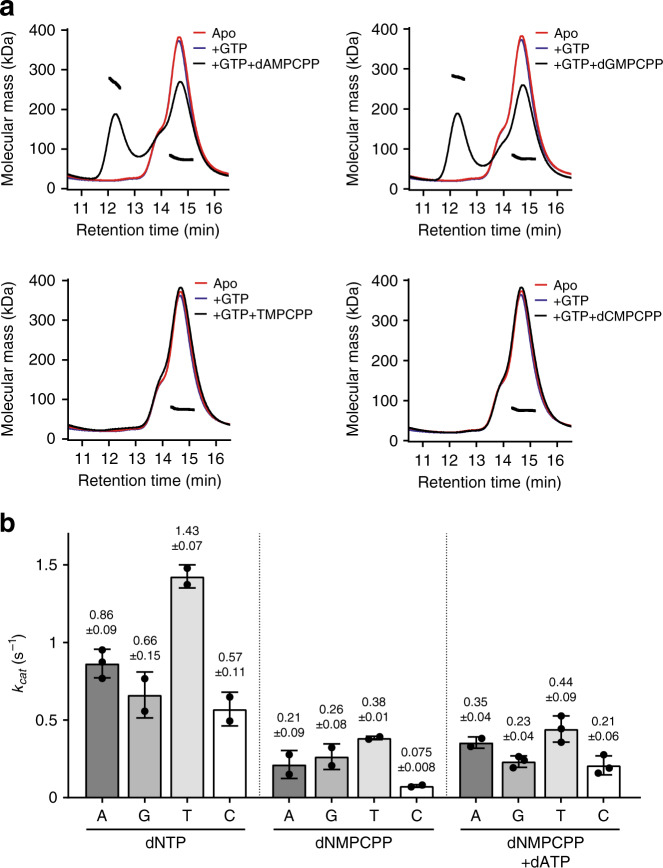
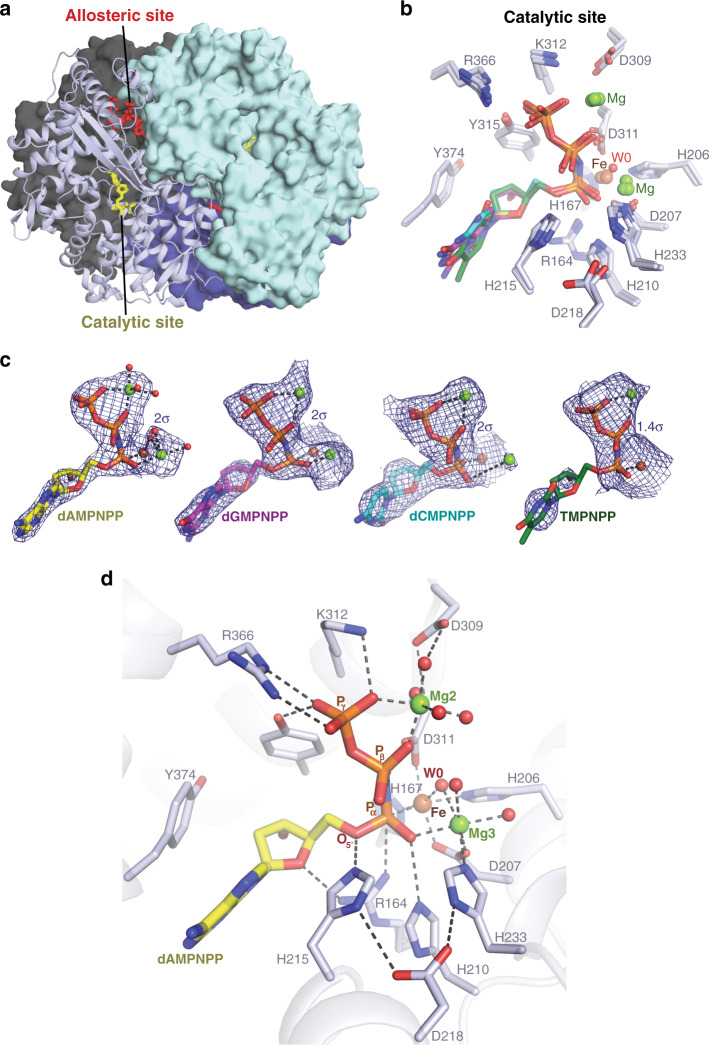
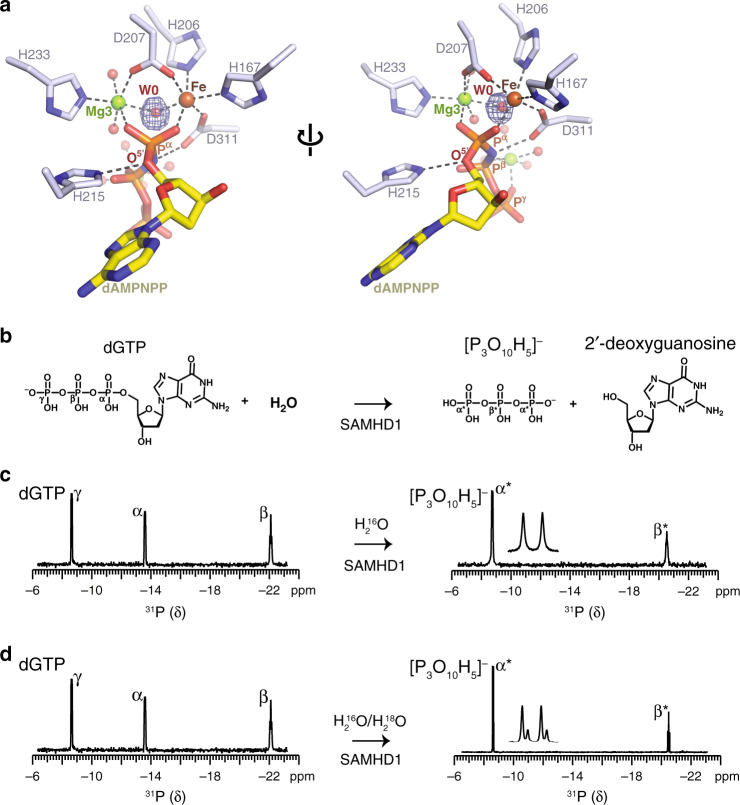
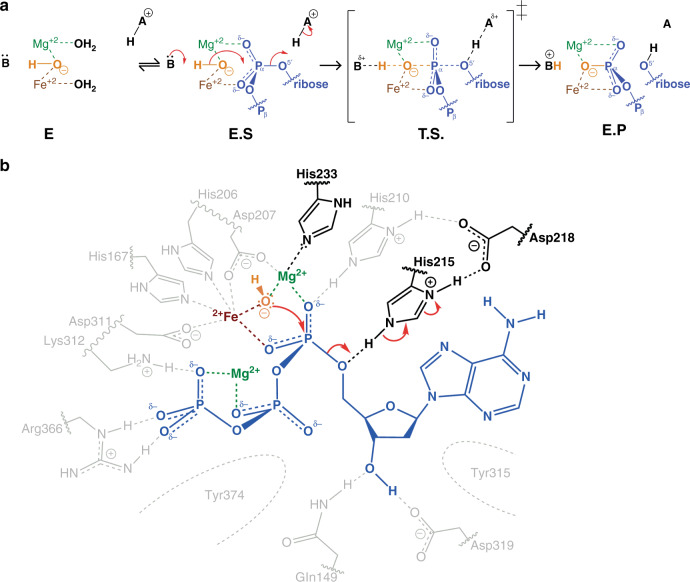
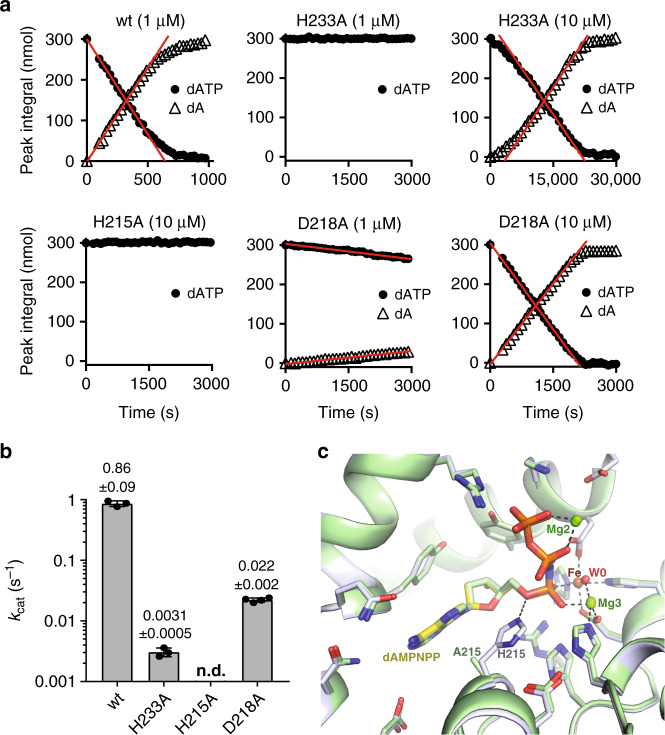
SAMHD1 regulates cellular 2'-deoxynucleoside-5'-triphosphate (dNTP) homeostasis by catalysing the hydrolysis of dNTPs into 2'-deoxynucleosides and triphosphate. In CD4+ myeloid lineage and resting T-cells, SAMHD1 blocks HIV-1 and other viral infections by depletion of the dNTP pool to a level that cannot support replication. SAMHD1 mutations are associated with the autoimmune disease Aicardi-Goutières syndrome and hypermutated cancers. Furthermore, SAMHD1 sensitises cancer cells to nucleoside-analogue anti-cancer therapies and is linked with DNA repair and suppression of the interferon response to cytosolic nucleic acids. Nevertheless, despite its requirement in these processes, the fundamental mechanism of SAMHD1-catalysed dNTP hydrolysis remained unknown. Here, we present structural and enzymological data showing that SAMHD1 utilises an active site, bi-metallic iron-magnesium centre that positions a hydroxide nucleophile in-line with the Pα-O5' bond to catalyse phosphoester bond hydrolysis. This precise molecular mechanism for SAMHD1 catalysis, reveals how SAMHD1 down-regulates cellular dNTP and modulates the efficacy of nucleoside-based anti-cancer and anti-viral therapies.


Conflict of interest statement

The authors declare no competing interests.

Figures

Fig. 1
Fig. 1. SAMHD1 tetramerisation and catalytic inhibition by dNMPNPP nucleotides.
a SEC-MALLS analysis of SAMHD1 monomer–dimer–tetramer equilibrium upon addition of dNMPNPP nucleotides. In each panel, the solid lines are the chromatograms from the output of the differential refractometer and the black scatter points are the weight-averaged molar masses determined at 1-s intervals throughout elution of chromatographic peaks, SAMHD1 monomer–dimers elute at 14–16 min, tetramers at 12 min. In each panel, the curves shown are: (red) apo-SAMHD1; (blue) SAMHD1 and 0.2 mM GTP; (cyan) SAMHD1 and 0.5 mM indicated dNMPNPP analogue; and (black) SAMHD1, 0.2 mM GTP and 0.5 mM indicated dNMPNPP analogue. For dGMPNPP, which can induce tetramer formation in the absence of GTP, only the chromatograms for the apo (red) and after addition of dGMPNPP (cyan) are shown. b Steady-state kinetic analysis of GTP-stimulated hydrolysis of dATP and dAMPNPP by SAMHD1, measured using the MDCC-PBP florescence-based coupled SAMHD1-Ppx assay. The dependence of the rate on substrate concentration is plotted for (black) dATP and (cyan) dAMPNPP. For the dATP reaction the solid line is the best fit to the data using the Michaelis–Menten expression, that gives values for the derived constants KM and kcat of 44 ± 3 µM and 0.4 ± 0.01 s−1, respectively. Error bars represent the standard error of the mean (s.e.m.) of three independent measurements. c Determination of dNMPNPP inhibition constants (Ki) using the florescence-based coupled assay. Plots show the dependence of the SAMHD1 hydrolysis rate of 0.1, 0.3 and 1 mM TTP on the concentration of each dNMPNPP. Reported Ki values (inset and Supplementary Table 1) were derived from global fitting of each 3-concentration dataset. Error bars represent the s.e.m. of three independent measurements. Source data for b and c are provided in the Source Data file.
Fig. 2
Fig. 2. SAMHD1 tetramerisation and hydrolysis of dNMPCPP analogues.
a SEC-MALLS analysis of SAMHD1 monomer–dimer–tetramer equilibrium upon addition of dNMPCPP nucleotides. In each panel, the solid lines are the chromatograms from the output of the differential refractometer and the black scatter points are the weight-averaged molar masses determined at 1-s intervals throughout elution of chromatographic peaks. In each panel, the displayed curves are: (red) apo-SAMHD1; (blue) SAMHD1 and 0.2 mM GTP; and (black) SAMHD1, 0.2 mM GTP and 0.5 mM indicated dNMPCPP analogue. b Bar chart of the apparent kcat values derived from 1H NMR data recorded for GTP-stimulated SAMHD1 hydrolysis of each dNTP, dNMPCPP and dNMPCPP/dATP reaction, see Supplementary Fig. 3. Points overlaid in each bar are the individual data measurements, the error bars represent the standard deviation (s.d.) from at least two independent measurements. The source data are provided in the Source Data file.
Fig. 3
Fig. 3. Crystal structures of SAMHD1–dNMPNPP inhibitor complexes.
a Crystal structure of D137N-SAMHD1(109-626)-XTP-dAMPNPP inhibitor complex tetramer. Three monomers are shown in surface representation with a single monomer shown in cartoon representation. Monomers are coloured cyan, dark grey, dark blue and light blue, respectively. Nucleotides bound at the active and allosteric site in the cartoon monomer are shown in stick representation and coloured yellow and red, respectively. b Structural alignment of the active sites of the D137N-SAMHD1(109-626)-XTP-dAMPNPP, D137N-SAMHD1(109-626)-XTP-dGMPNPP, wt-SAMHD1(109-626)-GTP-dATP-dCMPNPP and wt-SAMHD1(109-626)-GTP-dATP-TMPNPP structures. Overlapping-bound nucleotides and active-site residues are shown in stick representation. The carbon atoms of the base and sugar of the bound nucleotides are coloured: yellow, dAMPNPP; magenta, dGMPNPP; cyan, dCMPNPP: and green, TMPNPP. c Simulated-annealing composite omit 2Fo − Fc electron density (blue mesh) for active site-bound nucleotides in D137N-XTP-dAMPNPP, D137N-XTP-dGMPNPP, wt-GTP-dATP-dCMPNPP and wt-GTP-dATP-TMPNPP structures. Nucleotides are shown in stick representation and colour coded as in b. Metal ions are shown as spheres (Mg, green; Fe, brown). d Detailed view of the active site of the D137N-SAMHD1(109-626)-XTP-dAMPNPP inhibitor complex. The protein backbone is shown in cartoon representation, bound nucleotides and active site residues are shown in stick representation, metal ions and ordered water molecules as spheres, coloured by atom type (oxygen, red; Mg, green; Fe, brown). Hydrogen bonding and metal ion coordinate bonds are shown as dashed lines. W0 indicates the in-line attacking nucleophilic water molecule.
Fig. 4
Fig. 4. NMR analysis of water-mediated SAMHD1 catalysis.
a Detailed view of the bi-metallic centre in the SAMHD1-active site. Metal ions and coordinated water molecules are shown as spheres, coloured by atom type. W0 is the activated water molecule positioned between the HD-bound Fe and Mg3, and orientated for nucleophilic attack on the α-phosphate. The electron density shown in blue mesh is the Fo − Fc map calculated during model building prior to inclusion of W0, contoured at 6 σ. b Chemical structures of the dGTP substrate and deoxyguanosine and triphosphate products of SAMHD1 hydrolysis, the α, β and γ-phosphate of dGTP together with the α*- and β*-phosphate of triphosphate are labelled. c, d SAMHD1 hydrolysis of dGTP monitored by 31P NMR. Spectra of dGTP substrate (left) and the triphosphate product (right) after 0 and 3 h incubation with SAMHD1 are shown. Assigned 31P resonances of the α-, β- and γ-phosphate of dGTP and α- and β-phosphate of the triphosphate product species are labelled. Product resonances are marked with asterisks. An expanded view of the α*-phosphate doublet resonance is shown inset. In c the reaction was carried out in solvent comprising 1:1 mixture of H2O16 and H2O18. The satellite peaks on α*-phosphate doublet resonance result from the O18 isotope effect, demonstrating that the reaction proceeds via a nucleophilic attack from a water molecule on the α-phosphate that is subsequently transferred into the triphosphate product.
Fig. 5
Fig. 5. Catalytic mechanism of SAMHD1-dNTP hydrolysis.
a Schematic of the chemical mechanism of SAMHD1-dNTP hydrolysis. In the apo state (E) the W0 water molecule (orange) is coordinated between the HD motif-bound Fe ion and by Mg3, further water molecules take up the remaining coordination positions on the metal ions. On substrate binding, the enzyme–substrate complex (E.S) is formed and Pα oxygens replace water molecules to coordinate the Mg3 and Fe ions and also position the W0 nucleophile in line with the electron deficient α-phosphate. The reaction proceeds by adduction of the W0 nucleophile to the α-phosphate to form a trigonal-bipyramidal intermediate transition state (T.S.). The resulting accumulating negative charge is relieved by protonation of the leaving nucleoside 5′ oxygen to form the enzyme product complex (E.P). b Schematic of SAMHD1-active site conformation during the hydrolysis reaction. A bound substrate dATP nucleotide is shown in blue, W0 in orange, the HD Fe ion in brown and active site Mg ions in green. The side chains of His233 and His215 and Asp218 required for catalysis are highlighted and the direction of electron transfer is indicated by the red arrows.
Fig. 6
Fig. 6. Catalytic activity of SAMHD1-active site mutants.
a 1H NMR analysis of GTP-stimulated dATP hydrolysis by wt-SAMHD1 and active site mutants H233A, H215A and D218A. 1H NMR data were recorded for SAMHD1 hydrolysis reactions containing wt-SAMHD1 (1 µM) or active site mutants H233A (1 and 10 µM), H215A (10 µM) and D218A (1 and 10 µM) with 0.2 mM GTP AL1-activator and 0.5 mM dATP. In each panel, the integral of resolved substrate and product peak resonances is plotted against time. Initial rates of hydrolysis were determined from slopes (red lines) derived from the data measured in the linear part of the reaction. b Bar chart of the apparent kcat values derived from the data shown in a. Points overlaid in each bar are the individual data measurements, the error bars represent the s.d. of at least three independent measurements, n.d. (not detectable). The source data are provided in the Source Data file. c Overlay of the active site in the crystal structures of D137N-SAMHD1(109-626)-XTP-dApNHpp and H215A–SAMHD1(109-626)-GTP-dAMPNPP inhibitor complexes. The protein backbone is shown in cartoon representation, wt (grey) and H215A (green), bound nucleotides and active site residues are shown in stick representation, metal ions and ordered water molecules as spheres, coloured by atom type. The bound inhibitor adopts the same configuration in both the wt and H215A structures.

References

    1. Franzolin E, et al. The deoxynucleotide triphosphohydrolase SAMHD1 is a major regulator of DNA precursor pools in mammalian cells. Proc. Natl Acad. Sci. USA. 2013;110:14272–14277. - PMC - PubMed
    1. Li N, Zhang W, Cao X. Identification of human homologue of mouse IFN-gamma induced protein from human dendritic cells. Immunol. Lett. 2000;74:221–224. - PubMed
    1. Descours B, et al. SAMHD1 restricts HIV-1 reverse transcription in quiescent CD4(+) T-cells. Retrovirology. 2012;9:87. - PMC - PubMed
    1. Goldstone DC, et al. HIV-1 restriction factor SAMHD1 is a deoxynucleoside triphosphate triphosphohydrolase. Nature. 2011;480:379–382. - PubMed
    1. Powell RD, Holland PJ, Hollis T, Perrino FW. Aicardi-Goutieres syndrome gene and HIV-1 restriction factor SAMHD1 is a dGTP-regulated deoxynucleotide triphosphohydrolase. J. Biol. Chem. 2011;286:43596–43600. - PMC - PubMed

Publication types

Supplementary concepts