. 2020 Jun 23;11(1):3168.
doi: 10.1038/s41467-020-16971-6.

Piezo2 expressed in proprioceptive neurons is essential for skeletal integrity

Affiliations

Piezo2 expressed in proprioceptive neurons is essential for skeletal integrity

Eran Assaraf et al. Nat Commun. .

Abstract

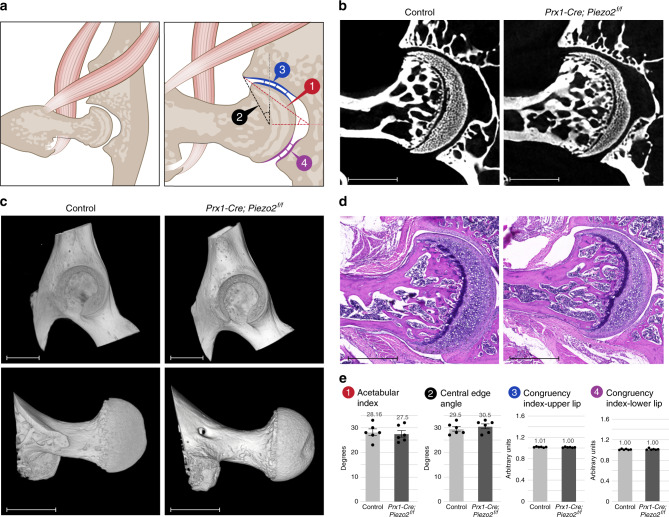
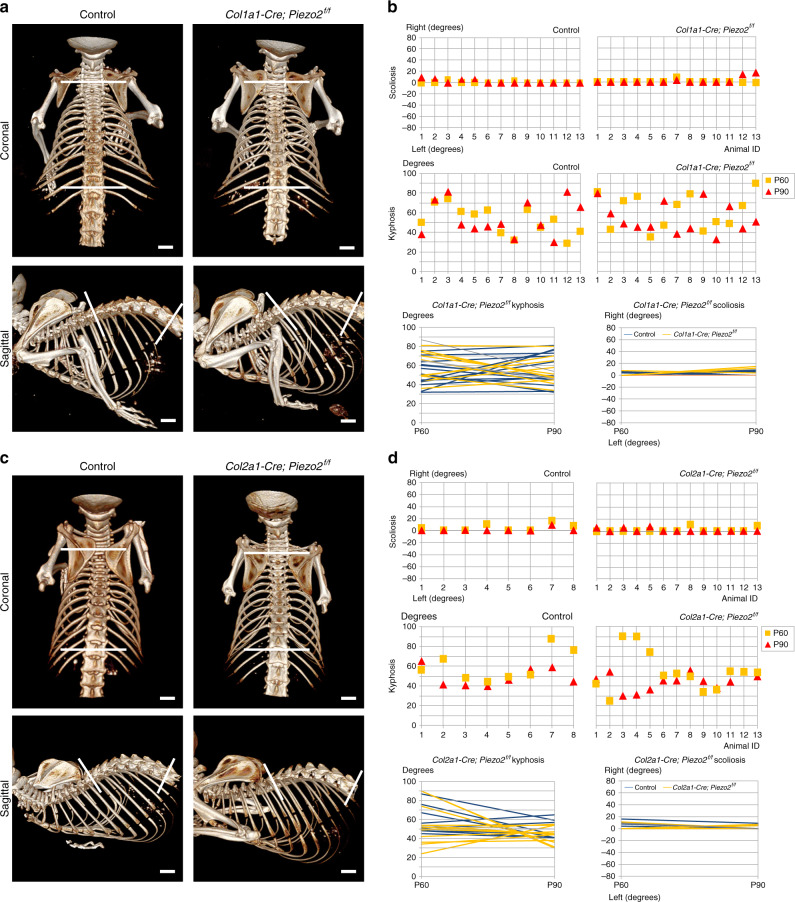
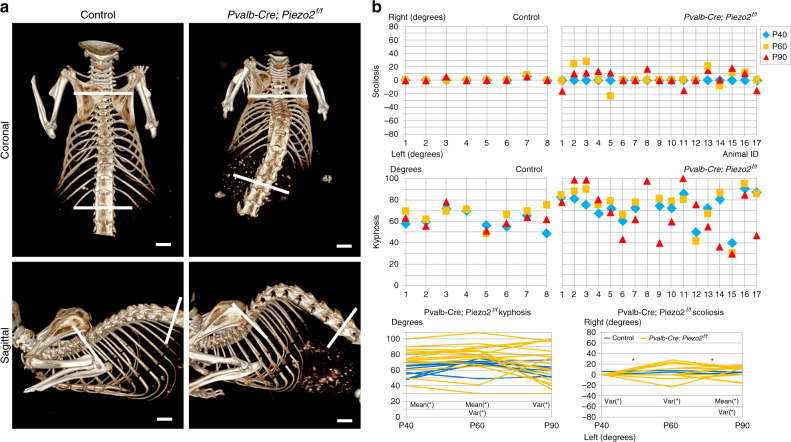
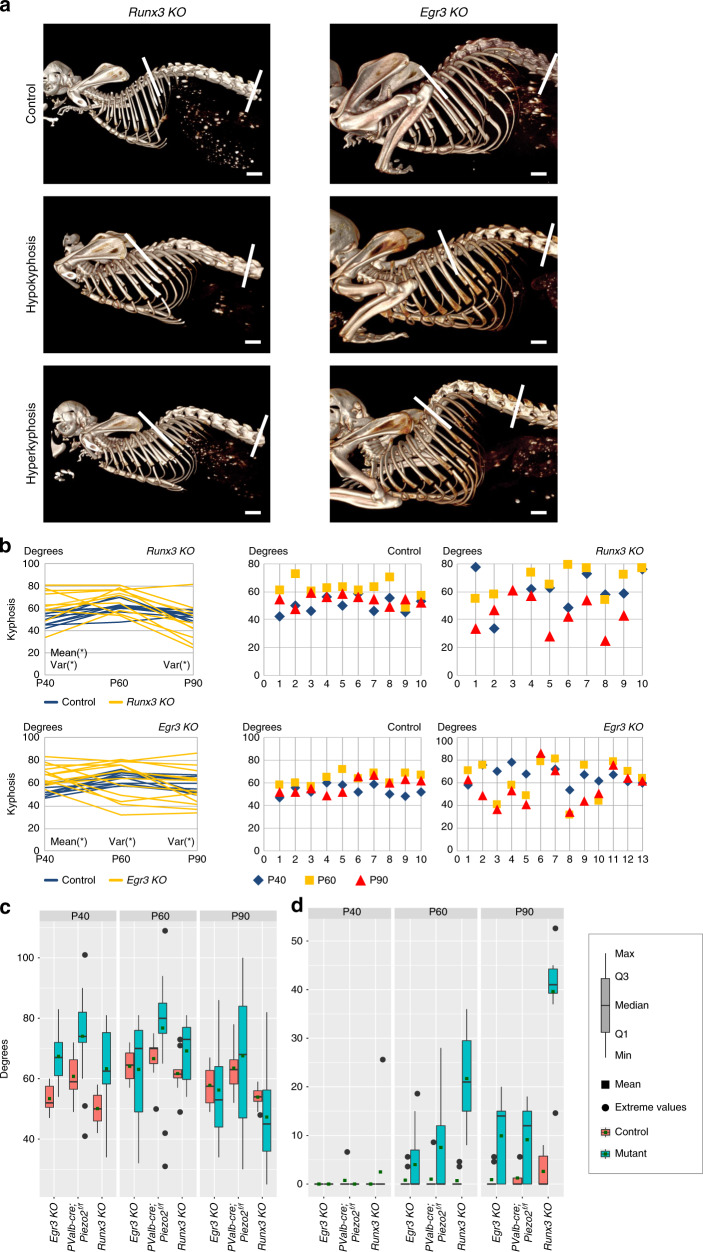
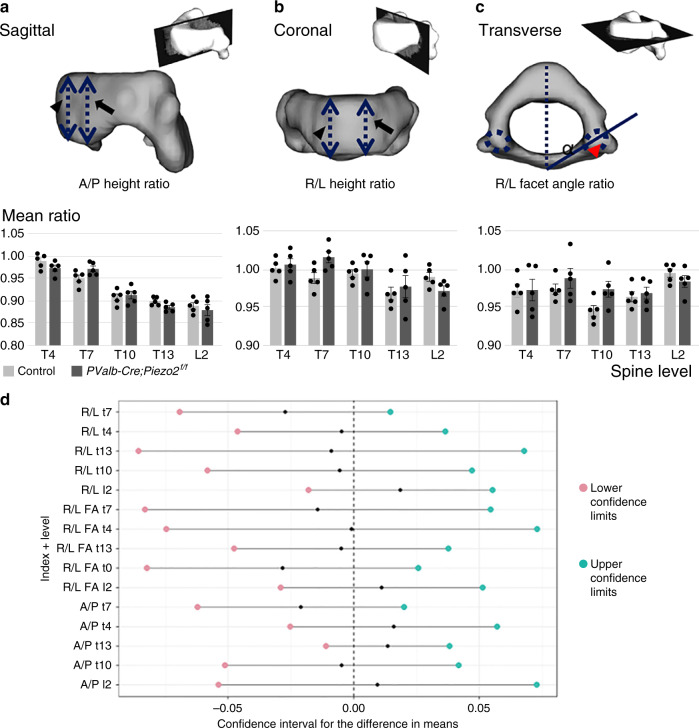
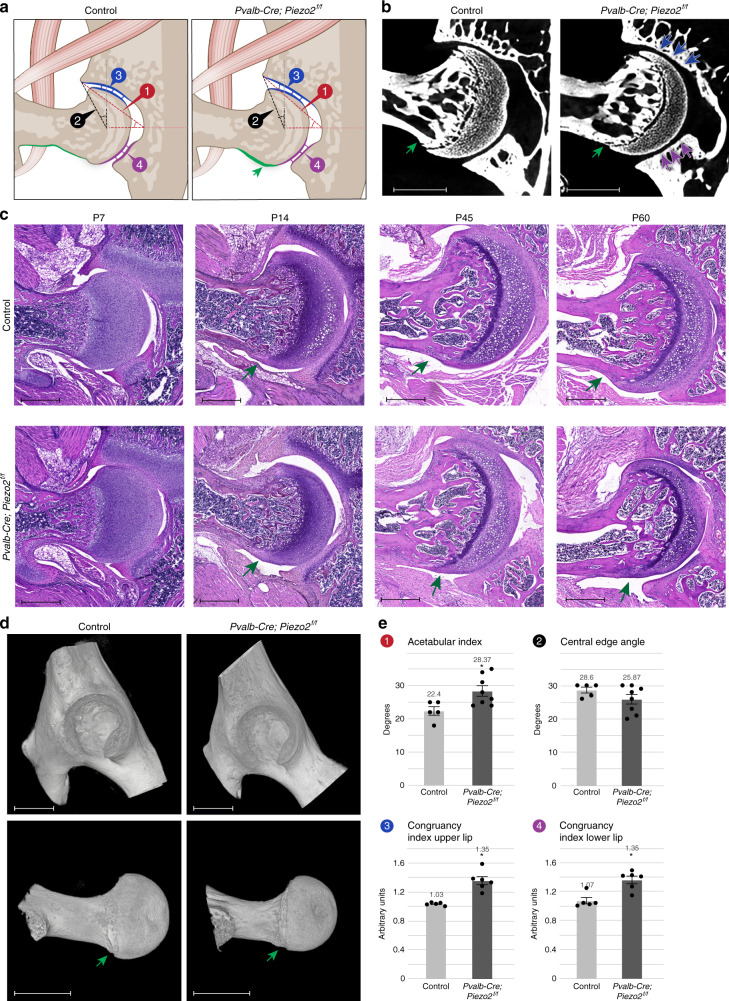
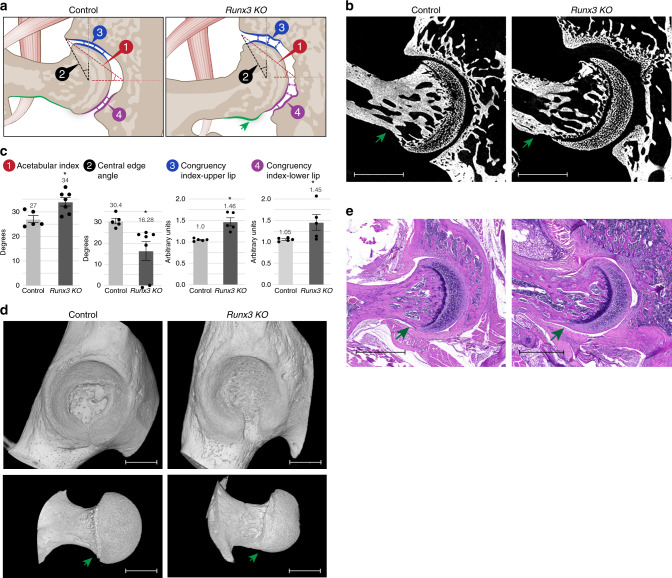
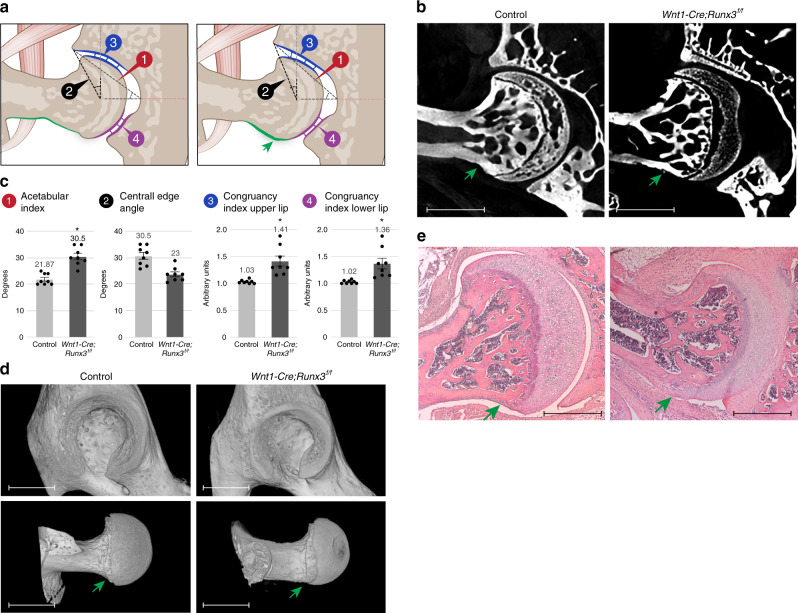
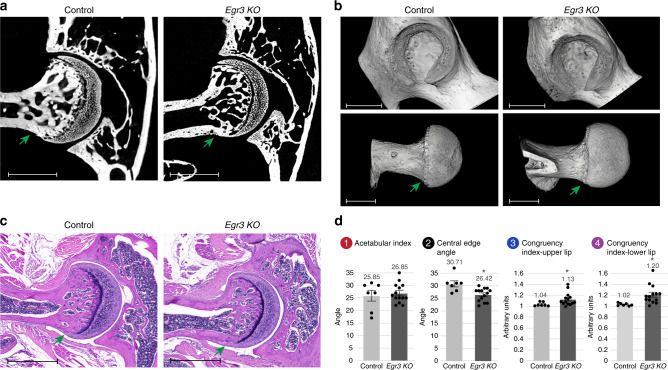
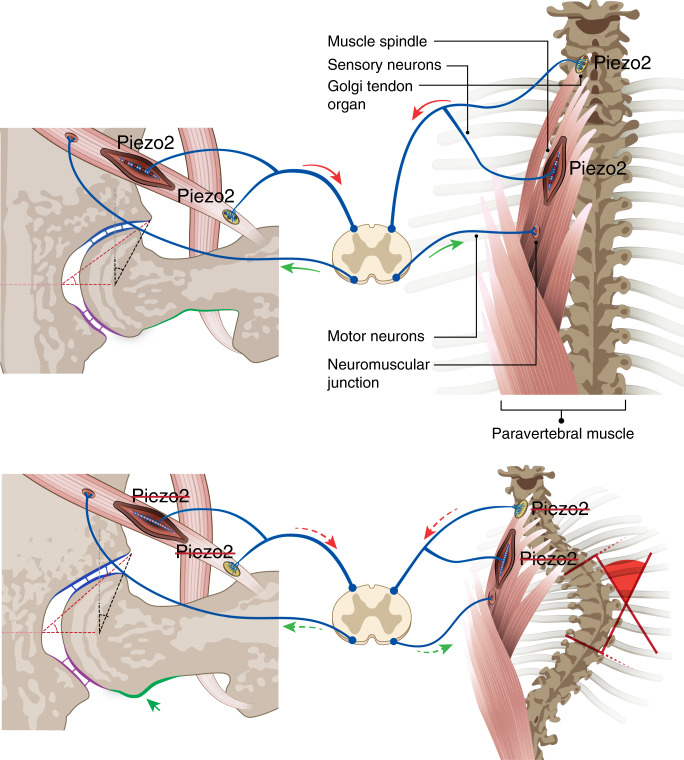
In humans, mutations in the PIEZO2 gene, which encodes for a mechanosensitive ion channel, were found to result in skeletal abnormalities including scoliosis and hip dysplasia. Here, we show in mice that loss of Piezo2 expression in the proprioceptive system recapitulates several human skeletal abnormalities. While loss of Piezo2 in chondrogenic or osteogenic lineages does not lead to human-like skeletal abnormalities, its loss in proprioceptive neurons leads to spine malalignment and hip dysplasia. To validate the non-autonomous role of proprioception in hip joint morphogenesis, we studied this process in mice mutant for proprioceptive system regulators Runx3 or Egr3. Loss of Runx3 in the peripheral nervous system, but not in skeletal lineages, leads to similar joint abnormalities, as does Egr3 loss of function. These findings expand the range of known regulatory roles of the proprioception system on the skeleton and provide a central component of the underlying molecular mechanism, namely Piezo2.


Conflict of interest statement

The authors declare no competing interests.

Figures

Fig. 1
Fig. 1. Loss of Piezo2 in mesenchyme-derived tissues did not result in morphological changes of the hip joint.
a Illustrations of the hip joint showing the indices used to evaluate hip dysplasia. The red lines (1) mark the acetabular index, the black lines (2) mark the central edge angle, the blue (3), and purple (4) lines mark the zones of measurements for the congruency index in the upper and lower lip of the hip joint, respectively. b Ex vivo CT-scanned hip joints of representative P60 control (left) and Prx1-Cre; Piezo2f/f (right) mice (n = 6 in both groups). c 3D reconstruction of ex vivo CT scans of representative P60 control (left) and Prx1-Cre; Piezo2f/f (right) mice showing no signs of dysplasia of the acetabulum (top) or the femoral head (bottom). Data are from three independent experiments. d Histological H&E-stained sections of hip joints of representative P60 control (left) and Prx1-Cre; Piezo2f/f (right) mice showing no remarkable differences in the morphology of the hip. Data are from three independent experiments. e Graphs showing the measured values of the indices illustrated in a for P60 control (n = 6) and Prx1-Cre; Piezo2f/f (n = 6) mice. No significant differences were found in any of the measurements, as determined by Welch’s two-sample t-test, ruling out the existence of hip dysplasia upon ablation of Piezo2 in mesenchymal cells. P-values: 1, 0.73; 2, 0.47; 3, 0.32; 4, 0.9. Bar and whiskers represent mean value and SEM, respectively. Source data are provided as a Source Data file. Scale bars: 380 µm in b, 850 µm in (c, top), 770 µm in (c, bottom) and 510 µm in d.
Fig. 2
Fig. 2. Loss of Piezo2 in osteogenic and chondrogenic tissue did not affect spine alignment.
a In vivo CT-scanned skeletal images of representative control and Col1a1-Cre; Piezo2f/f mice at P60 in coronal plane to evaluate scoliosis and sagittal plane to evaluate kyphosis. The two most tilted vertebrae on the caudal and rostral ends of the curve in both planes are indicated (white lines). The angle between the white lines parallel to the endplate of each of these vertebrae, termed the Cobb angle, was not affected by the osteogenic loss of Piezo2 in both planes, as determined by t- and F-tests. b Graphs showing Cobb angle values for all control (left) and Col1a1-Cre;Piezo2f/f mice (right, n = 13 in both groups) in the coronal (scoliosis) and sagittal (kyphosis) planes. The two line graphs at the bottom show the dynamics of Cobb angle for each measured mouse between P60 and P90. c, d Similarly, Cobb angles were not affected by the loss of Piezo2 in chondrogenic lineages, as determined by t- and F-tests. Scale bars: 2.1 mm in a, 2 mm in (c, top left), 2.4 mm in (c, top right), 2.2 mm in (c, bottom right and left). Source data are provided as a Source Data file.
Fig. 3
Fig. 3. Loss of Piezo2 in proprioceptive neurons results in spine malalignment.
a In vivo CT-scanned skeletal images of representative control and Pvalb-Cre; Piezo2f/f mice at P60, showing scoliosis (coronal plane) and kyphosis (sagittal plane) in the mutant compared to the control. b Graphs summarizing the Cobb angle values for all control (left, n = 8) and Pvalb-Cre; Piezo2f/f (n = 17) mice. Two graphs at the bottom show the dynamics of Cobb angle for each measured mouse between P40 and P90; significance of Mann–Whitney tests- or F-test is marked over the graphs by “mean(*)” or “var(*)”, respectively. P-value for Pvalb-Cre; Piezo2f/f kyphosis P40 mw-0.17 f-infinity, P60 mw-0.64 f-0.0006, P90 mw-0.02 f-0.0003), P-value for Pvalb-Cre; Piezo2f/f scoliosis P40 mw-0.008 f-0.10, P60 mw-0.01 f-0.03, P90 mw-0.72 f-0.01). Source data are provided as a Source Data file. Scale bars: 2 mm in (a, top left), 2.1 mm in (a, top right), 2.5 mm in (a, bottom right and left).
Fig. 4
Fig. 4. Comparative analysis of spine malalignment in Runx3 KO, Egr3 KO, and PValb-cre;Piezo2f/f mice.
a In vivo CT-scanned skeletal images of representative control, Runx3 KO and Egr3 KO mice at P60 showing kyphosis in the KO mice but not in the control. b Graphs showing Cobb angles for all Runx3 KO (top right, n = 10) and Egr3 KO mice (bottom right, n = 10) and their controls (left, n = 10 for each group). Two graphs on the left show the dynamics of Cobb angle for each measured mouse from P40 through P60 to P90. As in PValb-cre;Piezo2f/f mice, kyphosis was found to be progressive in most mutant animals between P40 and P60, with partial improvement at P90. Significance of t—or F-test is marked by “mean (*)” or “var (*)”, respectively. P-values for Runx3 KO: at P40, p = 0.02 (t-test) and p = 0.006 (F-test); at P60, p = 0.07 (t-test) and p = 0.19 (F-test); at P90, p = 0.26 (t-test) and p = 0.0001 (F-test). P-values for Egr3 KO: at P40, p = 0.00006 and p = 0.07; at P60, p = 0.83 and p = 0.001; at P90, p = 0.74 and p = 0.01 (t—and F-test, respectively). Source data are provided as a Source Data file. c, d Box plots showing measurements of kyphosis (c) and scoliosis (d) in PValb-Cre;Piezo2f/f (ncKO= 17; ncontrol = 8), Runx3 KO (nKO = 10; ncontrol = 10), and Egr3 KO mice (nKO = 13; ncontrol = 10), at P40, P60, and P90. Scale bars: 2.4 mm in (a, top left), 1.7 mm in (a, middle left), 2 mm in (a, bottom left), 2 mm in (a, right; estimated based on measurements of animals of the same background and age).
Fig. 5
Fig. 5. Vertebral shape is unaffected in PValb-Cre;Piezo2f/f mice.
Reconstructed CT-scanned images of vertebrae illustrate the measured features (a–c): The ratios between anterior (dashed line indicated by arrowhead) and posterior (dashed line indicated by arrow) heights (a, sagittal plane, A/P ratio), between right (arrowhead) and left (arrow) heights (b, coronal plane, R/L ratio) and between right (dashed circle indicated by arrowhead) and left (dashed circle) superior facet angles (c, transverse plane, R/L facet angle ratio). Graphs below show the morphometric similarity between PValb-Cre;Piezo2f/f (dark gray) and control (light gray) mice (n = 5 in each group). A/P anterior/posterior, R/L right/left. d Graph showing the 95% confidence intervals for differences in mean ratios. Red and green dots indicate upper and lower confidence limits, respectively, and black dots indicate the difference between control and mutant means ratio, which did not exceed the −0.1 to 0.1 range in all indices and at all levels. Data are presented as mean ± SEM; ncontrol = 5, ncKO = 5. Source data are provided as a Source Data file.
Fig. 6
Fig. 6. Loss of Piezo2 in proprioceptive neurons results in alternation of hip morphology.
a Illustrations of the hip joints of control (left, normal joint) and Pvalb-Cre; Piezo2f/f (right, flattened type hip dysplasia) mice. Green arrow indicates femoral cam. b Ex vivo CT scans of P60 control (left, n = 5) and Pvalb-Cre; Piezo2f/f mice (right, n = 8) hip joints. Flattening of the upper acetabular rim is seen in the mutant. Green arrows point at a femoral cam. c Histological sections at show first signs of femoral cam in a P14 Pvalb-Cre; Piezo2f/f mouse with progression up to P60. Data are from three independent experiments. d 3D reconstruction of ex vivo CT scans show femoral cam (green arrow) in a P60 Pvalb-Cre; Piezo2f/f mouse. Data are from three independent experiments. e Graphs showing increased acetabular index and congruency index (at both upper and lower lips) upon ablation of Piezo2 in proprioceptive neurons. Control, n = 5 for all measurements; Pvalb-Cre; Piezo2f/f, n = 8 for 1.2 and n = 5 for 3.4. Statistical significance as determined by Welch’s two-sample t-test: 1, p = 0.013, 2, p = 0.133; 3, p = 0.001; 4, p = 0.002; asterisks indicate significant differences. Bar and whiskers represent mean value and SEM. Source data are provided as a Source Data file. Scale bars: 330 µm in (b), 590 µm in (c), 825 µm in (d, top), and 770 µm in (d, bottom).
Fig. 7
Fig. 7. Total KO of Runx3 results in severe hip dysplasia.
a Illustrations of the hip joint of control (left) and Runx3 KO mice (right). The mutant exhibits irregular type hip dysplasia and femoral cam (green arrow). b Ex vivo CT scans of P60 control (left, n = 5) and Runx3 KO (right, n = 7) mice showing severe irregular type hip dysplasia in the mutant. The green arrow points at prominent femoral cam. c Graphs indicating increased acetabular index, decreased mean CEA and hip incongruence over both upper and lower sides of the joint in the KO mice. Statistical significance as determined by Welch’s two-sample t-test: 1, p = 0.01; 2, p = 0.01; 3, p = 0.01; 4, p = 0.09, p = 0.031 (Mann–Whitney tests, perfromed due to high variance of the sample), and p = 0.0005 (F-test); asterisks indicate significant differences. Bar and whiskers represent mean value and SEM. Source data are provided as a Source Data file. d 3D reconstruction of ex vivo CT scans at P60 show femoral cam (green arrow) and acetabular dysplasia in the Runx3 KO mice. Data are from three independent experiments. (e) Histological H&E-stained sections through P60 hip joints show femoral cam (green arrow) and acetabular dysplasia in the Runx3 KO mice. Data are from three independent experiments. Scale bars: 230 µm in (b), 815 µm in (d, top), 820 µm in (d, bottom), and 940 µm in e.
Fig. 8
Fig. 8. Loss of Runx3 in neural tissue results in hip dysplasia.
a Illustrations of the hip joint of control (left) and Wnt1-Cre;Runx3f/f mice (right). Runx3 cKO mouse exhibits flattened type hip dysplasia and femoral cam (green arrow). b Ex vivo CT scans of P60 control and Wnt1-Cre;Runx3f/f hip joints (n = 8 in both groups) show flattened upper acetabular rim and femoral cam in the mutant. c Graphs indicating increased acetabular index, decreased mean CEA and hip incongruence over both upper and lower sides of the joint in the cKO mice (n = 8 in both groups). Statistical significance as determined by Welch’s two-sample t-test: (1) p = 0.00006; (2) p = 0.0007; (3) p = 0.004; (4) p = 0.01; asterisks indicate significant differences. Bar and whiskers represent mean value and SEM. Source data are provided as a Source Data file. d 3D reconstruction of ex vivo CT scans at P60 show femoral cam (green arrow) and acetabular dysplasia in the cKO mice. Data are from three independent experiments. e Histological H&E-stained sections through P60 hip joints show femoral cam (green arrow) in the cKO mice. Data are from three independent experiments. Scale bars: 365 µm in b, 815 µm in d, and 230 µm in e.
Fig. 9
Fig. 9. Loss of muscle spindle alone results in hip dysplasia of reduced severity.
a Ex vivo CT scans of P60 control (left, n = 7) and Egr3 KO (right, n = 14) mice show flattening of upper acetabular rim and femoral cam (green arrow) in the mutant. b 3D reconstruction of ex vivo CT scans at P60 show femoral cam (green arrow) and acetabular dysplasia in the Egr3 KO mice. Data are from three independent experiments.(c) Histological H&E-stained sections through P60 hip joints show femoral cam (green arrow) in the Egr3 KO mice. Data are from three independent experiments. d Graphs indicating increased CEA, increased mean acetabular index and hip incongruence over both upper and lower sides of the joint in the Egr3 KO mice (ncontrol = 7; nKO = 14). Statistical significance as determined by Welch’s two-sample t-test: (1) p = 0.68; (2) p = 0.001; (3) p = 0.014; (4) p = 0.002; asterisks indicate significant differences. Bar and whiskers represent mean value and SEM. Source data are provided as a Source Data file. Scale bars: 270 µm in (a), 825 µm in (b, top), 805 µm in (b, bottom), and 350 µm in c.
Fig. 10
Fig. 10. Loss of Piezo2 in proprioceptive neuron results in spine malalignment and hip dysplasia.
In the suggested model, Piezo2 is part of the mechanism whereby the proprioceptive system regulates the activity of skeletal muscles. In the presence of Piezo2 (top), these signals maintain proper spine alignment and hip joint morphogenesis. However, the loss of Piezo2 in proprioceptive neurons (bottom) disrupts this signaling, which results in spinal malalignment and aberrant hip joint morphology.

References

    1. Mammoto T, Ingber DE. Mechanical control of tissue and organ development. Development. 2010;137:1407–1420. - PMC - PubMed
    1. Felsenthal N, Zelzer E. Mechanical regulation of musculoskeletal system development. Development. 2017;144:4271–4283. - PMC - PubMed
    1. Saotome K, et al. Structure of the mechanically activated ion channel Piezo1. Nature. 2017;554:481. - PMC - PubMed
    1. Zhao Q, et al. Structure and mechanogating mechanism of the Piezo1 channel. Nature. 2018;554:487–492. - PubMed
    1. Murthy SE, Dubin AE, Patapoutian A. Piezos thrive under pressure: Mechanically activated ion channels in health and disease. Nat. Rev. Mol. Cell Biol. 2017;18:771–783. - PubMed

Publication types

MeSH terms