. 2020 Jun 23;10(1):10149.
doi: 10.1038/s41598-020-66797-x.

Genome-wide DNA methylation analysis of KRAS mutant cell lines

Affiliations

Genome-wide DNA methylation analysis of KRAS mutant cell lines

Ben Yi Tew et al. Sci Rep. .

Abstract

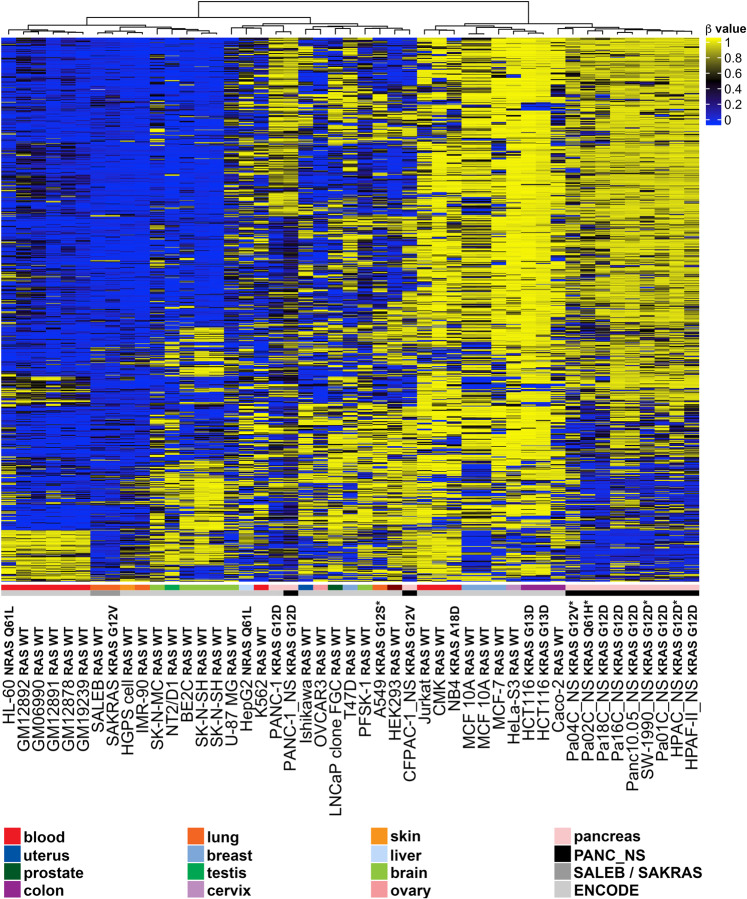
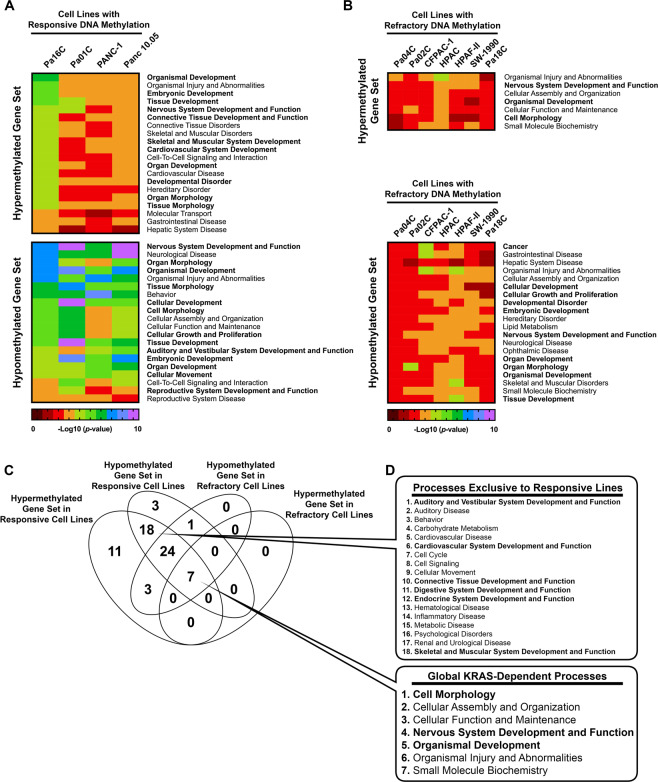
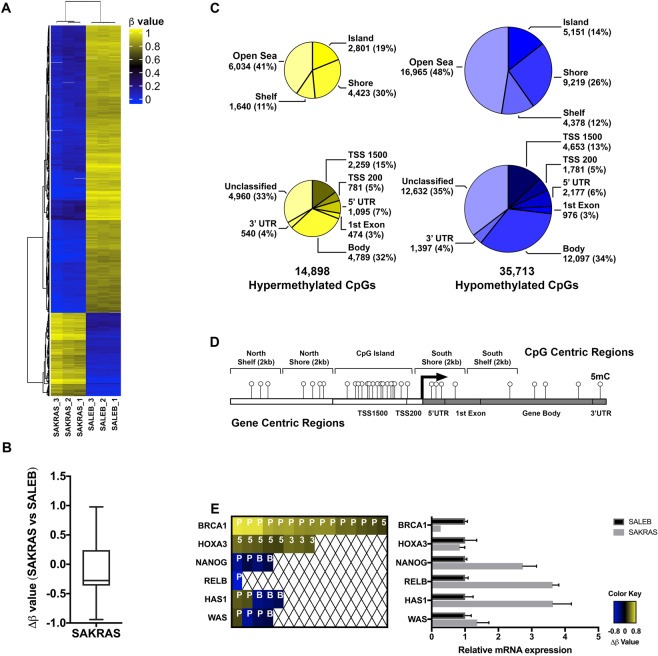
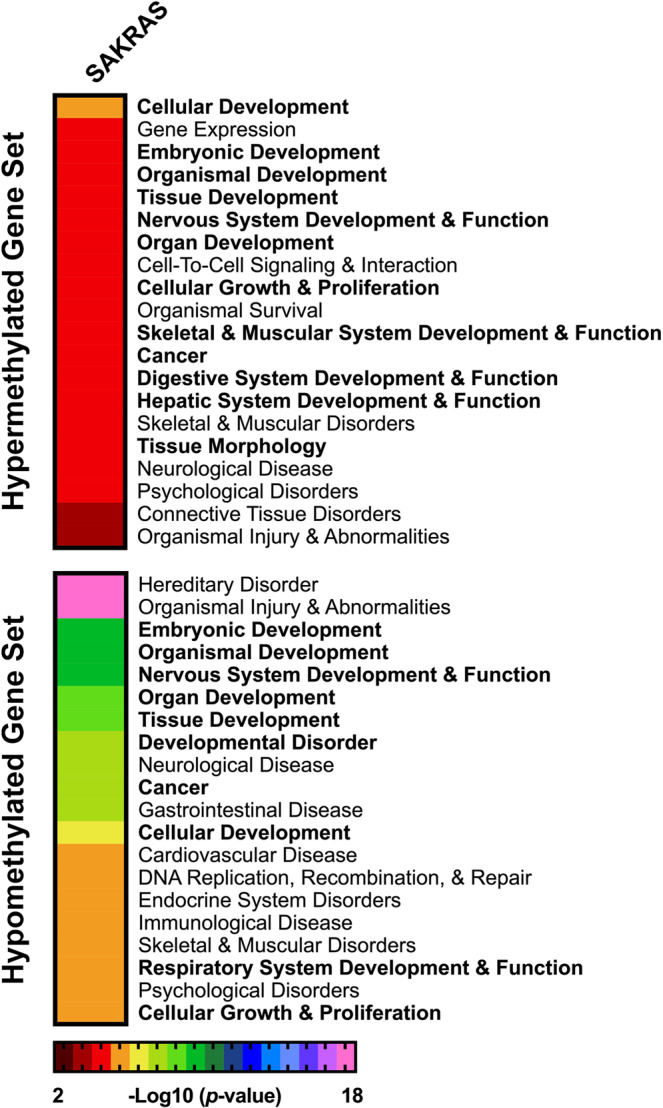
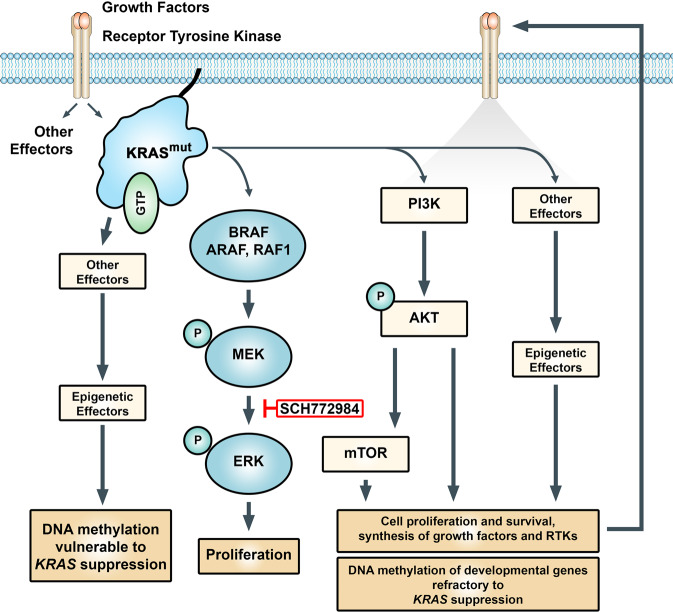
Oncogenic RAS mutations are associated with DNA methylation changes that alter gene expression to drive cancer. Recent studies suggest that DNA methylation changes may be stochastic in nature, while other groups propose distinct signaling pathways responsible for aberrant methylation. Better understanding of DNA methylation events associated with oncogenic KRAS expression could enhance therapeutic approaches. Here we analyzed the basal CpG methylation of 11 KRAS-mutant and dependent pancreatic cancer cell lines and observed strikingly similar methylation patterns. KRAS knockdown resulted in unique methylation changes with limited overlap between each cell line. In KRAS-mutant Pa16C pancreatic cancer cells, while KRAS knockdown resulted in over 8,000 differentially methylated (DM) CpGs, treatment with the ERK1/2-selective inhibitor SCH772984 showed less than 40 DM CpGs, suggesting that ERK is not a broadly active driver of KRAS-associated DNA methylation. KRAS G12V overexpression in an isogenic lung model reveals >50,600 DM CpGs compared to non-transformed controls. In lung and pancreatic cells, gene ontology analyses of DM promoters show an enrichment for genes involved in differentiation and development. Taken all together, KRAS-mediated DNA methylation are stochastic and independent of canonical downstream effector signaling. These epigenetically altered genes associated with KRAS expression could represent potential therapeutic targets in KRAS-driven cancer.


Conflict of interest statement

C.J.D. is on the Scientific Advisory Board of Mirati Therapeutics. C.J.D. received funding support from Mirati Therapeutics and Deciphera Pharmaceuticals. C.J.D. has been a consultant with Deciphera Pharmaceuticals, Eli Lilly, Jazz Therapeutics and Ribometrix.

Figures

Figure 1
Figure 1
CpG methylation in a panel of 47 cell lines with varying KRAS status. Unsupervised hierarchical clustering analysis using the top 1000 most variable CpG probes across a panel of 47 cell lines is displayed above. Eleven human pancreatic cancer cell lines were transduced with non-silencing (NS) shRNA (black bar above). DNA methylation patterns in these pancreatic cells were compared to the DNA methylation in lung epithelial SALEB/SAKRAS cells and Infinium methylation data obtained from ENCODE (www.encodeproject.org). The β value for each probe is represented with a color scale as shown in the key. Values closer to 1 represent highly methylated CpGs, while values closer to zero represent least methylated CpGs.
Figure 2
Figure 2
Effects of KRAS inhibition on DNA methylation. (A) KRAS mRNA levels from 10 pancreatic cancer cell lines transduced with KRAS shRNA compared to non-silencing (NS) controls as measured by RNA sequencing. RNA was not collected for SW-1990 cells due to insufficient material. (B) Unsupervised hierarchical clustering analysis was performed using the top 1000 most variable CpG probes across the panel of 11 pancreatic cell lines transduced with NS shRNA or KRAS shRNA. The β value for each probe is represented with a color scale as shown in the key. (C) Bar graph showing the number of differentially methylated (DM) CpGs with Δβ values ≥0.2 or ≤−0.2 in cell lines transduced with KRAS shRNA (hypermethylated CpGs represented in yellow and hypomethylated CpGs represented in blue).
Figure 3
Figure 3
Gene ontology analysis of differentially methylated (DM) promoters in KRAS- inhibited pancreatic cancer cells. (A,B) Gene Ontology analysis of DM genes in cells with (A) responsive or (B) refractory DNA methylation. Processes related to development and differentitation are in bold. (C) Venn diagram showing the number of biological processes associated with responsive or refractory promoter CpG methylation in KRAS-depleted cell lines. (D) (Top) List of affected biological processes exclusive to cell lines responsive to KRAS-depletion, or (Bottom) common among all of the KRAS-depleted cell lines.
Figure 4
Figure 4
DNA methylation changes associated with mutant KRAS overexpression in SALEB lung cells. (A) Hierarchical clustering of the top 1000 differentially methylated probes for SALEB and SAKRAS cell lines. (B) Box plot showing overall delta β vales (median of −0.27664) in the SAKRAS cells compared to SALEB cells. (C) Annotation of hypermethylated (left; yellow) and hypomethylated (right; blue) CpGs to CpG islands (top) and gene functional regions (bottom). (D) Diagram showing examples of CpG centric and gene functional centric regions analyzed by the Infinium DNA methylation array. (E) Genes of interest with DM CpGs in SAKRAS cells. Each colored block represents one DM CpG at the respective region of the stated gene. P, promoter region, 5, 5’UTR; B, Body, gene body; 3, 3′UTR (left panel); The mRNA expression of these genes was measured using qRT-PCR (right panel).
Figure 5
Figure 5
Gene ontology analysis of differentially methylated promoters associated with KRAS G12V overexpression in lung cancer cells. Gene ontology analysis of the hypermethylated (Top) and hypomethylated (Bottom) gene sets from the SAKRAS lung cell line are ranked using a negative log10 scale of the p-values. The top 20 biological processes are shown. Biological processes involved in cell development and differentiation shown in bold.
Figure 6
Figure 6
Model showing epigenetic regulation of developmental genes by mutant KRAS. Activating KRAS mutations lead to persistant induction of effector pathways that drive the cancer phenotype including the differential DNA methylation of genes involved in development and differentiation. In some cell lines, effector pathways such as PI3K and others, are able to maintain their abberant activity independent of KRAS signaling. As a consequence of feed forward loops initiated by mutant KRAS, kinome reprogramming, or the establishment of stable epigenetic patterns, the majority of DNA methylation changes associated with mutant KRAS activity remains refractory to KRAS suppression. However, independent of the changes in DNA methylation, KRAS knockdown and ERK inhibition still both lead to growth arrest in KRAS driven cell lines. SCH772984, type I and type II ERK inhibitor.

References

    1. Hobbs GA, Der CJ, Rossman KL. RAS isoforms and mutations in cancer at a glance. Journal of Cell Science. 2016;129:1287–1292. doi: 10.1242/jcs.182873. - DOI - PMC - PubMed
    1. Simanshu DK, Nissley DV, McCormick F. RAS Proteins and Their Regulators in Human Disease. Cell. 2017;170:17–33. doi: 10.1016/j.cell.2017.06.009. - DOI - PMC - PubMed
    1. Eser S, Schnieke A, Schneider G, Saur D. Oncogenic KRAS signalling in pancreatic cancer. British Journal of Cancer. 2014;111:817–822. doi: 10.1038/bjc.2014.215. - DOI - PMC - PubMed
    1. Ji H, et al. LKB1 modulates lung cancer differentiation and metastasis. Nature. 2007;448:807–810. doi: 10.1038/nature06030. - DOI - PubMed
    1. Kim J, et al. XPO1-dependent nuclear export is a druggable vulnerability in KRAS-mutant lung cancer. Nature. 2016;538:114–117. doi: 10.1038/nature19771. - DOI - PMC - PubMed

Publication types

MeSH terms

Substances