. 2020 Jun 10;6(24):eaay9691.
doi: 10.1126/sciadv.aay9691. eCollection 2020 Jun.

The clonal evolution of metastatic colorectal cancer

Affiliations

The clonal evolution of metastatic colorectal cancer

Ha X Dang et al. Sci Adv. .

Abstract

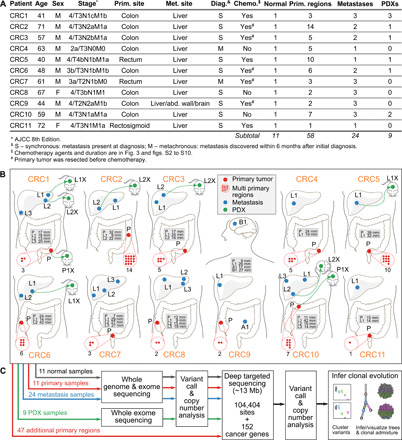
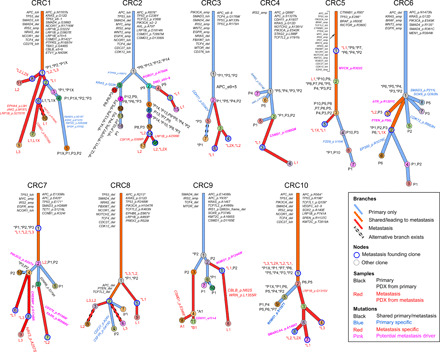
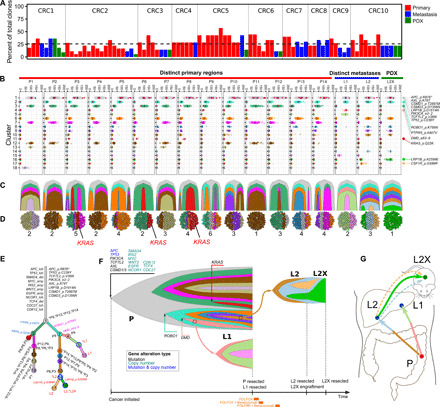
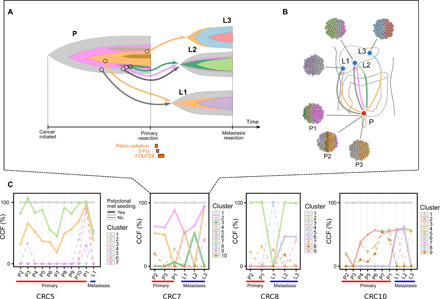
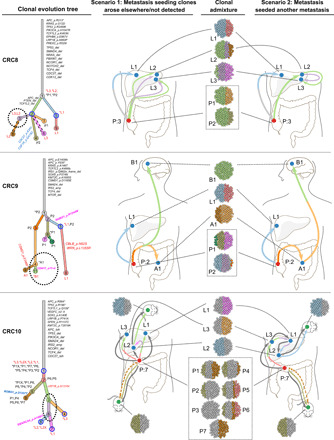
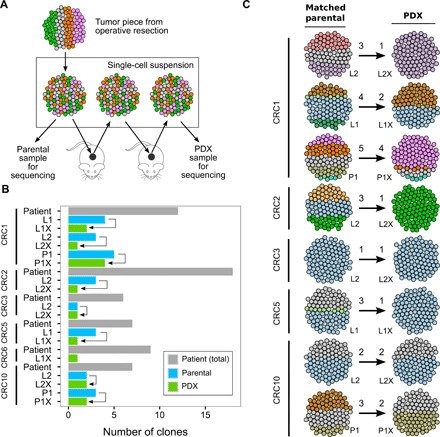
Tumor heterogeneity and evolution drive treatment resistance in metastatic colorectal cancer (mCRC). Patient-derived xenografts (PDXs) can model mCRC biology; however, their ability to accurately mimic human tumor heterogeneity is unclear. Current genomic studies in mCRC have limited scope and lack matched PDXs. Therefore, the landscape of tumor heterogeneity and its impact on the evolution of metastasis and PDXs remain undefined. We performed whole-genome, deep exome, and targeted validation sequencing of multiple primary regions, matched distant metastases, and PDXs from 11 patients with mCRC. We observed intricate clonal heterogeneity and evolution affecting metastasis dissemination and PDX clonal selection. Metastasis formation followed both monoclonal and polyclonal seeding models. In four cases, metastasis-seeding clones were not identified in any primary region, consistent with a metastasis-seeding-metastasis model. PDXs underrepresented the subclonal heterogeneity of parental tumors. These suggest that single sample tumor sequencing and current PDX models may be insufficient to guide precision medicine.


Figures

Fig. 1
Fig. 1. Overview of patient cohort, samples, and study design.
(A) Summary of the clinical data. (B) Locations of the primary tumors and distant metastasis sites for all 11 patients. Sample names are prefixed by a letter representing the site of tumor (P, primary; L, liver metastasis; A, abdominal wall metastasis; and B, brain metastasis). Tumor diameters are in the gray boxes. The number of red dots inside red dashed circles indicates the total primary regions for the corresponding primary tumors. Several primary and metastasis samples were implanted into immunodeficient mice yielding PDX tumors (named with suffix letter X with a green dotted arrow linked to the parental patient sample). (C) Sequencing and clonal evolution analysis.
Fig. 2
Fig. 2. Clonal evolution in mCRC: From primary to metastasis and patient-derived xenograft.
Each patient’s clonal history is presented by a tree whose nodes represent clones; branches represent evolution paths (length scaled by the square root of number of clonal marker mutations). Branches are labeled with potential driver mutations, and clone nodes are labeled with samples where the clones are found (with nonzero cellular fraction). A star (*) next to a sample indicates that the clone is the founding clone of the sample. Sample names are prefixed by a letter representing the site of tumor (P, primary; L, liver metastasis; A, abdominal wall metastasis; and B, brain metastasis). Suffix X indicates PDX. Clones marked as “alternative branch exists” were those predicted by ClonEvol to have an alternative position that does not change seeding model (see the Supplementary Figures of individual patients). Patient CRC11 was excluded from clonal evolution analysis because of low-quality primary sample.
Fig. 3
Fig. 3. CRC has substantial heterogeneity reflected in metastatic progression and establishment of PDXs.
(A) Percentage of total patient cancer clones detected in individual samples. (B to G) Clonal heterogeneity and evolution in patient CRC2. (B) Clustering of variants displaying purity-corrected cancer cellular fraction (CCF) across 14 primary regions, 2 metastases, and a PDX. Black bars, mean CCFs; red dots, nonsilent mutations in cancer genes (details on the far right). (C) Fishplot of clonal evolution and (D) clonal admixture of individual samples. (E) Clonal evolution tree with branch length scaled by the square root of the number of clonal marker variants. (F) Fishplot of the clonal evolution across all samples (time not to scale; sample acquisitions at the right end). Treatments are presented at the bottom. Primary tumor is presented as a combination of all primary regions. Arrows indicate metastasis seeding. Cancer genes, whose somatic alterations are clonal markers of a clone, are indicated with arrows pointing to the tips of the fishplot corresponding to the clone. (G) Anatomic representation of tumor location and metastatic progression. Arrows represent seeding clones between samples/sites. Dashed arrows represent clones regressed in PDX. Colors are matched throughout panels (B to G).
Fig. 4
Fig. 4. Hepatic metastases from CRC may arise from polyclonal seeding from the primary tumor.
(A) Time-based fishplot presentation of clonal evolution from the initiation of cancer (far left) through metastatic progression in patient CRC7. Cancer genes whose mutation is a clonal marker of a clone are indicated with arrows pointing to the tip of the corresponding clone’s fishplot. (B) Anatomic representation of tumor progression and metastatic progression, with the clonal subpopulation of each sample shown. These data support the initiation of metastases by two distinct clones from the primary P, in L1 and L2 of this patient. Radiation and chemotherapy do not alter the general scheme of seeding models (i.e., change from monoclonal to polyclonal model). (C) The median purity-corrected CCF of the variant clusters identified in patients CRC5, CRC7, CRC8, and CRC10. A polyclonal model is supported by the clusters whose CCF is present at subclonal levels in both primary and metastasis samples of these patients.
Fig. 5
Fig. 5. Metastasis-seeding-metastasis models in mCRC.
In patient CRC8 (top), clone 3 (purple, dotted circle) was found at subclonal frequency in metastases L2 and L3 but was absent in all primary regions. In patient CRC9 (middle), B1 founding clone 11 (green, dotted circle) arose from clone 4 (light orange, dotted circle) in A1, and both were absent in all primary regions. In patient CRC10 (bottom), clones 3 (light green, dotted circle) and 6 (purple, dotted circle) led to establishment of metastases L1 and L2, respectively, but were not involved in the evolution of any primary regions. These results suggest that many metastases developed not from the primary tumor but from other metastases.
Fig. 6
Fig. 6. Clonal architecture and evolution of PDXs in CRC.
(A) Experimental procedure for tumor harvesting and PDX development via single-cell suspension. All samples were derived from tumor tissue resected at the time of surgery. Engraftment procedures uniformly involve creation of single-cell suspension at each step of harvest and subsequent PDX development to maintain the clonal diversity of each sample. All PDX samples were collected after two passages when the PDXs were considered established. (B) Summary of the clones seen in each PDX compared with matched parental tumor sample and number of clones observed in patient. (C) Clonal selection from parental tumor to its matched PDX. Numbers above the arrows represent the number of clones present in each sample. These data demonstrate that most PDXs fail to accurately recapitulate the clonal architecture of their parental tumors.

References

    1. Fearon E. R., Vogelstein B., A genetic model for colorectal tumorigenesis. Cell 61, 759–767 (1990). - PubMed
    1. Cancer Genome Atlas Network , Comprehensive molecular characterization of human colon and rectal cancer. Nature 487, 330–337 (2012). - PMC - PubMed
    1. Brannon A. R., Vakiani E., Sylvester B. E., Scott S. N., McDermott G., Shah R. H., Kania K., Viale A., Oschwald D. M., Vacic V., Emde A.-K., Cercek A., Yaeger R., Kemeny N. E., Saltz L. B., Shia J., D’Angelica M. I., Weiser M. R., Solit D. B., Berger M. F., Comparative sequencing analysis reveals high genomic concordance between matched primary and metastatic colorectal cancer lesions. Genome Biol. 15, 454 (2014). - PMC - PubMed
    1. Naxerova K., Reiter J. G., Brachtel E., Lennerz J. K., van de Wetering M., Rowan A., Cai T., Clevers H., Swanton C., Nowak M. A., Elledge S. J., Jain R. K., Origins of lymphatic and distant metastases in human colorectal cancer. Science 357, 55–60 (2017). - PMC - PubMed
    1. Wei Q., Ye Z., Zhong X., Li L., Wang C., Myers R. E., Palazzo J. P., Fortuna D., Yan A., Waldman S. A., Chen X., Posey J. A., Basu-Mallick A., Jiang B. H., Hou L., Shu J., Sun Y., Xing J., Li B., Yang H., Multiregion whole-exome sequencing of matched primary and metastatic tumors revealed genomic heterogeneity and suggested polyclonal seeding in colorectal cancer metastasis. Ann. Oncol. 28, 2135–2141 (2017). - PMC - PubMed

Publication types

LinkOut - more resources