. 2020 Jun 10;6(24):eaba2724.
doi: 10.1126/sciadv.aba2724. eCollection 2020 Jun.

Direct and seasonal legacy effects of the 2018 heat wave and drought on European ecosystem productivity

Affiliations

Direct and seasonal legacy effects of the 2018 heat wave and drought on European ecosystem productivity

A Bastos et al. Sci Adv. .

Abstract

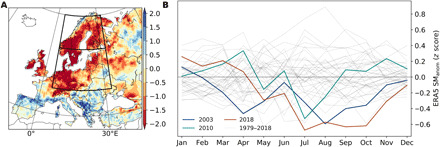
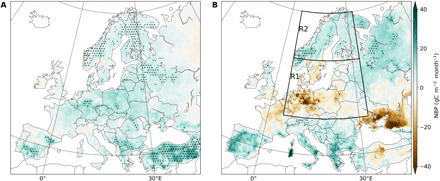
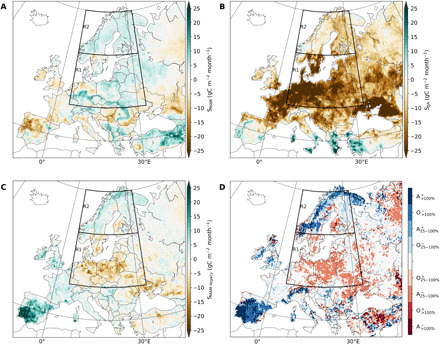
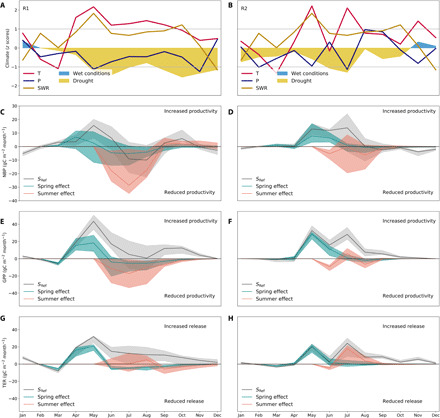
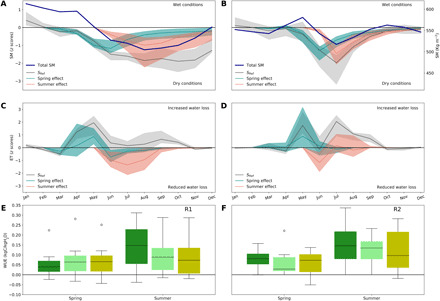
In summer 2018, central and northern Europe were stricken by extreme drought and heat (DH2018). The DH2018 differed from previous events in being preceded by extreme spring warming and brightening, but moderate rainfall deficits, yet registering the fastest transition between wet winter conditions and extreme summer drought. Using 11 vegetation models, we show that spring conditions promoted increased vegetation growth, which, in turn, contributed to fast soil moisture depletion, amplifying the summer drought. We find regional asymmetries in summer ecosystem carbon fluxes: increased (reduced) sink in the northern (southern) areas affected by drought. These asymmetries can be explained by distinct legacy effects of spring growth and of water-use efficiency dynamics mediated by vegetation composition, rather than by distinct ecosystem responses to summer heat/drought. The asymmetries in carbon and water exchanges during spring and summer 2018 suggest that future land-management strategies could influence patterns of summer heat waves and droughts under long-term warming.


Figures

Fig. 1
Fig. 1. Drought patterns in summer 2018.
(A) Spatial distribution of SM anomaly (SManom) from ERA5 fields (see Materials and Methods) in summer (JJA) and (B) distribution of seasonal SManom at continental scale for the study period 1979–2018 (gray lines) and the corresponding trajectories in 2003, 2010, and 2018. Continental Europe refers to the domain within 32°N and 75°N and −11°E and 65°E.
Fig. 2
Fig. 2. Anomalies of CO2 fluxes during spring and summer 2018.
Spatial patterns of NBP anomalies (reference period 1979–2018) during (A) spring (MAM) and (B) summer (JJA) 2018 estimated by the MMEM of 11 DGVMs. A positive (negative) value indicates higher (lower) net CO2 uptake than the 40-year average. The color map shows the multimodel ensemble mean anomalies, and the stippling indicates those regions with extremely low (rank 40th) or extremely high (rank 1st) values over the reference period.
Fig. 3
Fig. 3. Direct and legacy effects of spring and summer climate to DH2018 carbon balance.
Spatial distribution of the average net effect of (A) spring climate anomalies direct impact on spring NBP (from SMAM), (B) summer climate anomalies direct impact on summer NBP (from SJJA), (C) spring climate legacy effects in JJA (from SMAM), and (D) relative legacy impact of spring climate to summer NBP anomalies compared to the direct impact of summer climate to summer NBP anomalies. Red colors indicate regions where spring amplified (A) negative summer effects or offset (O) positive summer effects, i.e., spring contributed to a source anomaly by 25 to 100% or more than 100% of the corresponding direct summer effect. Blue colors indicate regions where spring legacy effects offset negative summer effects or amplified positive summer effects, i.e., spring legacy effects contributed to a positive summer NBP anomaly. The regions where spring legacy contributes by less than 25% of the summer-related NBP anomaly are masked in white. See the “Model simulations” section in Materials and Methods for a description of the idealized simulations used to isolate spring and summer direct and legacy effects.
Fig. 4
Fig. 4. Seasonal evolution of climate and net CO2 uptake during 2018 in the two study regions.
Spatially averaged standardized anomalies in monthly mean temperature (T, red lines), precipitation (P, blue lines), incoming solar shortwave radiation (SWR, yellow lines), and SPEI06 (shaded areas, blue for wetter-than-average conditions, yellow for drier-than-average conditions) for R1 (A) and R2 (B), respectively. The horizontal lines delimit the ±1 SD interval of the 1979–2018 period. In (C) and (D), the corresponding regional anomalies in NBP (back line and gray shades for MMEM and model interquartile range, respectively) estimated by the ensemble of 11 DGVMs for R1 and R2, respectively. Note the different y-axis range in (C) and (D). The blue (red) line indicates the individual effect of spring (summer) climate, and the interquartile range is shown by the shaded area. These effects are estimated by the factorial simulations with climatological spring (summer), i.e., SMAM (SJJA), as described in Materials and Methods. As in (C) and (D), (E) and (F) show the corresponding 2018 GPP anomalies, and (G) and (H) show the TER anomalies in 2018 for both regions. The annual totals of flux anomalies, as well as the contribution of spring and summer climate anomalies to the annual balance, are given in Table 1.
Fig. 5
Fig. 5. Seasonal evolution of hydrological variables during 2018 in the two study regions.
Standardized anomalies in total SM from the MMEM of the reference simulation (black line) and its uncertainty (shaded gray area) in R1 (A) and R2 (B). The blue (red) line indicates the individual effect of spring (summer) climate, and the interquartile range is shown by the shaded area. Absolute regional average SM values (in kg m−2) are given by the blue lines. The corresponding anomalies in ET are shown in (C) and (D) for R1 and R2, respectively. The distribution of the anomalies in WUE (defined as GPP/ET) estimated by the DGVM ensemble for forests (dark green), grasslands (light green), and croplands (yellow) in R1 (E) and R2 (F) during spring and summer 2018. WUE per land-cover type was calculated by weighting pixel-scale WUE by the corresponding pixel land-cover fraction of forests, grasslands, and croplands. It should be noted that these values will still include mixed signals from the three vegetation classes, especially in R1 where land-cover composition per pixel is more mixed.

References

    1. Barriopedro D., Fischer E. M., Luterbacher J., Trigo R. M., García-Herrera R., The hot summer of 2010: Redrawing the temperature record map of Europe. Science 332, 220–224 (2011). - PubMed
    1. Ciais P., Reichstein M., Viovy N., Granier A., Ogée J., Allard V., Aubinet M., Buchmann N., Bernhofer C., Carrara A., Chevallier F., De Noblet N., Friend A. D., Friedlingstein P., Grünwald T., Heinesch B., Keronen P., Knohl A., Krinner G., Loustau D., Manca G., Matteucci G., Miglietta F., Ourcival J. M., Papale D., Pilegaard K., Rambal S., Seufert G., Soussana J. F., Sanz M. J., Schulze E. D., Vesala T., Valentini R., Europe-wide reduction in primary productivity caused by the heat and drought in 2003. Nature 437, 529–533 (2005). - PubMed
    1. Schewe J., Gosling S. N., Reyer C., Zhao F., Ciais P., Elliott J., Francois L., Huber V., Lotze H. K., Seneviratne S. I., van Vliet M. T. H., Vautard R., Wada Y., Breuer L., Büchner M., Carozza D. A., Chang J., Coll M., Deryng D., de Wit A., Eddy T. D., Folberth C., Frieler K., Friend A. D., Gerten D., Gudmundsson L., Hanasaki N., Ito A., Khabarov N., Kim H., Lawrence P., Morfopoulos C., Müller C., Müller Schmied H., Orth R., Ostberg S., Pokhrel Y., Pugh T. A. M., Sakurai G., Satoh Y., Schmid E., Stacke T., Steenbeek J., Steinkamp J., Tang Q., Tian H., Tittensor D. P., Volkholz J., Wang X., Warszawski L., State-of-the-art global models underestimate impacts from climate extremes. Nat. Commun. 10, 1005 (2019). - PMC - PubMed
    1. Barriopedro D., Sousa P. M., Trigo R. M., García-Herrera R., Ramos A. M., The exceptional Iberian heatwave of summer 2018. B. Am. Meteorol. Soc. 101, S29–S34 (2020).
    1. V. D’Agostino, Drought in Europe Summer 2018: Crisis management in an orderly chaos; https://www.farm-europe.eu/blog-en/drought-in-europe-summer-2018-crisism... [cited 2019 October 14].

Publication types

LinkOut - more resources