[Preprint]. 2020 Sep 9:2020.06.08.20124792.
doi: 10.1101/2020.06.08.20124792.

Serological Assays Estimate Highly Variable SARS-CoV-2 Neutralizing Antibody Activity in Recovered COVID19 Patients

Affiliations

Serological Assays Estimate Highly Variable SARS-CoV-2 Neutralizing Antibody Activity in Recovered COVID19 Patients

Larry L Luchsinger et al. medRxiv. .

Update in

Abstract

The development of neutralizing antibodies (nAb) against SARS-CoV-2, following infection or vaccination, is likely to be critical for the development of sufficient population immunity to drive cessation of the COVID19 pandemic. A large number of serologic tests, platforms and methodologies are being employed to determine seroprevalence in populations to select convalescent plasmas for therapeutic trials, and to guide policies about reopening. However, tests have substantial variability in sensitivity and specificity, and their ability to quantitatively predict levels of nAb is unknown. We collected 370 unique donors enrolled in the New York Blood Center Convalescent Plasma Program between April and May of 2020. We measured levels of antibodies in convalescent plasma using commercially available SARS-CoV- 2 detection tests and in-house ELISA assays and correlated serological measurements with nAb activity measured using pseudotyped virus particles, which offer the most informative assessment of antiviral activity of patient sera against viral infection. Our data show that a large proportion of convalescent plasma samples have modest antibody levels and that commercially available tests have varying degrees of accuracy in predicting nAb activity. We found the Ortho Anti-SARS-CoV-2 Total Ig and IgG high throughput serological assays (HTSAs), as well as the Abbott SARS-CoV-2 IgG assay, quantify levels of antibodies that strongly correlate with nAb assays and are consistent with gold-standard ELISA assay results. These findings provide immediate clinical relevance to serology results that can be equated to nAb activity and could serve as a valuable 'roadmap' to guide the choice and interpretation of serological tests for SARS-CoV-2.


Conflict of interest statement

Conflicts of Interest The authors declare no conflicts of interest.

Figures

Figure 1:
Figure 1:. Demographics of convalescent plasma donors.
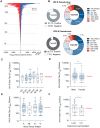
A;Distribution of convalescent plasma donor age (left, blue bars) compared to U.S. population (right, red bars). Dotted line represents Gaussian distribution curve fit. N=263; Pearson’s correlation coefficient. B; Distribution of convalescent plasma donor blood group antigen (left, blue bars) compared to U.S. population (right, red bars). N=370, binomial test for discrepancy versus U.S. population; * p < 0.05. C; Distribution of convalescent plasma donor sex (blue bars) compared to U.S. population (red bars). N=354, binomial test for discrepancy versus U.S. population. D; Distribution of convalescent plasma donor ethnicity (blue bars) compared to U.S. population (right, red bars). N=204, binomial test for discrepancy versus U.S. population; * p<0.05.
Figure 2:
Figure 2:. Neutralizing activity analysis of convalescent plasma donors.
A;Distribution of neutralization IC50 values (NT50, reciprocal plasma dilution) of convalescent donor plasma using HIV (red) or VSV pseudovirus (blue) overexpressing the SARS-CoV-2 spike protein (S). B; Frequency of convalescent plasma donor NT50 values within indicated groups using HIV-S (top) or VSV S pseudovirus constructs. C; Frequency distribution of convalescent plasma HIV-S NT50 values versus age groups. Signal to cutoff (S/co, dotted grey line) and 10x S/co (solid grey line) thresholds are indicated. n=5–38, Kruskal-Wallis test; * p < 0.05. D; Frequency of convalescent plasma donor NT50 values versus sex. Signal to cutoff (S/co, dotted grey line) and 10x S/co (solid grey line) thresholds are indicated. n=190, Mann-Whitney test, ** p < 0.01. E; Frequency of convalescent plasma donor NT50 values versus blood group antigen. Signal to cutoff (S/co, dotted grey line) and 10x S/co (solid grey line) thresholds are indicated. n=15–82, Kruskal-Wallis test, * p < 0.05. F; Frequency of convalescent plasma donor NT50 values versus time (days) since last reported symptom. Signal to cutoff (S/co, dotted grey line) and 10x S/co (solid grey line) thresholds are indicated. n=19–33, Mann-Whitney t-test, *p < 0.05.
Figure 3:
Figure 3:. Serological analysis of convalescent plasma donors.
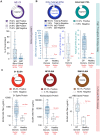
A; Frequency of densitometric IgG (left) or IgM (right) results from LFA bands relative to control band. Median values (red band) with 1st and 3rd quartiles (thin red lines) are shown. B; Frequency of HTSA results using the total Ig or IgG assays derived from the Ortho Diagnostics platform (left) or Abbott IgG assay platform (right). Results from fresh frozen plasma (FFP) units collected before COVID19 are shown as healthy controls. C; Frequency of S1 spike protein (left), Nucleocapsid (NP) protein (center) and RBD spike protein (right) ELISA titer results. Titers reflect concentrations calculated using a mAb standard curve and not absolute plasma concentrations. Median values (red band) with 1st and 3rd quartiles (thin red lines) are shown.
Figure 4:
Figure 4:. Correlation of serology assays versus neutralization activity of convalescent plasma donors.
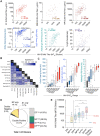
A; Linear regression of HIV-S NT50 values (abscissa) versus serological assay values (ordinate). N indicated in each graph, r2 = goodness of fit. B; Spearman correlation coefficients, r, of neutralization and serological assays. N=137 samples. C; Distribution of CP donor sample HTSA scores within indicated HIV-S NT50 groups using Ortho total Ig (left), Ortho IgG (center) or Abbott IgG (right) assays. D; Frequency of convalescent donor S1 and NP ELISA values defined in C. n=241 samples. E; Distribution of NT50 values corresponding to populations defined in C. n=4–51, Kruskall-Wallis test, * p < 0.05, ** p < 0.01.

References

    1. Wu F. et al., A new coronavirus associated with human respiratory disease in China. Nature 579, 265–269 (2020). - PMC - PubMed
    1. Zhou P. et al., A pneumonia outbreak associated with a new coronavirus of probable bat origin. Nature 579, 270–273 (2020). - PMC - PubMed
    1. Andersen K. G., Rambaut A., Lipkin W. I., Holmes E. C., Garry R. F., The proximal origin of SARS-CoV-2. Nat Med 26, 450–452 (2020). - PMC - PubMed
    1. Xie M., Chen Q., Insight into 2019 novel coronavirus - An updated interim review and lessons from SARS-CoV and MERS-CoV. Int J Infect Dis 94, 119–124 (2020). - PMC - PubMed
    1. Yao Q. et al., Retrospective study of risk factors for severe SARS-Cov-2 infections in hospitalized adult patients. Pol Arch Intern Med 10.20452/pamw.15312 (2020). - DOI - PubMed

Publication types