[Preprint]. 2020 Jun 7:2020.06.05.20123372.
doi: 10.1101/2020.06.05.20123372.

Containment of future waves of COVID-19: simulating the impact of different policies and testing capacities for contact tracing, testing, and isolation

Affiliations

Containment of future waves of COVID-19: simulating the impact of different policies and testing capacities for contact tracing, testing, and isolation

Vincenzo G Fiore et al. medRxiv. .

Update in

Abstract

We used multi-agent simulations to estimate the testing capacity required to find and isolate a number of infections sufficient to break the chain of transmission of SARS-CoV-2. Depending on the mitigation policies in place, a daily capacity between 0.7 to 3.6 tests per thousand was required to contain the disease. However, if contact tracing and testing efficacy dropped below 60% (e.g. due to false negatives or reduced tracing capability), the number of infections kept growing exponentially, irrespective of any testing capacity. Under these conditions, the population's geographical distribution and travel behaviour could inform sampling policies to aid a successful containment.

Keywords: COVID-19; Coronavirus; SARS-CoV-2; multi-agent simulations; pandemic; second wave.


Conflict of interest statement

Competing Interests statement The authors report no conflict of interest.

Figures

Figure 1.
Figure 1.. Disease prevalence, agents tested and capacity.
Error bands (mean and standard deviation) represent the prevalence of COVID-19 in the population over 60 days of simulated time (a, c, e), and the associated number of daily tested agents in relation with the respective testing capacities (solid and dotted lines respectively in b, d, f). The 3×5 design was used to simulate three conditions of simulated disease incidence, e.g. due to different mitigation strategies in place, which regulated the growth in the number of infections (a-b: 15%, c-d: 25% and e-f: 35%), and five conditions of contact tracing and testing efficacy (100%, 80%, 60%, 40% and 20%).
Figure 2.
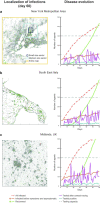
Figure 2.. Simulated evolution of the virus transmission over three regions.
Illustration of three different simulations for the scenario 1 (random seed 1) for the maps of New York metropolitan area (a), southeast Italy (b) and the Midlands in UK (c). All simulations display the (failed) containment of the disease transmission relying only on contact tracing, testing and isolation, under the conditions of medium incidence (25% daily increase in the number of infections), 20% contact tracing and testing efficacy and a distribution of travel cohorts of 40%, 30% and 30% for the short, medium and long travel range (respectively illustrated as black, blue and yellow squares in panel a).
Figure 3.
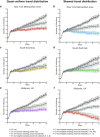
Figure 3.. Effects of test and isolation policies on the virus effective reproduction.
Mean number of infections per day, associated with different conditions and testing policies. Legends and error bars (standard errors) are depicted for the policies of contact tracing and testing (CT), alone (black triangles), contact tracing and testing jointly with random sampling across the entire map (grey circles) and the combination of contact tracing and testing jointly with the best performing sampling policies. Note that these optimal policies change depending on the simulated conditions of geographical distribution and travel behaviour of the population. Under all conditions, the optimal sampling policy to aid contact tracing focuses on small cells (equivalent to a small sector for the travel behaviour) centred on the coordinates of the most severe outbreak recorded in the previous day of simulated time. For two conditions, the optimal sampling is random within this cell (a, f). For the remaining conditions, the sampling is weighted: 60%−20%−20% (b), 10%−45%−45% (c), 20%−40%−40% (d), 80%−10%−10% (e), for short, medium and long distance travel cohort.
Figure 4.
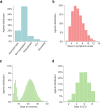
Figure 4.. Simulation settings.
The histograms represent the distribution of symptoms (a), days required for the symptoms onset (b), days required for recovery after symptoms onset (c) and days required in intensive care units (d). Note that the bimodal distribution of the days to recovery is due to the presence of asymptomatic subjects who are characterised by a shorter recovery time (marking the end of viral shedding). The days spent in the intensive care units are considered as part of the time required to recovery, when recovery is possible.

References

    1. World Health Organization - Coronavirus disease (COVID-19) Situation Report - 133. (2020).
    1. Kissler S. M., Tedijanto C., Goldstein E., Grad Y. H. & Lipsitch M. Projecting the transmission dynamics of SARS-CoV-2 through the postpandemic period. Science, doi:10.1126/science.abb5793 (2020). - DOI - PMC - PubMed
    1. Hellewell J. et al. Feasibility of controlling COVID-19 outbreaks by isolation of cases and contacts. The Lancet. Global health 8, e488–e496, doi:10.1016/S2214-109X(20)30074-7 (2020). - DOI - PMC - PubMed
    1. Swanson K. C. et al. Contact tracing performance during the Ebola epidemic in Liberia, 2014–2015. PLoS neglected tropical diseases 12, e0006762, doi:10.1371/journal.pntd.0006762 (2018). - DOI - PMC - PubMed
    1. Kang M. et al. Contact Tracing for Imported Case of Middle East Respiratory Syndrome, China, 2015. Emerging infectious diseases 22, 1644–1646, doi: 10.3201/eid2209.152116 (2016). - DOI - PMC - PubMed

Publication types