[Preprint]. 2020 Nov 5:2020.06.08.20125989.
doi: 10.1101/2020.06.08.20125989.

Longitudinal Surveillance for SARS-CoV-2 Among Staff in Six Colorado Long-Term Care Facilities: Epidemiologic, Virologic and Sequence Analysis

Affiliations

Longitudinal Surveillance for SARS-CoV-2 Among Staff in Six Colorado Long-Term Care Facilities: Epidemiologic, Virologic and Sequence Analysis

Emily N Gallichotte et al. medRxiv. .

Update in

Abstract

Background: SARS-CoV-2 emerged in 2019 and has become a major global pathogen. Its emergence is notable due to its impacts on individuals residing within long term care facilities (LTCFs) such as rehabilitation centers and nursing homes. LTCF residents tend to possess several risk factors for more severe SARS-CoV-2 outcomes, including advanced age and multiple comorbidities. Indeed, residents of LTCFs represent approximately 40% of SARS-CoV-2 deaths in the United States.

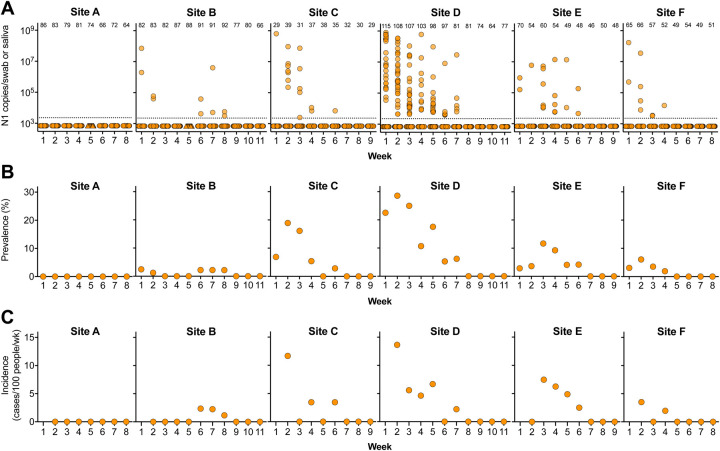
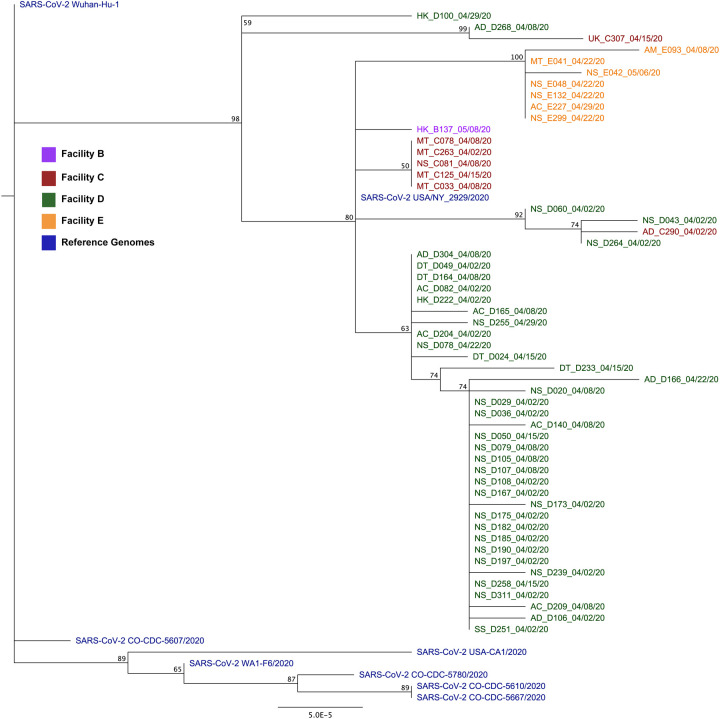
Methods: To assess the prevalence and incidence of SARS-CoV-2 among LTCF workers, determine the extent of asymptomatic SARS-CoV-2 infection, and provide information on the genomic epidemiology of the virus within these unique care settings, we collected nasopharyngeal swabs from workers for 8-11 weeks at six Colorado LTCFs, determined the presence and level of viral RNA and infectious virus within these samples, and sequenced 54 nearly complete genomes.

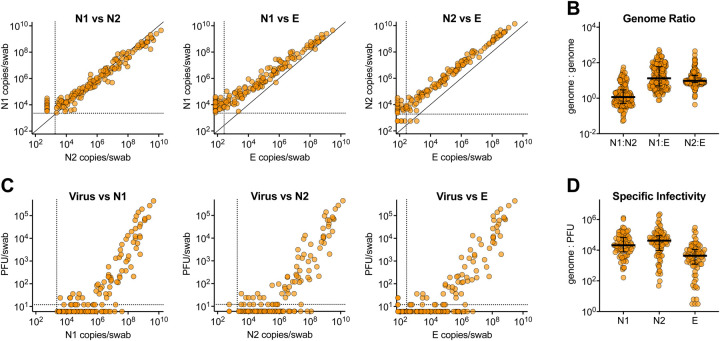
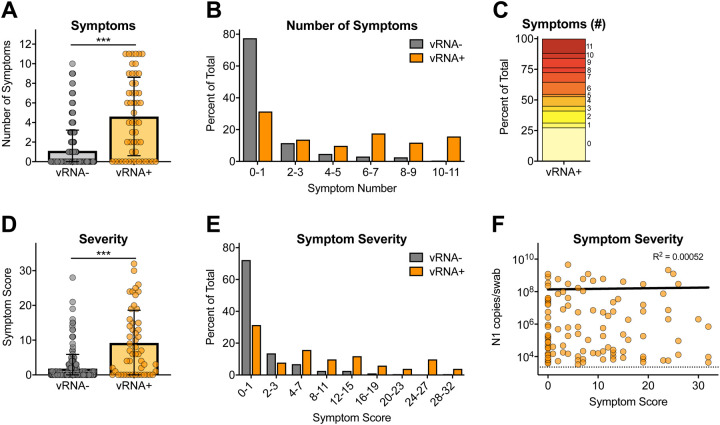
Findings: Our data reveal a strikingly high degree of asymptomatic/mildly symptomatic infection, a strong correlation between viral RNA and infectious virus, prolonged infections and persistent RNA in a subset of individuals, and declining incidence over time.

Interpretation: Our data suggest that asymptomatic SARS-CoV-2 infected individuals contribute to virus persistence and transmission within the workplace, due to high levels of virus. Genetic epidemiology revealed that SARS-CoV-2 likely spreads between staff within an LTCF.

Funding: Colorado State University Colleges of Health and Human Sciences, Veterinary Medicine and Biomedical Sciences, Natural Sciences, and Walter Scott, Jr. College of Engineering, the Columbine Health Systems Center for Healthy Aging, and the National Institute of Allergy and Infectious Diseases.


Figures

Figure 1.
Figure 1.. SARS-CoV-2 infection in six Colorado LTCFs.
A) SARS-CoV-2 N1 vRNA levels in nasopharyngeal swabs (circle) or saliva (triangle). Y-axis represents N1 copies/swab or saliva. Dotted line indicates limit of detection. Numbers across the top indicate number of samples tested each week. B) Prevalence of SARS-CoV-2 each week at each site (percent of samples with detectable N1 vRNA out of total number tested). C) Incident cases were defined as individuals who tested positive for N1 vRNA for the first time and had tested negative for infection one or two weeks prior. Not shown are prevalent infections among workers tested for the first time in week two.
Figure 2.
Figure 2.. Relationship between SARS-CoV-2 viral RNA and infectious virus.
Samples with detectable SARS-CoV-2 N1 vRNA were evaluated for N2 and E vRNA and infectious virus. A) Relationship between levels of N1, N2 and E vRNA transcripts. B) Genome:genome ratios between N1:N2, N1:E and N2:E (median with interquartile range). C) Relationship between levels of infectious virus and N1, N2, and E vRNA levels. D) Specific infectivity (genome:PFU ratio) of infectious virus relative to N1, N2 and E transcripts (median with interquartile range). Dashed lines represent limits of detection. PFU, plaque forming units.
Figure 3.
Figure 3.. SARS-CoV-2 symptom status, severity and relationship to viral RNA.
A) Number of symptoms reported by vRNA− and vRNA+ participants (mean ± SD). B) Percentage of vRNA− and vRNA+ individuals stratified by number of symptoms. C) Percentage of vRNA+ survey participants reporting total number of symptoms. D) Cumulative symptom score (not reported = 0, mild = 1, medium = 2, severe = 3) for all 11 symptoms stratified by vRNA− and vRNA+ participants (mean ± SD). E) Percentage of vRNA− and vRNA+ individuals stratified by symptom score. F) Relationship between cumulative symptom score and N1 vRNA levels (semilog nonlinear regression line fit). *** p<0.0001 Mann-Whitney unpaired non-parametric test.
Figure 4.
Figure 4.. Individual infection courses and virus levels.
Viral N1 RNA (left axis) and infectious virus (right axis) in select individuals with detectable N1 for A) one, B) two, C) three, or D) four consecutive weeks. E) Examples of individuals with detection of N1 vRNA after a period of undetectable N1 following initial infection. F) N1 vRNA and infectious virus by week of infection is plotted for individuals with incident infectious during the course of the study, with negative (N) tests immediately before and after positive (P) tests, stratified by the length of infection (one, two, three or four consecutive positive weeks) and those who experienced a post-negative positive test (following 1–3 negative weeks). Dashed line represents limit of detection, samples not detected plotted at half the limit of detection. PFU, plaque forming units.
Figure 5.
Figure 5.. Phylogenetic analysis of SARS-CoV-2 genomes collected from Colorado LTCFs.
A) PhyML tree constructed using Tamura-Nei distance model including both transitions and transversions in Geneious Prime. Node numbers indicate bootstrap confidence based on 1000 replicates. Distance matrix was computed, and the tree was visualized in Geneious Prime. Letters at the beginning of taxon names represent job code (AC-activities, AD-administrative, AM-admissions, DT-dietary, MT-maintenance, NS-nursing, SS-social services, UK-unknown), and A-E letter indicate site of origin. Numbers after underscore indicate the date of sample collection. Reference sequences and four Colorado-derived sequences were obtained from NCBI. B) Map of the LTCFs’ relative geographic locations and distances from one another.

References

    1. CDC. Preparing for COVID-19 in Nursing Homes. 2020; Available from: https://www.cdc.gov/coronavirus/2019-ncov/hcp/long-term-care.html.
    1. The Nursing Home COVID-19 Public File. 2020; Available from: https://data.cms.gov/stories/s/COVID-19-Nursing-Home-Data/bkwz-xpvg/.
    1. More Than 40% of U.S. Coronavirus Deaths Are Linked to Nursing Homes. 2020; Available from: https://www.nytimes.com/interactive/2020/us/coronavirus-nursing-homes.html.
    1. McMichael T.M., et al. , COVID-19 in a Long-Term Care Facility - King County, Washington, February 27-March 9, 2020. MMWR Morb Mortal Wkly Rep, 2020. 69(12): p. 339–342. - PMC - PubMed
    1. Gorges R.J., Sanghavi P., and Konetzka R.T., A National Examination Of Long-Term Care Setting, Outcomes, And Disparities Among Elderly Dual Eligibles. Health Aff (Millwood), 2019. 38(7): p. 1110–1118. - PMC - PubMed

Publication types