. 2020 Sep;140(3):317-339.
doi: 10.1007/s00401-020-02178-y. Epub 2020 Jun 23.

SFPQ and Tau: critical factors contributing to rapid progression of Alzheimer's disease

Affiliations

SFPQ and Tau: critical factors contributing to rapid progression of Alzheimer's disease

Neelam Younas et al. Acta Neuropathol. 2020 Sep.

Abstract

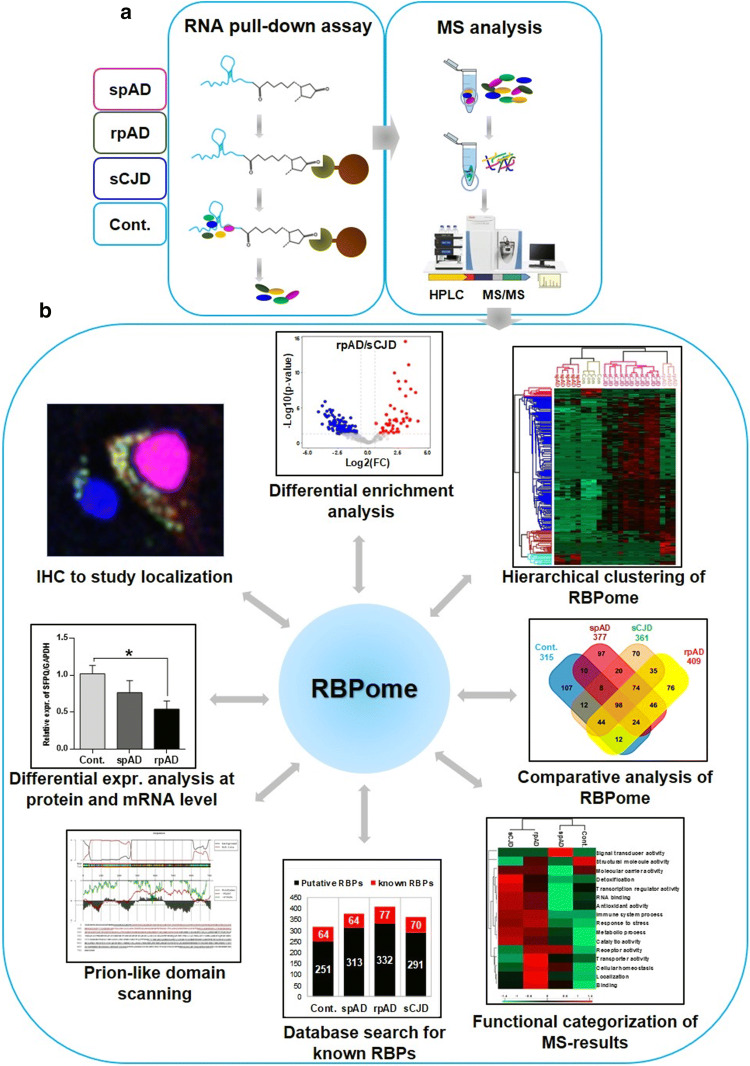
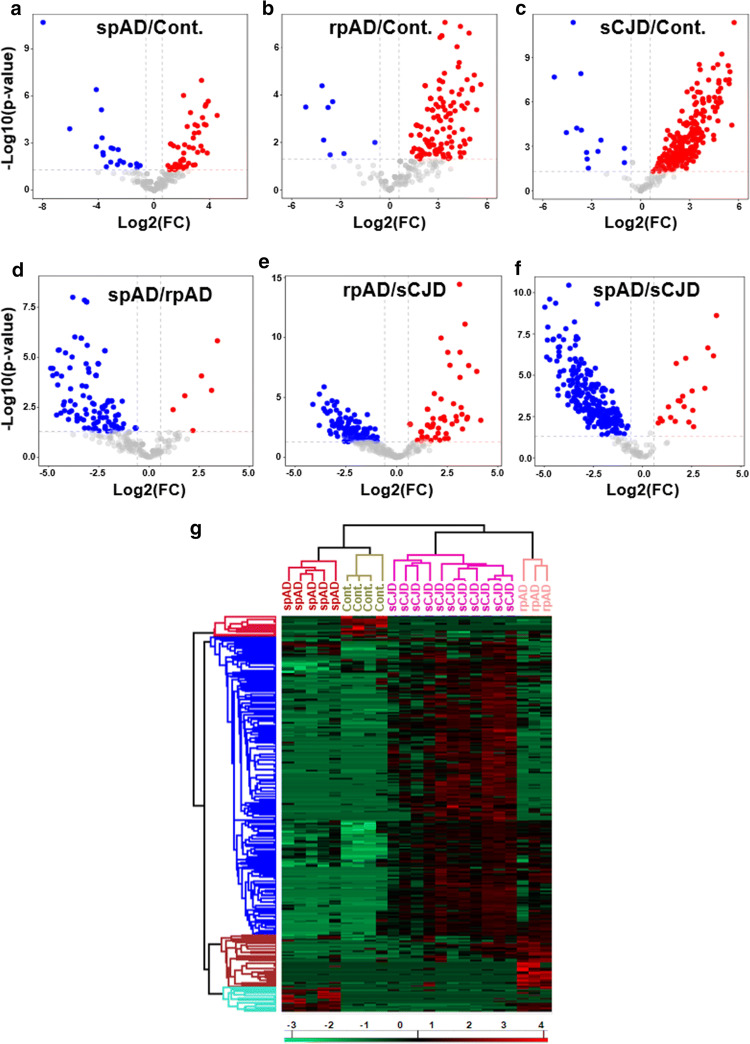
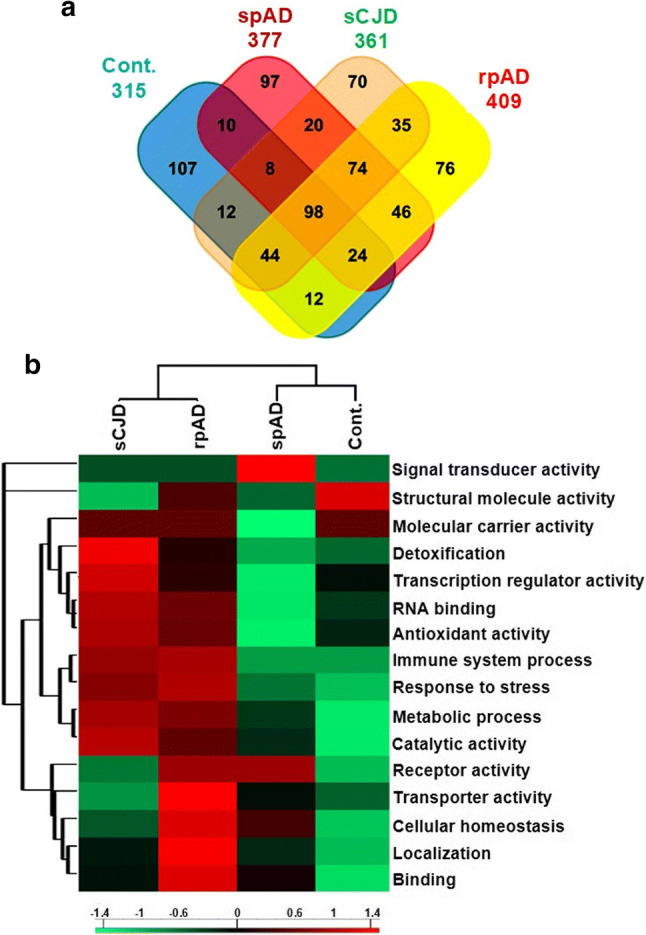
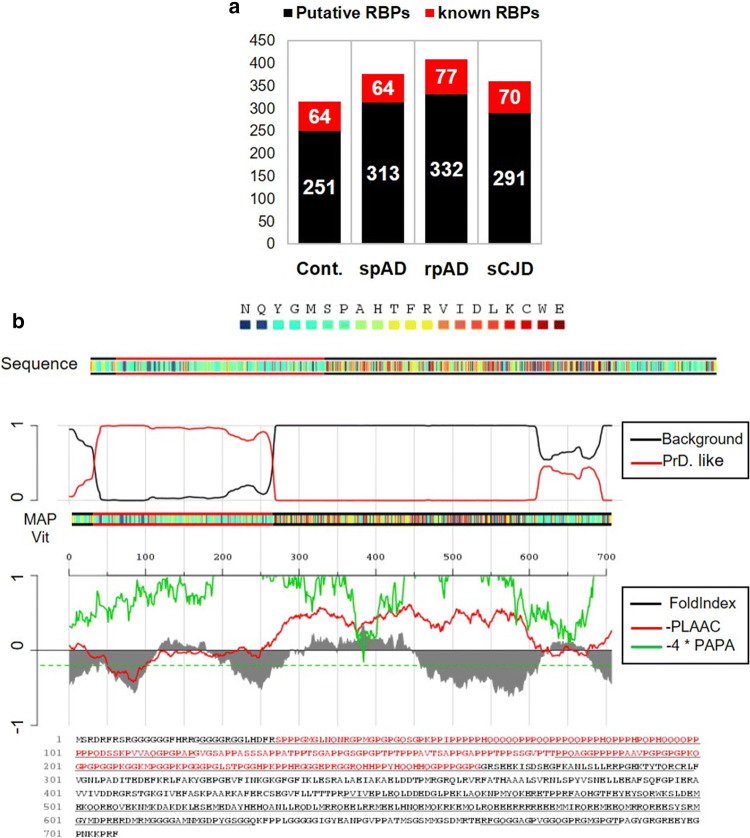
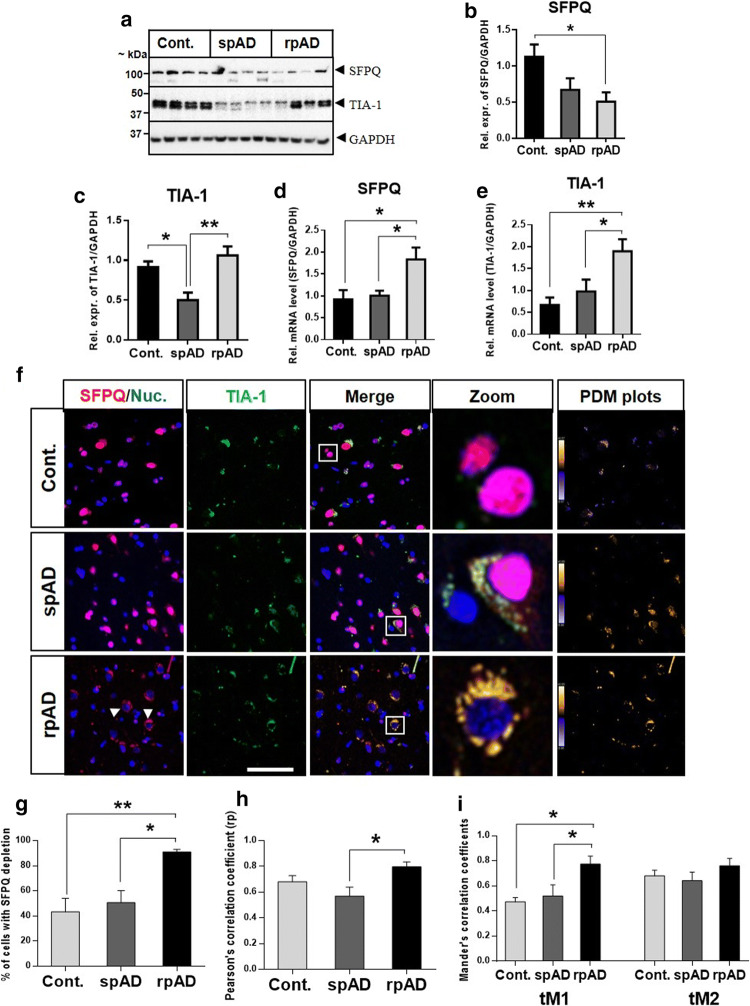
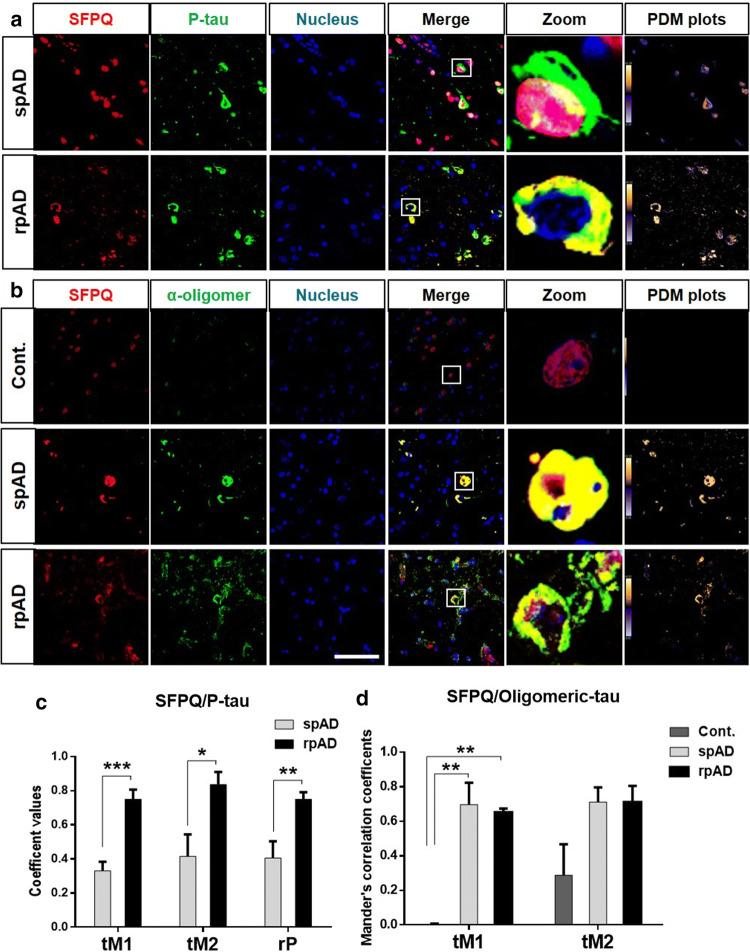
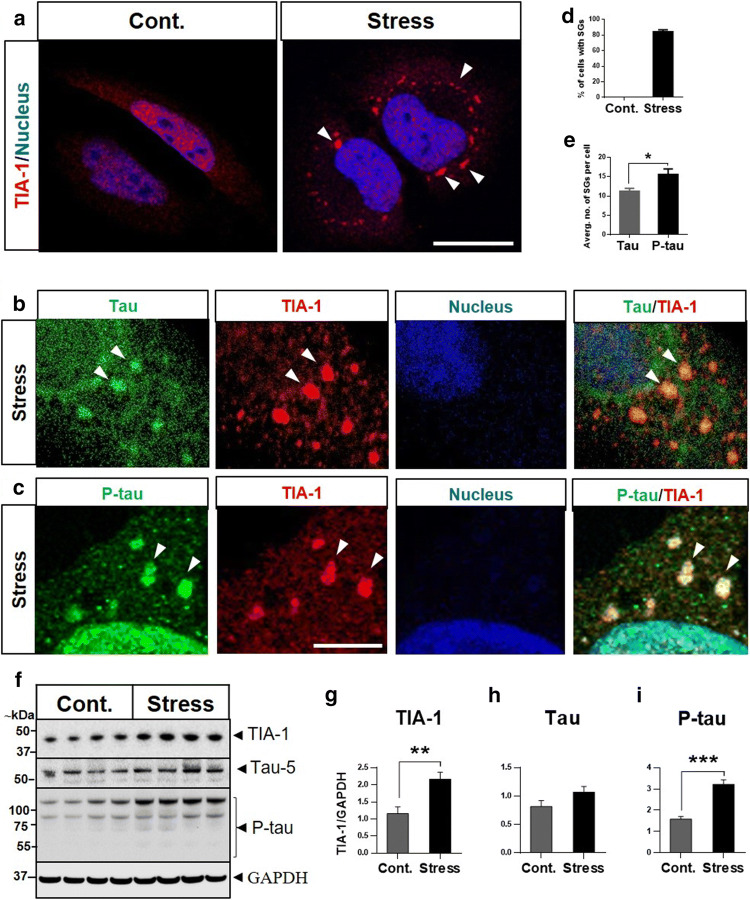
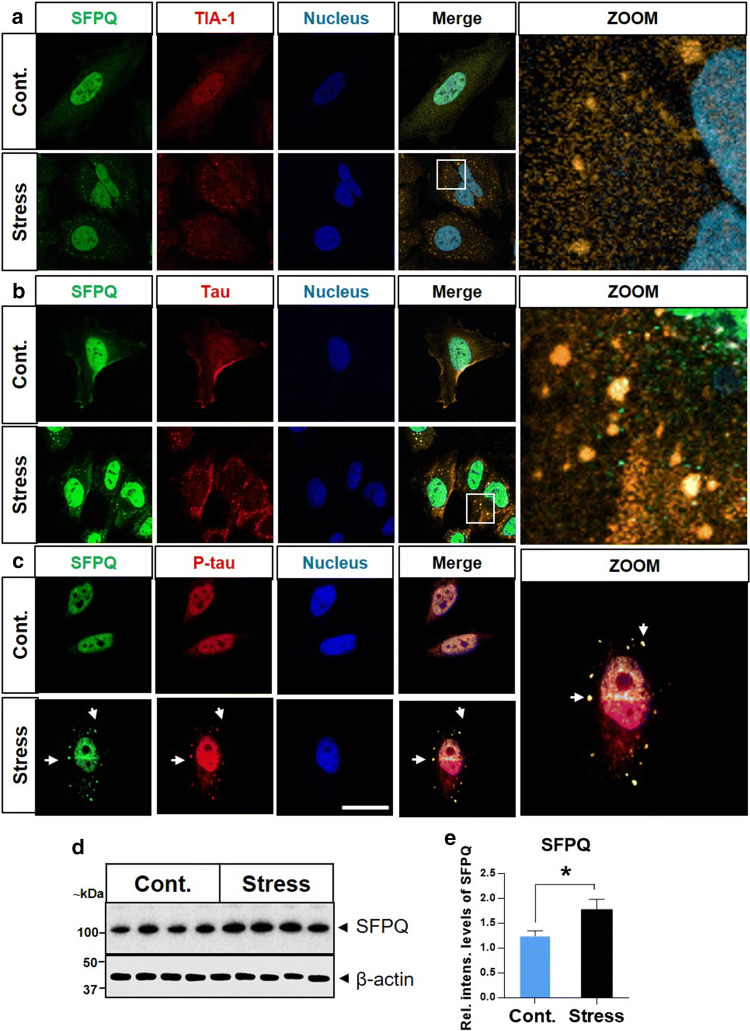
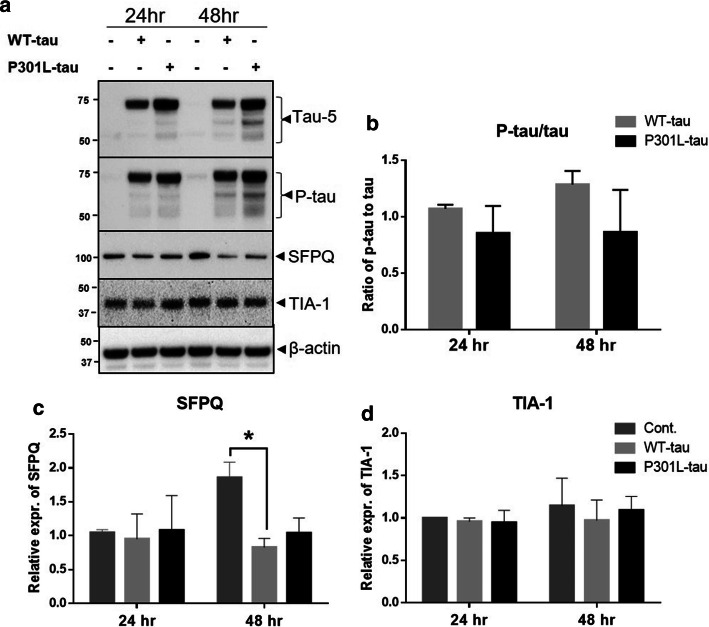
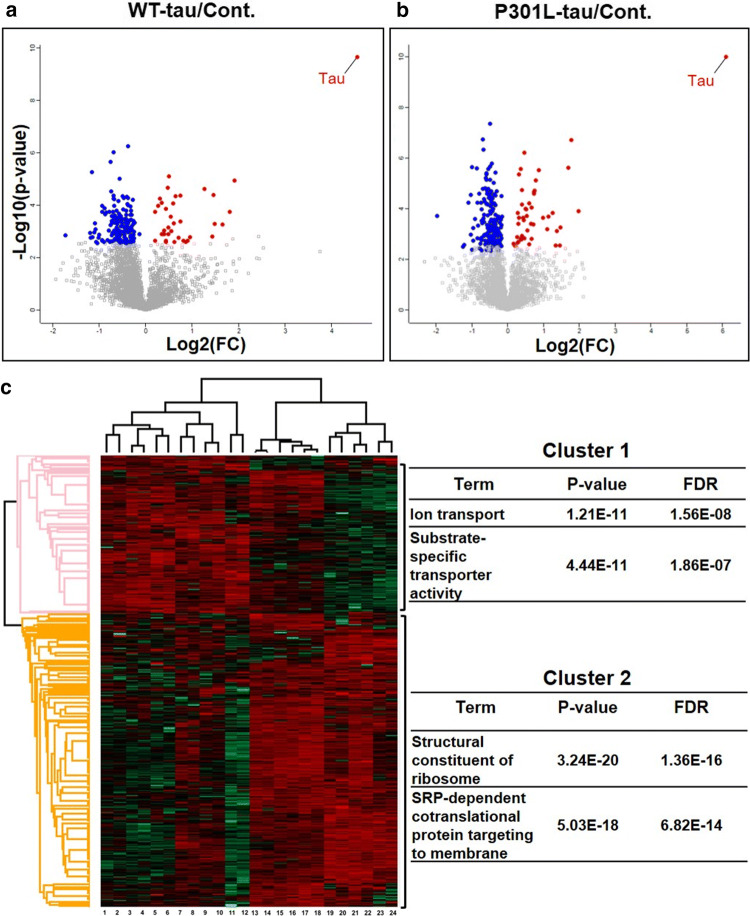
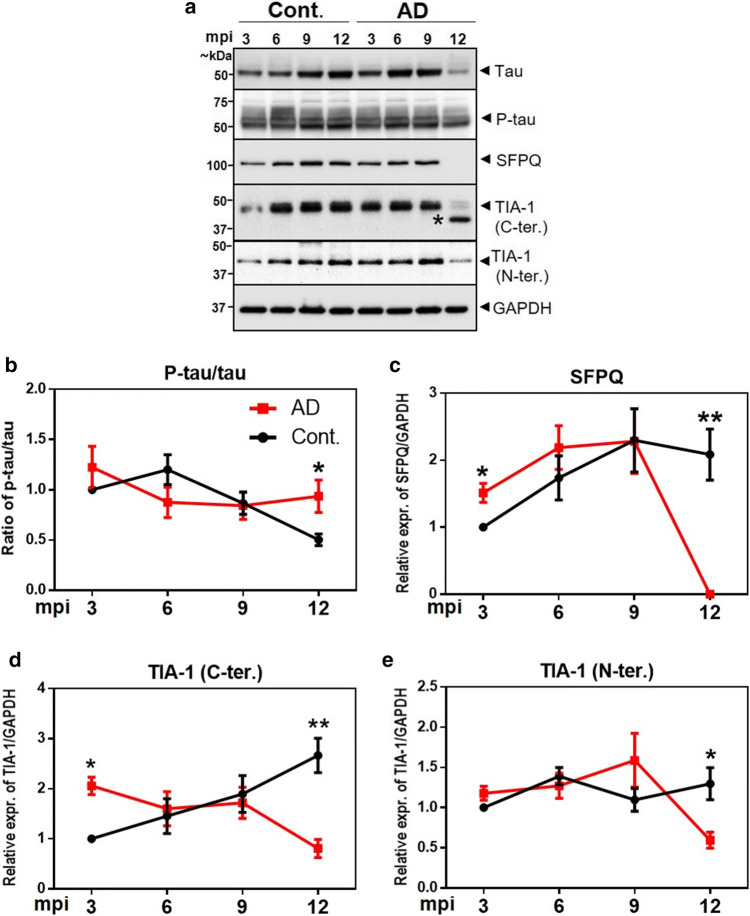
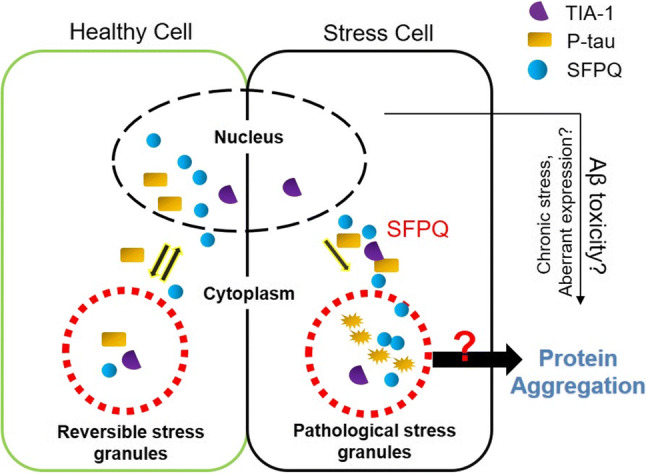
Dysfunctional RNA-binding proteins (RBPs) have been implicated in several neurodegenerative disorders. Recently, this paradigm of RBPs has been extended to pathophysiology of Alzheimer's disease (AD). Here, we identified disease subtype specific variations in the RNA-binding proteome (RBPome) of sporadic AD (spAD), rapidly progressive AD (rpAD), and sporadic Creutzfeldt Jakob disease (sCJD), as well as control cases using RNA pull-down assay in combination with proteomics. We show that one of these identified proteins, splicing factor proline and glutamine rich (SFPQ), is downregulated in the post-mortem brains of rapidly progressive AD patients, sCJD patients and 3xTg mice brain at terminal stage of the disease. In contrast, the expression of SFPQ was elevated at early stage of the disease in the 3xTg mice, and in vitro after oxidative stress stimuli. Strikingly, in rpAD patients' brains SFPQ showed a significant dislocation from the nucleus and cytoplasmic colocalization with TIA-1. Furthermore, in rpAD brain lesions, SFPQ and p-tau showed extranuclear colocalization. Of note, association between SFPQ and tau-oligomers in rpAD brains suggests a possible role of SFPQ in oligomerization and subsequent misfolding of tau protein. In line with the findings from the human brain, our in vitro study showed that SFPQ is recruited into TIA-1-positive stress granules (SGs) after oxidative stress induction, and colocalizes with tau/p-tau in these granules, providing a possible mechanism of SFPQ dislocation through pathological SGs. Furthermore, the expression of human tau in vitro induced significant downregulation of SFPQ, suggesting a causal role of tau in the downregulation of SFPQ. The findings from the current study indicate that the dysregulation and dislocation of SFPQ, the subsequent DNA-related anomalies and aberrant dynamics of SGs in association with pathological tau represents a critical pathway which contributes to rapid progression of AD.

Keywords: 3xTg mice; Dislocation; RNA-binding proteins; Rapidly progressive Alzheimer’s disease; SFPQ; Stress granules.


Conflict of interest statement

The authors declare that they have no conflict of interest.

Figures

Fig. 1
Fig. 1
Identification of RNA-binding proteins by RNA pull-down assay and mass spectrometry analysis. a Total RNA was isolated from the human brain frontal cortical region of 20 cases (spAD, rpAD, sCJD-MM1, sCJD-VV2 as well as controls). Bead-only control was used for non-specific binding. Isolated protein complexes were identified quantitatively using MS/MS analysis. In total, 1091 proteins were identified and quantified at a minimum peptide count of 2 and a protein threshold of 99%. b Target selection from proteomic investigation and their pathological characterization in the post-mortem human brains: a combination of bioinformatic and computational approaches was used to find out significant hits from the proteomic study, including differential enrichment analysis of MS data, hierarchical clustering analysis to visualize global proteome profile, comparative RBPome analysis, Gene Ontology (GO) functional enrichment analysis, database search for identification of bona-fide and novel/putative RBP candidates, and prion-like domain scanning with PLAAC database. Target candidates prioritized from proteomic study were pathologically characterized in the post-mortem human brain, using various techniques including immunoblotting, qRT-PCR and immunohistochemical analysis
Fig. 2
Fig. 2
Global enrichment profile of RBPome candidates isolated from the human brain frontal cortical region of 20 cases (spAD, rpAD, sCJD-MM1, sCJD-VV2 as well as controls). af Volcano plots of pairwise comparisons (t-tests with BH correction) showing, the -log10-p-values (y-axis) and the log2(FC) of the proteins that were significantly abundant (x-axis) in all the group combinations (spAD vs control, rpAD vs control, sCJD vs control, spAD vs rpAD, rpAD vs sCJD, and spAD vs sCJD). The data points above the dashed lines represent proteins having a p-value < 0.05 and FC >  ± 1.5 as significant hits and are depicted in red (for enriched) and blue (for depleted). g The heatmap (hierarchical clustering analysis) showing significantly-enriched proteins. The Log2-transformed expression values of proteins were normalized by Z-score for each biological replicate. Horizontal-axis indicates the differentially-enriched proteins, and the vertical axis shows the biological replicates from all the groups. Blue denotes depleted proteins, red represents enriched proteins
Fig. 3
Fig. 3
Comparative RNA-binding proteome profiling and functional categorization of MS results. RNA-binding proteome was isolated and identified from the human brain frontal cortical region of 20 cases (spAD, rpAD, sCJD-MM1, sCJD-VV2 as well as controls). a Venn diagram representing unique and shared RBP candidates in all groups. b Functional classification of MS results: RBP candidates identified in each group were analysed for associated Gene ontology functional-terms in two domains “biological process and molecular function’’. The protein counts associated with GO-terms from each group were uploaded to Perseus software, to prepare heatmap showing relative enrichment of different functional categories across all the groups. The variation in each term across the groups was calculated by Z-score. The columns of heatmap are representing disease groups (vertical-axis) and rows are displaying functional terms (x-axis), with red indicating an enriched category as compared with other groups, and green indicating depleted terms
Fig. 4
Fig. 4
Identification of canonical and putative RBP candidates. RNA-binding protein candidates were isolated and identified from the human brain frontal cortical region of 20 cases (spAD, rpAD, sCJD-MM1, sCJD-VV2 as well as controls). a The identified proteomic candidates were searched for RNA-binding annotation in the UniProtKB database. The bar graph is representing two categories. The category I (red) indicates canonical RBPs (known), and category II (black bar) represents potential novel/putative RBP candidates from each group. b Identification of SFPQ-prion-like domain by PLAAC database. The amino acid sequence of SFPQ is represented in colour coded boxes. The red line in the top panel represents the probability of a prion domain against the background. The plots in the middle panel show fold-index scores in grey [60], the log-likelihood (LLR) ratio scores in red [2], and the predicted prion propensity (PPP) in green [81]. Negative scores represent disorder and prion propensity, dashed green line is indicating the cutoff value of PPP > 0.05. The bottom panel is showing the primary sequence of SFPQ with PLD in red colour [2]
Fig. 5
Fig. 5
Differential expression analysis of SFPQ and TIA-1 at protein and mRNA level. a Representative immunoblot images. Immunoblotting analysis was performed with frontal cortical human brain tissues from spAD (n = 8), rpAD (n = 6), sCJD (-MM1 & -VV2 subtypes, n = 8) and non-demented controls (n = 8). b, c The densitometric analysis of SFPQ and TIA-1. d, e Expression of SFPQ and TIA-1 at mRNA level was analysed in spAD, rpAD, and controls with qRT-PCR (n = 5–8). GAPDH was used to normalize the expression levels of mRNA. The comparative Ct method (2^−ΔΔCt) was used for calculation of relative mRNA levels [45]. f Dislocation of SFPQ from the nucleus and colocalization with SG-marker-TIA-1. Co-immunofluorescence of SFPQ (red) and TIA-1 (green) in the human brain of spAD (n = 4), rpAD (n = 4), and controls (n = 5). Cell nuclei were visualized with To-Pro-3 iodide staining (blue). Representative images are shown (scale bar = 50 um). Intensity correlation analysis (PDM plots) was performed with ImageJ (WCIF Plugin). g Quantification of the cells showing SFPQ dislocation/depletion (n = 150/group). h Pearson’s correlation coefficient (rP) graph, showing significant colocalization between SFPQ and TIA-1 in rpAD cases in comparison to spAD cases. i Colocalization analysis with Threshold Mander’s correlation coefficients (tM1 & tM2). The value of tM1 represents the overlap of TIA-1 channel pixels with SFPQ channel pixels, and tM2 represents the overlap of SFPQ channel pixels with TIA-1 channel pixels. The colocalization analysis was performed with FIJI software (Coloc 2). One-way ANOVA and Tukey post-hoc test for multiple comparisons was used to calculate significance, *p < 0.05, **p < 0.01
Fig. 6
Fig. 6
SFPQ colocalize with p-tau tangles and oligomeric-tau in rpAD brains. a Representative images stained with SFPQ (red) and α- p-tau (S199) (green) antibodies (scale bar = 50 μm) in spAD (n = 3) and rpAD (n = 3). Sections were counter stained with To-Pro-3 iodide to visualize nuclei (blue). PDM plots were prepared by intensity correlation analysis (ICA) using Image-J (WCIF plug-in). b Co-immunofluorescence images from control (n = 3), spAD (n = 5) and rpAD (n = 3) cortical sections, stained with α-SFPQ (red) and α-Tau oligomeric antibody: T-22 (green). PDM plots showing colocalization. c Pearson’s correlation coefficient (rP) and threshold Mander’s correlation coefficients (tM1& tM2) representing significant colocalization between SFPQ and p-tau in the rpAD group, in comparison to spAD group. Statistical significance was calculated by t-test, *p < 0.05, **p < 0.01, ***p < 0.001. d Threshold Mander’s correlation coefficient’s (tM1, tM2) showing significant colocalization between SFPQ and oligomeric-tau in both spAD and rpAD, as compared with control. Graphs were prepared with GraphPad Prism (6.01) using One-way ANOVA and Tukey post-hoc test for multiple comparisons, **p < 0.01
Fig. 7
Fig. 7
Sodium arsenite induces SGs in HeLa cells. a SGs were visualized by staining classical marker of SGs: TIA-1 in untreated (control) and sodium arsenite-treated (0.6 mM; 60 min) (stress) cells. The cells were counter-stained with DAPI to visualize nuclei, scale bar = 10 μm. b, c Tau and p-tau are recruited into SGs. The cells were co-immuno-stained with primary antibodies specific for total-tau, p-tau and TIA-1. d The cells positive for SGs were calculated with FIJI software. More than 80% cells were identified positive for SGs after stress treatment. e Tau and p-tau-positive SGs per cell (average no. of SGs) were calculated using FIJI software. Significance was calculated by t-test, *p < 0.05. fi Stress induced increase in tau-phosphorylation and TIA-1 levels. Representative immunoblots for TIA-1, total-tau and p-tau in control (untreated) and stress (arsenite treated) cells. Statistical significance was calculated with t-tests **p < 0.01, ***p < 0.001
Fig. 8
Fig. 8
Recruitment of SFPQ into SGs after oxidative stress induction in HeLa cells. a Localization of SFPQ (green) and TIA-1 (red) was investigated using co-immunofluorescence, in sodium arsenite-treated (0.6 mM; 60 min) (stress) and untreated (control) cells. Cells were counter-stained to visualize nuclei (blue), scale bar = 10 μm. b, c SFPQ colocalizes with tau/p-tau in SGs after sodium arsenite induced oxidative stress in HeLa cells. Zoomed-in images of stress (arsenite treated) cells showing the overlap between SFPQ/tau in the cytoplasmic granules. d Representative immunoblot image for SFPQ after stress treatment. Intensity levels were normalized with β-actin. e The densitometric analysis was performed with Image Lab software. Statistical tests (t-tests) were applied in the GraphPad prism (6.01), *p < 0.05
Fig. 9
Fig. 9
Human tau-induced downregulation of SFPQ in HeLa cells detected by immunoblotting. ad Representative immunoblot images for tau, p-tau, SFPQ and TIA-1 after transient transfection of WT-tau or P301L-tau in HeLa cells. Densitometric analysis was performed with Lab image software. Statistical significance was estimated with one-way ANOVA and Tukey post-hoc test for multiple comparisons, *p < 0.05
Fig. 10
Fig. 10
Human tau-expression induced proteomic alterations: a, b Volcano plots of pairwise comparisons (t-tests with BH correction), showing the -log10-p-values (y-axis) and the log2(FC) of the proteins that were differentially expressed (x-axis) in both WT-tau and P301L-tau expressing cells in comparison to controls. The data points depicted in red are showing upregulated proteins and blue is representing downregulated proteins. c The heatmap of hierarchical clustering analysis of 314 DEPs among technical and biological replicates generated by Perseus software. The Log2-transformed expression values of significantly DEPs were normalized by Z-score. The columns are representing samples (tau-expressing cells: lanes 1–12 & control: lanes 13–24) and rows indicating significantly modulated proteins (cluster1, up-regulated (red), cluster2, down-regulated (green). The enriched functional terms (Fisher’s exact test with FDR multiple test correction) with their p-values and FDR values are shown on the right side
Fig. 11
Fig. 11
Temporal expression profile of total tau (tau-5), p-tau (S199), SFPQ and TIA-1 in 3xTg mice. a Representative immunoblot images showing expression of tau, p-tau, SFPQ and TIA-1 (C- & N-terminal specific antibodies) from AD (3xTg-inoculated, n = 4) mouse brain cortical tissues at the indicated ages (mpi: months post inoculation) and respective controls (3xTg-non-inoculated, n = 4). (*) We are unsure of this band. be The densitometric analyses were performed with Image Lab software. Unpaired t-tests were performed to calculate statistical significance at each time point. *p < 0.05, **p < 0.01
Fig. 12
Fig. 12
Current working model for SFPQ and tau-pathological features in rapidly progressive form of AD. The left box of the picture is depicting nuclear-cytoplasmic translocation of SFPQ and p-tau, and their localization in stress granules based on our data from the cellular model of stress. Oxidative stress induced redistribution of SFPQ and p-tau into cytoplasm, and recruitment into SGs. The right box is depicting pathological features of both proteins observed in the post-mortem brains of specifically rpAD cases. The nuclear dislocation of SFPQ was identified in the post-mortem brains of particularly rpAD cases. Further, SFPQ showed colocalization with tau-tangles, tau-oligomers and TIA-1 in the cytoplasm, in the human brain and also in cultures. Nuclear depletion of SFPQ can be toxic for the cells by both loss of function in the nucleus [49] and toxic gain of functions in the cytoplasm

References

    1. Abu-Rumeileh S, Capellari S, Parchi P. Rapidly progressive Alzheimer's disease: contributions to clinical-pathological definition and diagnosis. J Alzheimers Dis. 2018;63:887–897. doi: 10.3233/JAD-171181. - DOI - PubMed
    1. Alberti S, Halfmann R, King O, Kapila A, Lindquist S. A systematic survey identifies prions and illuminates sequence features of prionogenic proteins. Cell. 2009;137(1):146–158. doi: 10.1016/j.cell.2009.02.044. - DOI - PMC - PubMed
    1. Anderson P, Kedersha N. RNA granules. J Cell Biol. 2006;172(6):803–808. doi: 10.1083/jcb.200512082. - DOI - PMC - PubMed
    1. Apicco DJ, Ash PEA, Maziuk B, et al. Reducing the RNA binding protein TIA1 protects against tau-mediated neurodegeneration in vivo. Nat Neurosci. 2018;21(1):72–80. doi: 10.1038/s41593-017-0022-z. - DOI - PMC - PubMed
    1. Aulas A, Vande Velde C. Alterations in stress granule dynamics driven by TDP-43 and FUS: a link to pathological inclusions in ALS? Front Cell Neurosci. 2015;9:423. doi: 10.3389/fncel.2015.00423.eCollection2015. - DOI - PMC - PubMed

Publication types

Supplementary concepts