. 2021 May 20;22(3):bbaa120.
doi: 10.1093/bib/bbaa120.

Joint reconstruction of cis-regulatory interaction networks across multiple tissues using single-cell chromatin accessibility data

Affiliations

Joint reconstruction of cis-regulatory interaction networks across multiple tissues using single-cell chromatin accessibility data

Kangning Dong et al. Brief Bioinform. .

Abstract

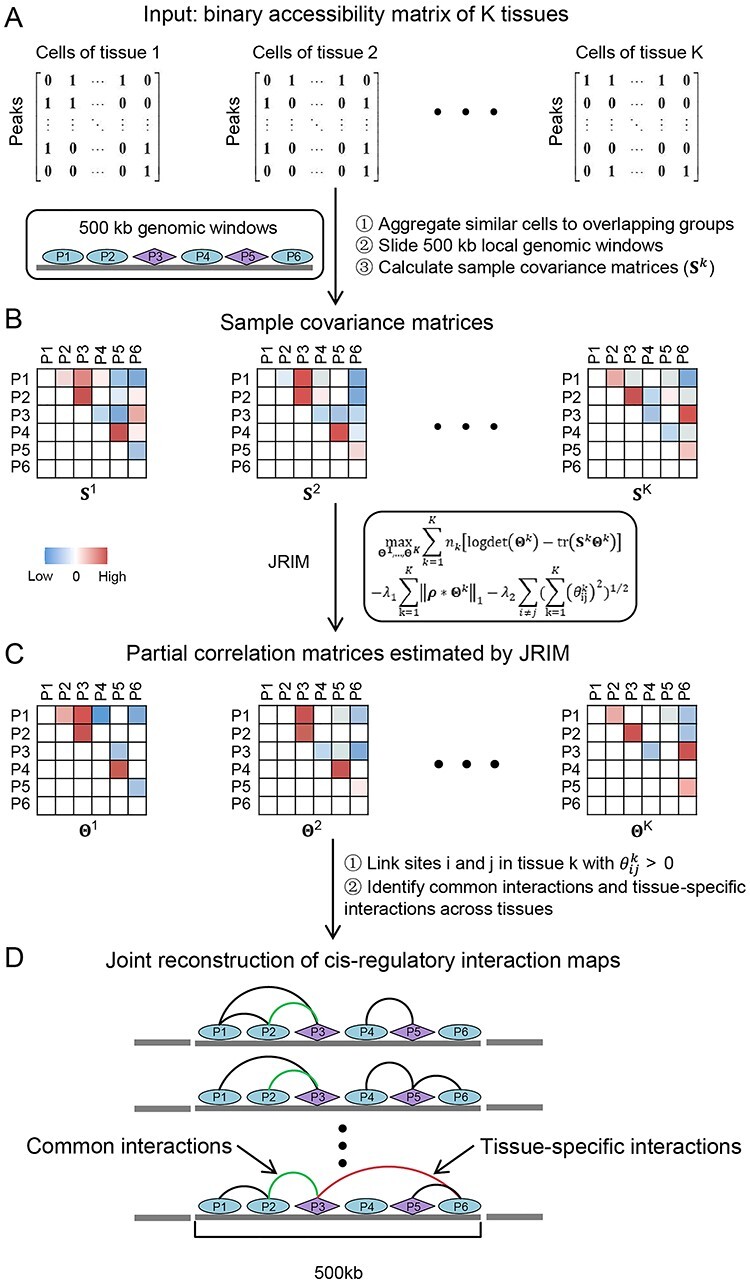
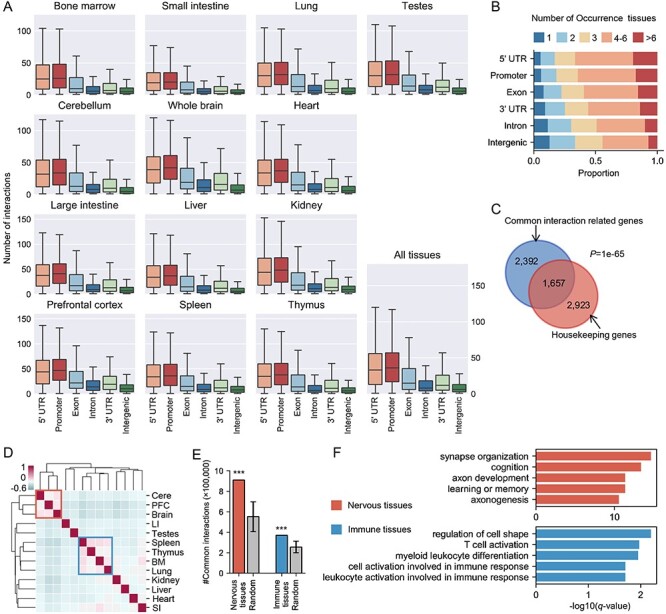
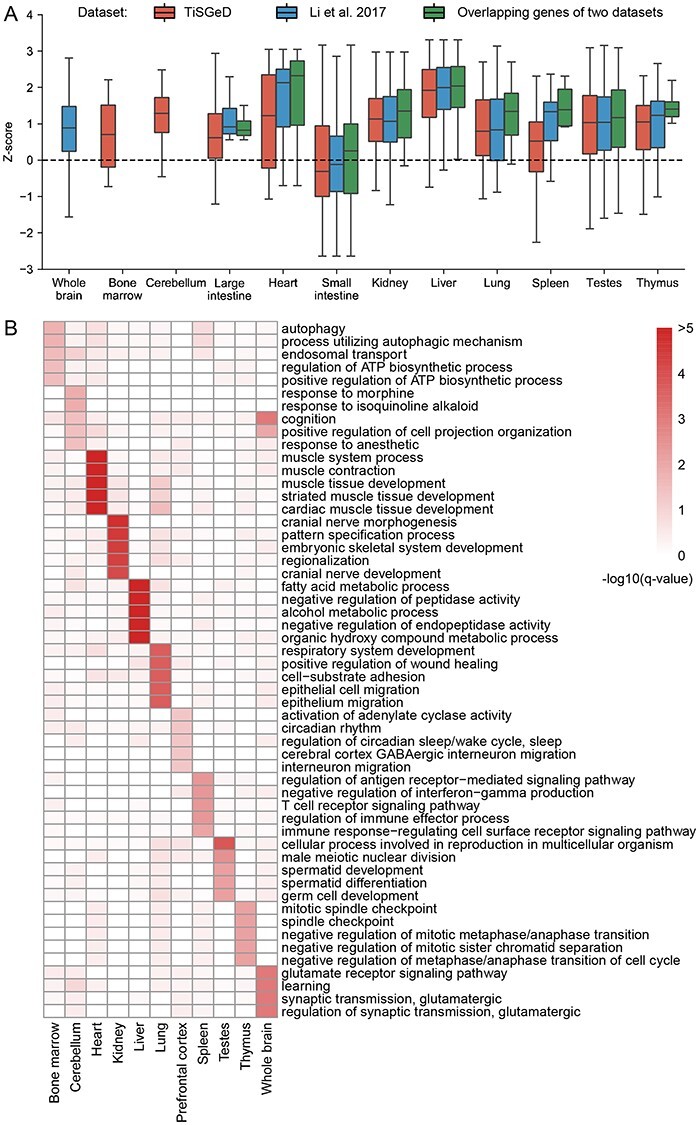
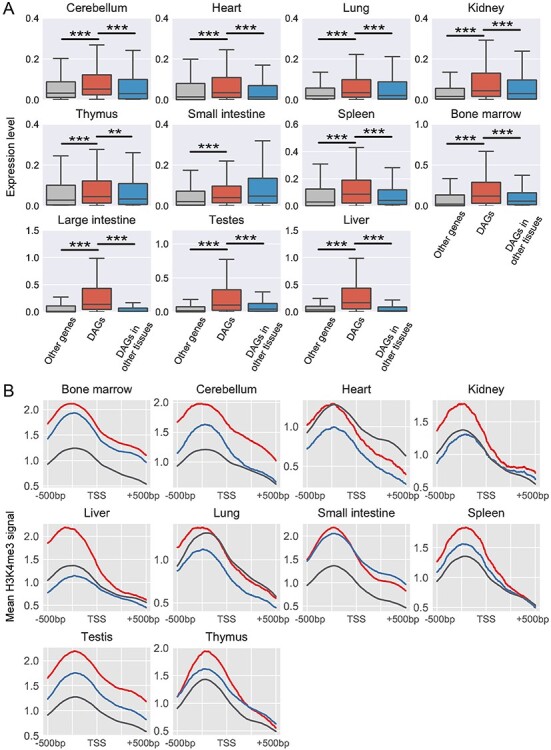
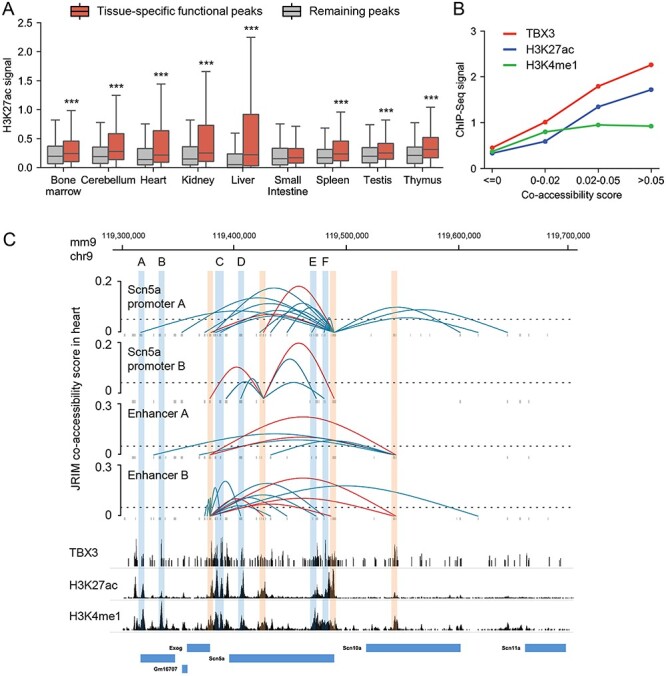
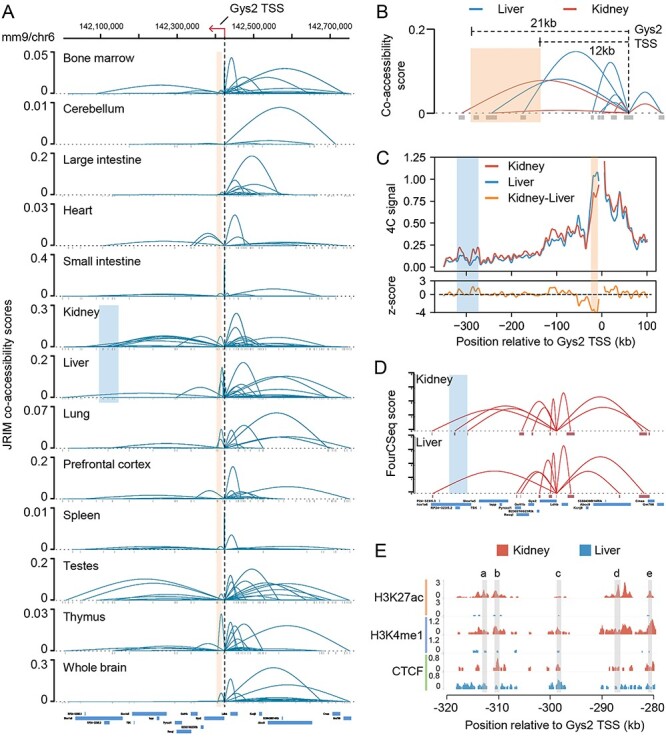
The rapid accumulation of single-cell chromatin accessibility data offers a unique opportunity to investigate common and specific regulatory mechanisms across different cell types. However, existing methods for cis-regulatory network reconstruction using single-cell chromatin accessibility data were only designed for cells belonging to one cell type, and resulting networks may be incomparable directly due to diverse cell numbers of different cell types. Here, we adopt a computational method to jointly reconstruct cis-regulatory interaction maps (JRIM) of multiple cell populations based on patterns of co-accessibility in single-cell data. We applied JRIM to explore common and specific regulatory interactions across multiple tissues from single-cell ATAC-seq dataset containing ~80 000 cells across 13 mouse tissues. Reconstructed common interactions among 13 tissues indeed relate to basic biological functions, and individual cis-regulatory networks show strong tissue specificity and functional relevance. More importantly, tissue-specific regulatory interactions are mediated by coordination of histone modifications and tissue-related TFs, and many of them may reveal novel regulatory mechanisms.

Keywords: cis-regulatory interaction networks; Gaussian graphical LASSO; single-cell ATAC-seq.


Figures

Figure 1
Figure 1
Illustration of the workflow of JRIM. (A) The input is binary single-cell chromatin accessibility data of multiple tissues. (B) JRIM aggregates similar cells to overlapping groups per tissue to overcome sparsity of single-cell data and calculates sample covariance matrices for local genomic windows. The purple diamond represents peaks overlapped with gene promoter and the ellipse represents remaining peaks. (C) JRIM jointly estimates local partial correlation matrices of K tissues and identifies co-accessible DNA element pairs, that is, cis-regulatory interactions. (D) Reconcile local regulatory interaction networks to achieve the reconstruction of genome-wide cis-regulatory interaction networks of all K tissues.
Figure 2
Figure 2
Basic characteristics of the reconstructed cis-regulatory interaction networks and the common interaction patterns across tissues. (A) Distribution of cis-regulatory interactions in six different genomic regions, including 5’ UTR, promoter, exon, intron, 3’ UTR and intergenic regions. (B) Distribution of conservation of genomic region-related interactions. Color reflects the number of tissues detecting corresponding regulatory interactions. (C) Venn diagram of the overlapping between common interaction-related genes and housekeeping gene set. The statistical significance was evaluated with Fisher’s exact test. (D) Hierarchical clustering of 13 tissues in terms of overlapping ratio of their cis-regulatory interactions. The two similar functional tissue clusters are marked by blue and red boxes. The values of heatmap represent Pearson’s correlation coefficients about the overlap ratio of cis-regulatory interactions. Cere: cerebellum; PFC: prefrontal cortex; LI: large intestine; BM: bone marrow; SI: small intestine. (E) Comparison of the number of common interactions of similar functional tissue clusters (nervous tissues and immune tissues) and those of random selection tissues. The error bars indicate the standard deviation and *** indicates P < 0.001 using one-sample Wilcoxon test. (F) GO terms enrichment in common interaction-related genes of similar functional tissues is associated with tissue sharing biological processes. Top 5 enriched GO terms of each cluster are shown.
Figure 3
Figure 3
Tissue specificity and functional relevance of the reconstructed cis-regulatory interaction networks. (A) Boxplots of z-scores of two tissue-specific differential expression gene datasets and their overlapping genes. The z-scores are calculated by the number of promoter-associated interactions in the reconstructed interaction networks. The dashed line is the theoretical mean value of z-scores for randomly selected genes. (B) Differential activity genes for each tissue are enriched in tissue-specific biological processes. Top 5 enriched GO terms with q-value<0.05 for each tissue are selected. −log10(q-value) is used to plot this heatmap.
Figure 4
Figure 4
Transcription and histone modification levels of tissue-specific differential activity genes. (A) Boxplots of transcription levels of differential activity genes (DAGs) and other genes in the single-cell RNA-seq dataset. The middle red box represents the RNA expression level of DAGs in the corresponding tissues. The left gray box represents expressions of other genes. The right blue box represents these DAGs expression in other tissues. Each middle box was compared with both left and right boxes using two-sample Wilcoxon tests. ** and *** indicate 0.001 < P < 0.01 and P < 0.001, respectively. (B) Enrichment analysis of H3K4me3 mark around TSSs of DAGs in ten tissues. The signals around DAGs TSSs and TSSs of remaining genes in the corresponding tissue are labeled with red and gray colors, respectively. The blue line is the mean signal around TSSs of DAGs in other tissues.
Figure 5
Figure 5
Illustration of the distinct regulatory mechanisms of Scn5a. (A) Boxplots of the H3K27ac signal of tissue-specific functional peaks compared to those of other peaks. (B) The occupancy profiles of TBX3, H3K4me1 signal and H3K27ac signal of Scn5a promoter-related peaks (co-accessibility score > 0) and other peaks. (C) The reconstructed cis-regulatory interaction network around the Scn10a-Scn5a locus (chr9: 119 300 000–119 700 000) in heart. The regions of Scn5a promoters and enhancer A, B are labeled with red boxes. Blue boxes indicate locations of TBX3 enriched regions A-F. The bottom is ChIP-seq data around Scn5a gene. The image is drawn on basis of WashU epigenome browser with RefSeq gene annotations.
Figure 6
Figure 6
Illustration of two tissue-specific enhancer-promoter interactions revealed by the reconstructed networks. (A) Visualization of Gys2 promoter-related interactions within region (chr6:142 000 000–142 750 000) in all 13 mouse tissues. The black dashed line indicates the location of Gys2 TSS. The red box indicates the genomic location of validated liver-specific enhancers. The blue box indicates a region located from 280 to 320 kb downstream of Gys2 promoter. (B) Comparison of regulatory networks of kidney and liver in the region from 25 kb downstream to 10 kb upstream of Gys2 promoter. The red box indicates the same genomic location as in (A). (C) The 4C-seq signal in a 450 kb genomic region surrounding Gys2 in kidney and liver. The 4C-seq data generated in [58] depict the interaction frequencies of Gys2 promoter. The red box and blue box are the same as in (A). (D) Spatial interaction networks around Gys2 TSS in kidney and liver estimated by FourCSeq using 4C-seq data. The blue box indicates the same region as in (A). (E) Signals of three chromatin modification marks across the region located from 280 to 320 kb downstream of Gys2 promoter. Grey boxes indicate the location of accessible peaks a–e.

References

    1. Wittkopp PJ, Kalay G. Cis-regulatory elements: molecular mechanisms and evolutionary processes underlying divergence. Nat Rev Genet 2012;13:59–69. - PubMed
    1. Zhang S, Tian D, Tran NH, et al. . Profiling the transcription factor regulatory networks of human cell types. Nucleic Acids Res 2014;42:12380–7. - PMC - PubMed
    1. Ernst J, Kellis M. ChromHMM: automating chromatin-state discovery and characterization. Nat Methods 2012;9:215–6. - PMC - PubMed
    1. Chen C, Zhang S, Zhang X-S. Discovery of cell-type specific regulatory elements in the human genome using differential chromatin modification analysis. Nucleic Acids Res 2013;41:9230–42. - PMC - PubMed
    1. Yang X, Shao X, Gao L, et al. . Systematic DNA methylation analysis of multiple cell lines reveals common and specific patterns within and across tissues of origin. Hum Mol Genet 2015;24:4374–84. - PubMed

Publication types