. 2020 Oct 5;217(10):e20200840.
doi: 10.1084/jem.20200840.

Potent human broadly neutralizing antibodies to hepatitis B virus from natural controllers

Affiliations

Potent human broadly neutralizing antibodies to hepatitis B virus from natural controllers

Verena Hehle et al. J Exp Med. .

Abstract

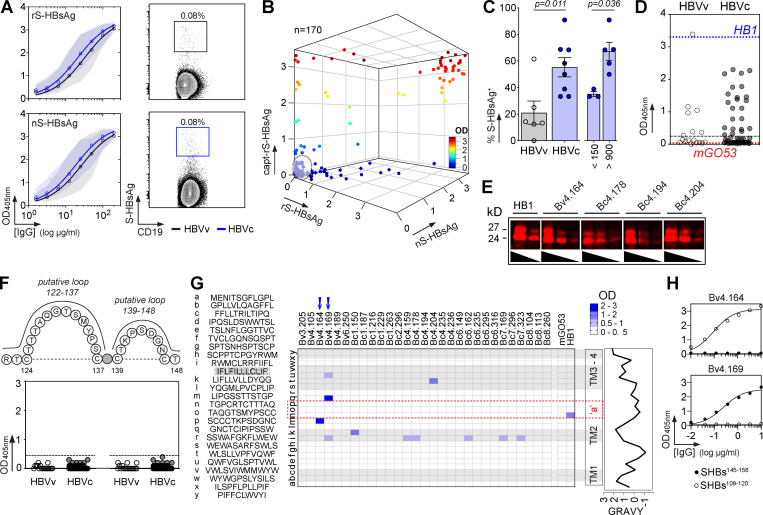
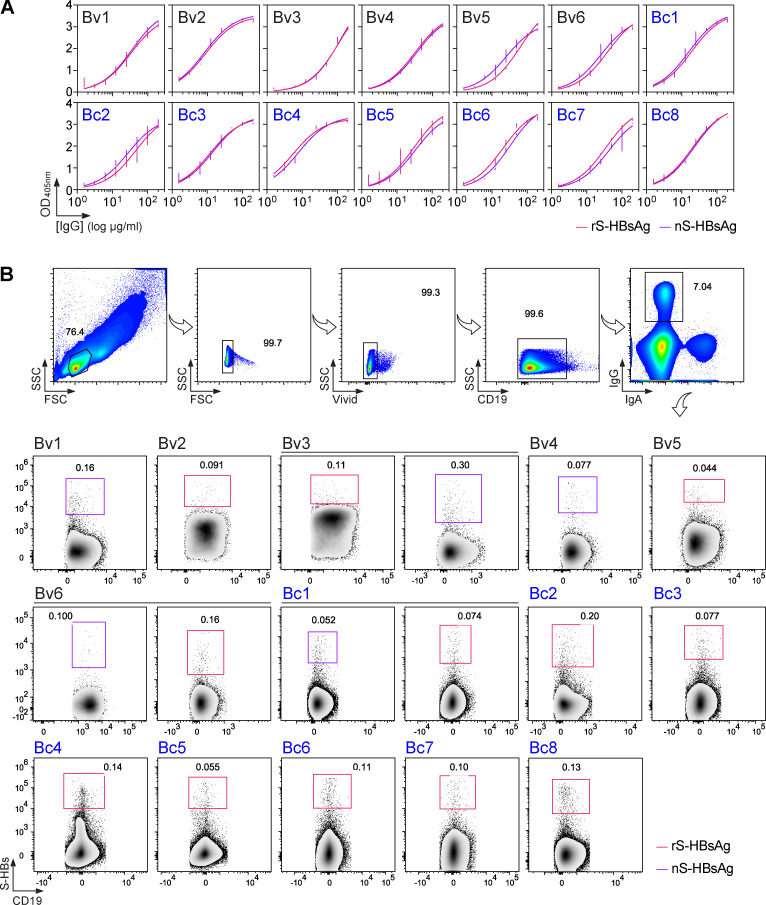
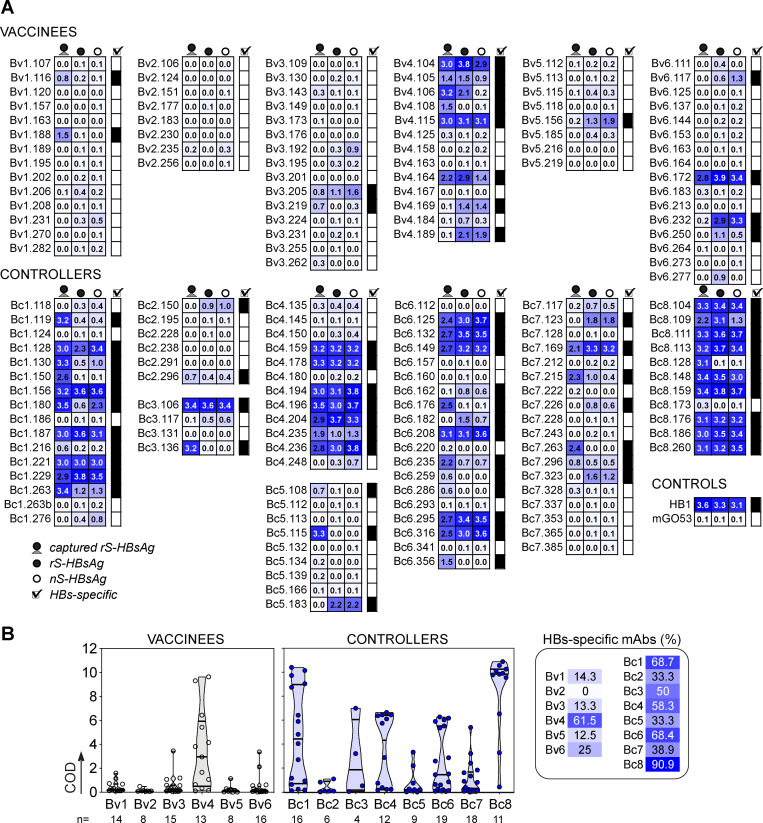
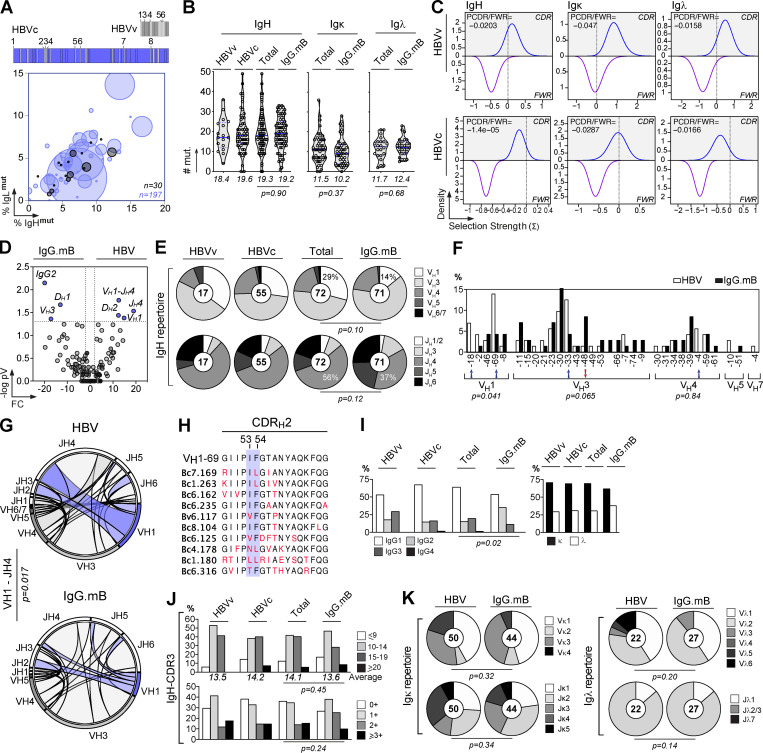
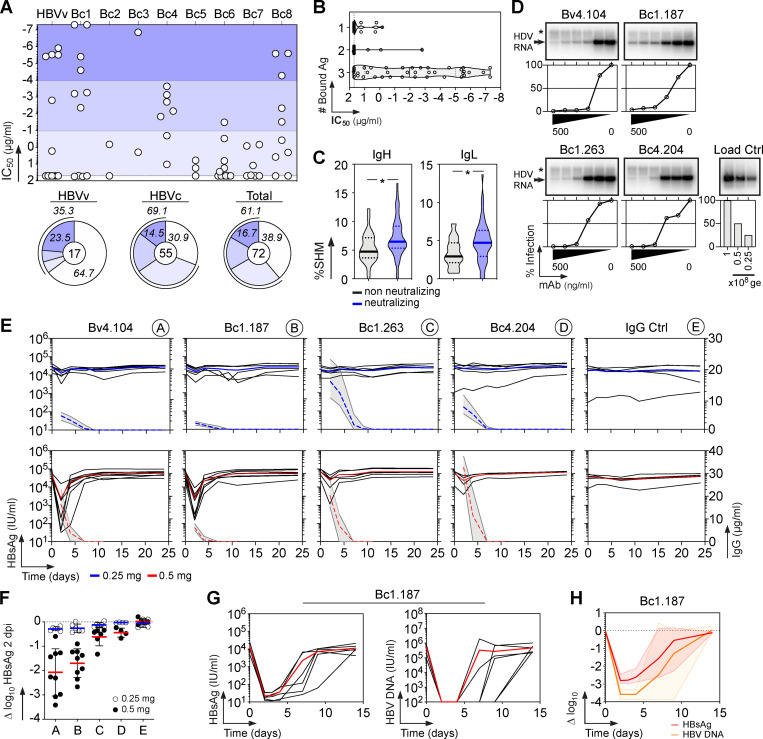
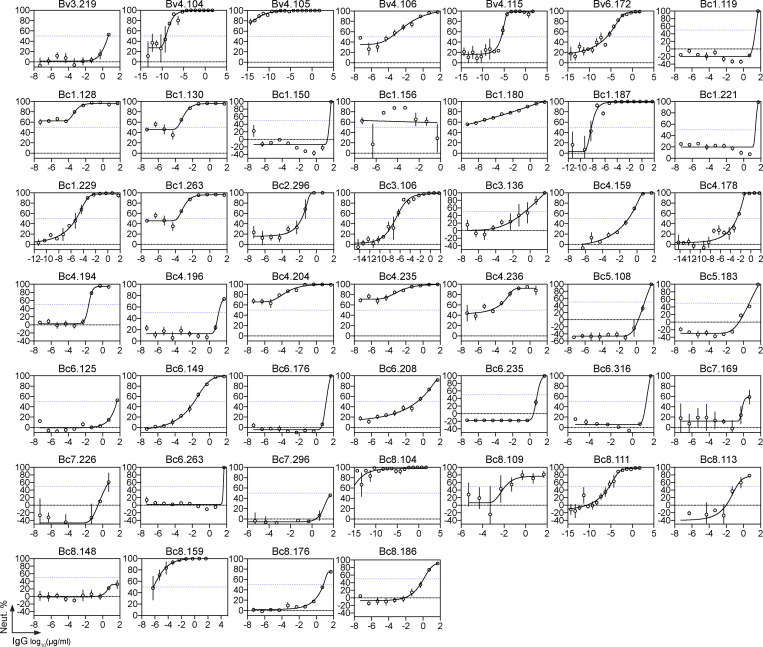
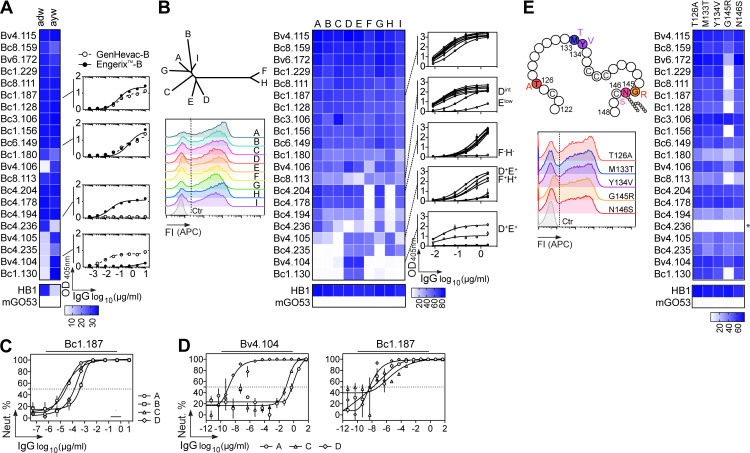
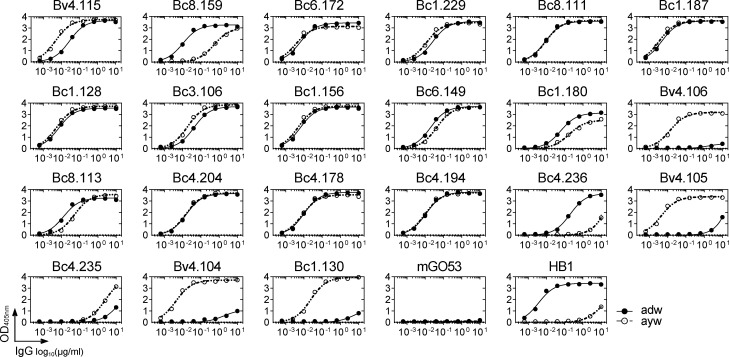
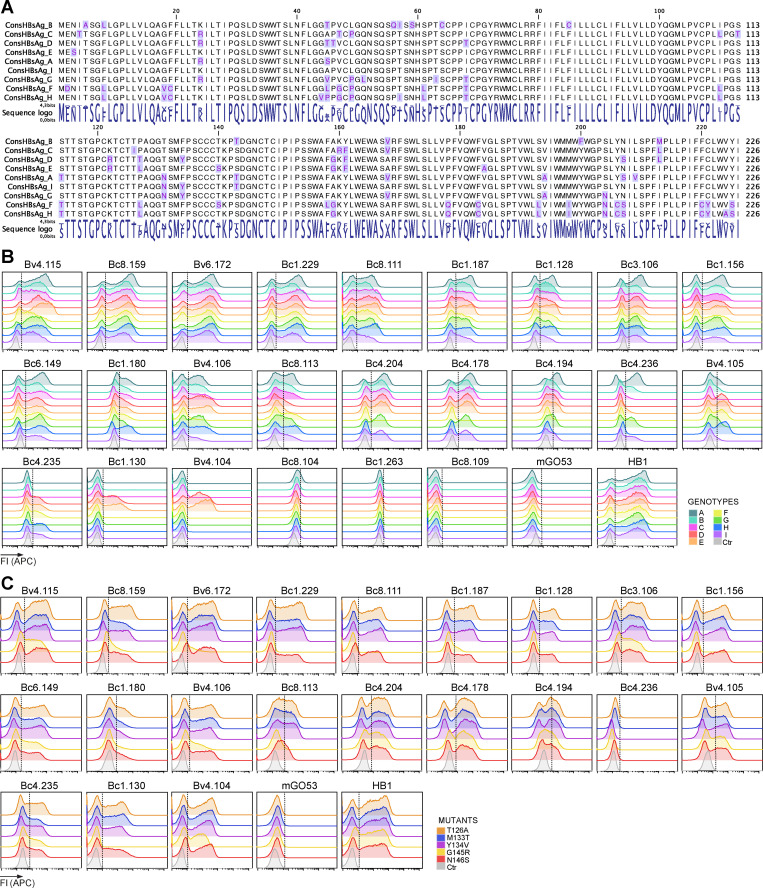
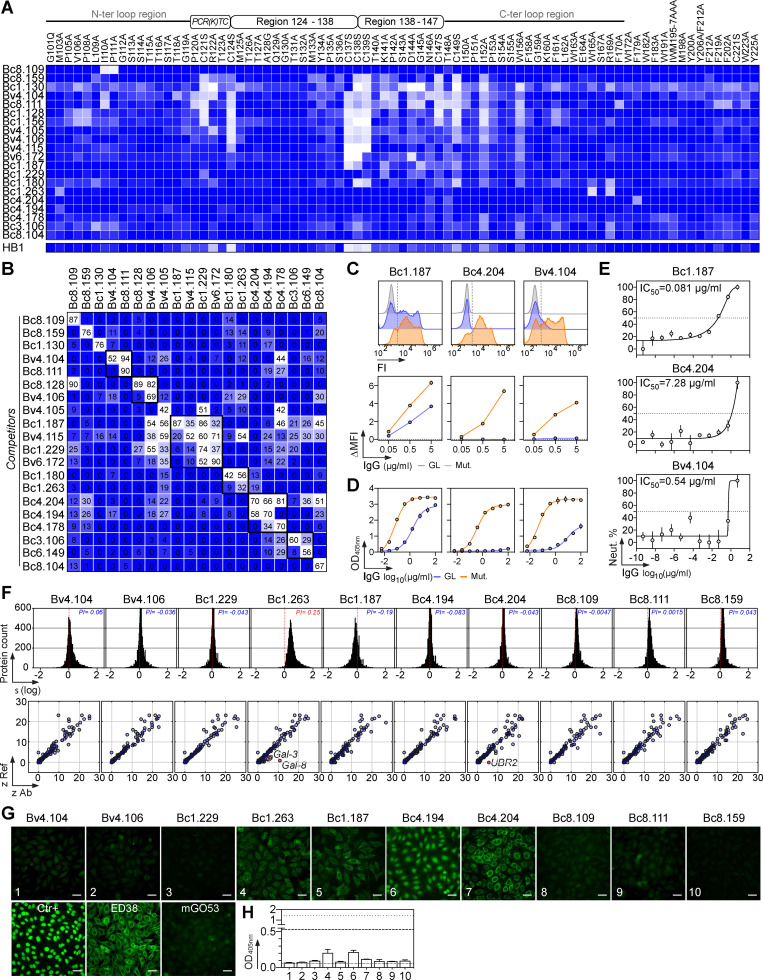
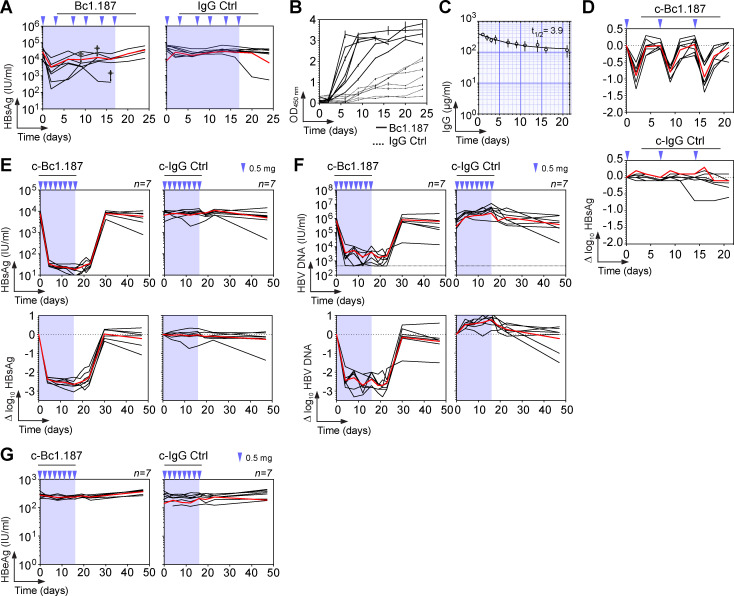
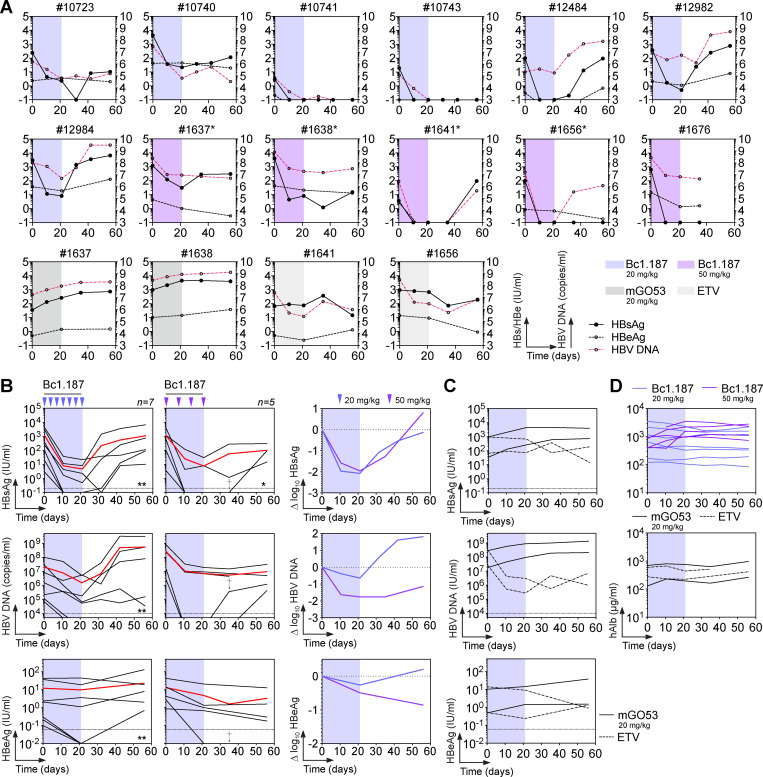
Rare individuals can naturally clear chronic hepatitis B virus (HBV) infection and acquire protection from reinfection as conferred by vaccination. To examine the protective humoral response against HBV, we cloned and characterized human antibodies specific to the viral surface glycoproteins (HBsAg) from memory B cells of HBV vaccinees and controllers. We found that human HBV antibodies are encoded by a diverse set of immunoglobulin genes and recognize various conformational HBsAg epitopes. Strikingly, HBsAg-specific memory B cells from natural controllers mainly produced neutralizing antibodies able to cross-react with several viral genotypes. Furthermore, monotherapy with the potent broadly neutralizing antibody Bc1.187 suppressed viremia in vivo in HBV mouse models and led to post-therapy control of the infection in a fraction of animals. Thus, human neutralizing HBsAg antibodies appear to play a key role in the spontaneous control of HBV and represent promising immunotherapeutic tools for achieving HBV functional cure in chronically infected humans.


Conflict of interest statement

Disclosures: V. Hehle reported a patent to anti-HBV antibodies and methods of use, pending. M. Beretta reported a patent to anti-HBV antibodies and methods of use, pending. M. Bourgine reported a patent to anti-HBV antibodies and methods of use, pending. M. Ait-Goughoulte reported a patent planned on the antibodies pending, "Roche." S. Pol reported personal fees from Gilead, Abbvie, BMS, Janssen, and Roche outside the submitted work. H. Strick-Marchand reported a patent to human neutralizing HBV antibodies and their use thereof, pending. N. Pelletier reported personal fees from Hoffmann-La Roche outside the submitted work; in addition, N. Pelletier had a patent planned to be submitted, pending "Roche Innovation Center Basel." H. Mouquet reported grants from Institut Roche during the conduct of the study; in addition, H. Mouquet had a patent to anti-HBV antibodies and methods of use, pending. No other disclosures were reported.

Figures

Figure 1.
Figure 1.
S-HBsAg–specific memory antibodies cloned from HBV vaccinees and controllers. (A) Average S-HBsAg reactivity of serum IgGs from HBV vaccinees (HBVv, n = 6, black gate, top) and controllers (HBVc, n = 8, blue gate, bottom) as shown in Fig. S1 A. Shaded regions indicate value ranges. Representative flow-cytometry plots showing S-HBsAg-binding IgG+ memory B cells in HBV vaccinees and controllers as in Fig. S1 B; Bv4 and Bc3 are shown). nS-HBsAg and rS-HBsAg are human-derived nS-HBsAg and rS-HBsAg particles, respectively. (B) S-HBsAg-ELISA reactivities of S-HBsAg–captured IgG+ memory B cell antibodies. capt-rS-HBsAg, rS-HBsAg capture ELISA. Means of triplicate values are shown as measured in Fig. S2 A. (C) Percentage of S-HBsAg–specific monoclonal antibodies (% S-HBsAg+) isolated from HBVv and HBVc (right). % S-HBsAg+ according to anti-HBs antibody titers in HBVc (<150 and >900 IU/ml) are indicated. Groups were compared using the Mann–Whitney test. (D) ELISA reactivity of anti-HBs antibodies against TM domains–deleted S-HBsAg protein (ΔTM-rS-HBsAg). HB1 and mGO53 are positive and negative controls, respectively. The dotted line indicates the cutoff OD405nm for positive reactivity. Means of assay triplicates from three independent experiments are shown. (E) Infrared immunoblot shows anti-HBs memory IgGs reactive against denatured S-HBsAg proteins. The immunoreactive bands correspond to HBV p24 and gp27 proteins. (F) Same as in D but for the cyclic peptides corresponding to putative S-HBsAg loops 122–137 and 139–148. (G) Heat-mapped reactivity of ΔTM-rS-HBsAg–binding antibodies against S-HBsAg overlapping linear peptides. Means of triplicate OD values from one representative experiment (n = 3) are shown. HB1 and mGO53 are positive and negative controls, respectively. Amino acid sequences (left) and values of grand average of hydropathy (GRAVY; right) of S-HBsAg peptides are indicated. Blue arrows indicate peptide-reactive human anti-HBs antibodies. (H) ELISA binding curves of peptide-reactive anti-HBs antibodies are shown (means of assay quadruplicates ± SD).
Figure S1.
Figure S1.
Binding of purified serum IgGs and blood IgG+ memory B cells to S-HBsAg. Related to Fig. 1. (A) Representative ELISA graphs showing the reactivity of purified serum IgG antibodies from HBV vaccinees (HBVv) and controllers (HBVc) against rS-HBsAg and human-derived nS-HBsAg particles. Error bars indicate the SEM of duplicate values. (B) Flow-cytometric cytograms showing the gating strategy used to single-cell sort IgG+ memory B cells binding to fluorescently labeled rS-HBsAg and nS-HBsAg proteins used as baits. The S-HBsAg–reactive IgG+ memory B cell population is shown for all donors. SSC, side scatter; FSC, forward scatter.
Figure S2.
Figure S2.
S-HBsAg reactivity of S-HBsAg-captured IgG+ memory B cell antibodies. Related to Fig. 1. (A) Heat map showing the ELISA reactivity against nS-HBsAg and rS-HBsAg (immobilized and captured) of S-HBsAg–binding memory antibodies cloned from HBV vaccinees and controllers. Means of triplicate OD values are shown. (B) Violin plots showing the cumulative ELISA OD (COD) values for the bindings shown in A. The proportion of HBs-specific antibodies cloned from S-HBsAg-captured IgG+ memory B cells is shown per donor (right).
Figure 2.
Figure 2.
Immunoglobulin gene repertoire of S-HBsAg-specific IgG+ memory B-cells. (A) Bubble plot showing the level of clonal expansions according to percentages of somatic mutations in the IgH and IgL chain variable domains of S-HBsAg–specific IgG antibodies. The size of the expansions for each donor is indicated in the bar graph below. (B) Violin plots comparing the number of mutations in VH, Vκ, and Vλ genes in HBs-specific and control IgG+ memory B cells (n = 72). The average number of mutations (# mut.) is indicated below each dot plot. Numbers of mutations were compared across groups of antibodies using the unpaired Student t test with Welch’s correction. (C) Graphs showing the Bayesian estimation of antigen-driven selection based on anti-S-HBs IgH and IgL sequences. FWR, framework regions. (D) Volcano plot analysis comparing the Ig gene repertoire of S-HBsAg–specific IgG+ B cells from HBV immune donors and IgG+ memory B cells from healthy individuals (IgG.mB; Prigent et al., 2016). Blue dots indicate statistically significant differences between both Ig gene repertoires. pV, P value; FC, fold changes. (E) Pie charts comparing the distribution of VH/JH gene usage of blood S-HBsAg–specific IgG+ memory B cells and IgG+ memory B cells from healthy individuals (IgG.mB). The number of antibody sequences analyzed is indicated in the center of each pie chart. (F) Bar graph comparing the distribution of single Ig VH genes expressed by S-HBsAg–specific and control IgG+ memory B cells. (G) Circos plots comparing the VH(DH)JH rearrangement frequencies between S-HBsAg–specific IgG+ memory B cells and IgG+ memory B cells from healthy individuals (IgG.mB). (H) Amino acid alignment of the CDRH2 region (defined by Kabat) of VH1-69–expressing anti-HBs antibodies. Residues in red indicate substitutions compared with the GL VH gene (on the top). (I) Bar graph comparing the distribution of IgG subtypes (left) and κ- vs. λ-Ig chain usage (right) as in F. (J) Same as in I but for the CDRH3 lengths and positive charge numbers. The average of CDRH3 lengths is indicated below each histogram. (K) Same as in E but for Vκ/Jκ and Vλ/Jλ gene usages. Groups were compared (in D–G and I–K) using 2 × 2 and 2 × 5 Fisher’s exact tests.
Figure 3.
Figure 3.
Neutralizing activity of human anti-HBs memory antibodies. (A) Dot plot showing the neutralizing activity of anti-HBs IgG antibodies (n = 72) against in vitro infection of HepaRG cells by genotype D HBV. Dots represent IC50 values for each antibody calculated from Fig. S3. Pie charts (bottom) show the distribution of nonactive (white) vs. neutralizing (shades of blue) antibodies according to neutralization potency. (B) Violin plots comparing the neutralization capacity of anti-HBs IgGs according to bound S-HBsAg proteins (nS-HBsAg, rS-HBsAg, and captured rS-HBsAg as measured in Fig. S2). (C) Violin plots comparing the percentage of somatic hypermutations (%SHM) between nonneutralizing and neutralizing antibody groups. Groups in B and C were compared using the Mann–Whitney test. (D) In vitro neutralizing activity of selected anti-HBs monoclonal IgG antibodies against HDV using HDV RNA quantification in Huh-106 cells by Northern blotting. ge, genome equivalents. Asterisk indicates ribosomal RNA. (E) In vivo neutralization activity of human anti-HBs antibodies in HBV-carrier mice. Circulating blood HBsAg levels were monitored in HBV-carrier mice treated once i.v. with 0.25 mg of anti-HBs antibodies Bv4.104 (n = 6), Bc1.187 (n = 6), Bc1.263 (n = 6), Bc4.204 (n = 6), or mGO53 isotype control (n = 5), and 0.5 mg of anti-HBs antibodies Bv4.104 (n = 9), Bc1.187 (n = 9), Bc1.263 (n = 6), Bc4.204 (n = 4), or mGO53 isotype control (n = 5). Blue and red lines represent averages. Graphs also show the evolution of human IgG titers of anti-HBs neutralizers over time in treated HBV-carrier mice. Dotted lines indicate the means and gray area the value ranges. (F) Log10 changes of HBsAg titers at nadir (2 dpi) upon antibody administration of 0.25 mg (white) and 0.5 mg (black) per mouse are shown. Means are indicated in red (0.5 mg) and blue (0.25 mg). (G) Circulating blood HBsAg and HBV DNA levels were monitored in HBV-carrier mice (n = 6) injected once i.v. with 1 mg of the anti-HBs antibody Bc1.187. (H) Average log10 changes over time of HBsAg (red) and HBV DNA (orange) levels.
Figure S3.
Figure S3.
In vitro HBV neutralization by human anti-HBs antibodies. Related to Fig. 3. Graphs show neutralization curves of genotype D HBV viruses by selected human anti-HBs antibodies as measured in vitro using the HepaRG cell assay. The dotted horizontal line indicates 50% neutralization, from which the IC50 value can be derived from the antibody concentration on the x axis. Error bars indicate the SEM of triplicate measurements.
Figure 4.
Figure 4.
Cross-reactivity of human HBV neutralizing antibodies. (A) Heat map comparing the ELISA reactivity of HBV neutralizing antibodies against adw and ayw genotype D S-HBsAg particles (measured as area under the curve values from Fig. S4). Representative ELISA graphs on the right show the reactivity of selected antibodies against recombinant HBV vaccines Engerix-B (adw) and GenHevac-B (ayw). Error bars indicate the SD of assay duplicates. (B) Heat map comparing the reactivity of HBV neutralizing antibodies against S-HBsAg antigens from genotypes depicted in the phylogenic tree (top left), as % of bound S-HBsAg-expressing cells determined by flow cytometry. Data represent one of two independent experiments as shown in Fig. S5 B. HB1 and mGO53 are positive and negative controls, respectively. Cytograms in the bottom left shows a representative reactivity profile of HB1 antibody. ELISA graphs on the right show the reactivity of selected antibodies against rS-HBsAg proteins from all genotypes but G. Error bars indicate the SD of assay duplicates. (C) Graph comparing the neutralizing (Neut.) activity of Bc1.187 against infection of PHHs by HBV viruses from A to D genotypes. Error bars indicate the SEM of assay triplicates. (D) Graphs show neutralization curves of HBV viruses from genotype A, C, and D by Bv4.104 and Bc1.187 antibodies as determined by the HepaRG neutralization assay. Error bars indicate the SEM of assay triplicates. (E) Same as in B but for S-HBsAg mutant proteins depicted on the diagram in the top left (Fig. S5 C). Asterisk indicates that this antibody was initially not reactive against genotype D S-HBsAg. FI, fluorescence intensity.
Figure S4.
Figure S4.
Binding of HBV neutralizing antibodies to recombinant serotype-specific S-HBsAg. Related to Fig. 4. Representative ELISA graph showing the binding of selected HBV neutralizing antibodies to purified recombinant adw (straight lines) and ayw (dotted lines) S-HBsAg particles. HB1 and mGO53 are positive and negative control, respectively. Mean values ± SEM of assay duplicates from one or two independent experiments are shown.
Figure S5.
Figure S5.
Cross-reactivity of HBV neutralizing antibodies against genotype-specific and mutant S-HBsAg proteins. Related to Fig. 4. (A) Amino acid alignment of the consensus S-HBsAg protein sequences from different HBV genotypes used in B. Residue variations are highlighted in blue. (B) Cytograms comparing the reactivity profiles of selected HBV neutralizing antibodies against genotype-specific S-HBsAg. Data represent one of two independent experiments. HB1 and mGO53 are positive and negative control, respectively. Ctr, nontransfected cell control (gray); FI, fluorescence intensity. (C) Cytograms comparing the reactivity of selected HBV neutralizing antibodies against genotype D S-HBsAg mutant proteins displaying naturally occurring escape mutations (T126A, M133T, Y134V, or G145R), or a mutation in the S-HBsAg N-glycosylation site (N146S). Data represent one of two independent experiments. HB1 and mGO53 are positive and negative control, respectively. Ctr, nontransfected cell control (gray).
Figure 5.
Figure 5.
Binding features of human HBV neutralizing antibodies. (A) Heat map shows the ELISA binding of selected HBV neutralizing antibodies to recombinant HBsAg mutant proteins. Color value is proportional to the reactivity level. (B) Heat map showing competition for S-HBsAg binding of the HBV neutralizing antibodies tested in duplicate. Lighter colors indicate stronger inhibition; dark blue indicates no competition. (C) S-HBsAg binding of the selected HBV neutralizing antibodies and their GL counterparts as measured in duplicate by flow cytometry. Representative cytograms are shown on the top. (D) Same as in C but as determined by ELISA. Means ± SD of triplicate assay values are shown. (E) In vitro neutralizing activity of the GL versions of Bc1.187, Bc4.204, and Bv4.104 against genotype D HBV viruses as determined by the HepaRG neutralization assay. Error bars indicate the SD of assay triplicates. (F) Reactivity profile of selected anti-HBs human antibodies on human protein microarrays. Frequency histograms showing the log10 protein displacement (σ) of the mean fluorescence intensity signals for anti-HBs antibodies compared with nonreactive antibody mGO53 (top). The PI corresponds to the Gaussian mean of all array protein displacements. Microarray reactivity plots showing anti-HBs antibody binding to human proteins (bottom). Each spot correspond to the z-scores given on a single protein by the reference (Ref: mGO53, y axis) and test antibody (x axis). Red dots indicate immunoreactive proteins (z > 5). (G) Binding of selected anti-HBs antibodies to HEp2-expressing self-antigens was assayed by indirect immunofluorescence assay. Ctr+, positive control of the kit. mGO53 and ED38 are negative and positive control antibodies, respectively. The scale bars represent 40 µM. (H) Bar graph shows the HEp-2 reactivity as measured by ELISA. Means ± SD of values from two independent experiments performed in duplicate are shown.
Figure 6.
Figure 6.
Bc1.187 antibody therapy in HBV-carrier mice. (A) Circulating blood HBsAg levels over time in AAV-HBV–transduced mice (n = 7) treated every 3–4 d for 17 d with 0.5 mg i.v. of human anti-HBs antibody Bc1.187 or mGO53 isotype control (blue arrows). Blue-shaded area indicates the antibody therapy period. (B) Murine anti-human IgG antibody levels in the treated mice shown in A as measured in duplicate by ELISA. (C) IgG concentrations of passively administrated chimeric Bc1.187 antibody (0.5 mg i.v.) in B6 mice (n = 4). Error bars represent SD values. Half-life in days (t1/2) of chimeric antibody Bc1.187 is indicated in the upper-right corner. (D) Δlog10 HBsAg levels over time in C57BL/6J mice receiving weekly i.v. injections (0.5 mg) of chimeric antibody Bc1.187 (c-Bc1.187) and mGO53 isotype control (c-mGO53). Red lines indicate the averages. (E) Evolution of blood HBsAg levels over time in HBV-carrier mice (n = 7 per group) treated every 2 d for 16 d with 0.5 mg i.v. of anti-HBs Bc1.187 or isotype control mGO53 chimeric antibody (blue arrows). Red lines indicate the averages. Blue-shaded area indicates the antibody therapy period. Corresponding Δlog10 HBsAg levels compared with baseline are shown at the bottom. (F) Same as in E but for blood HBV DNA levels. (G) Same as in E but for blood HBeAg levels.
Figure 7.
Figure 7.
Bc1.187 antibody therapy in HBV-infected HUHEP mice. (A) Blood HBsAg, HBeAg, and HBV DNA levels over time for each individual HUHEP mouse infected with genotype D HBV, and treated with anti-HBs antibody Bc1.187 for 3 wk with either 20 mg/kg or 50 mg/kg human antibody i.p. Asterisk indicates mice in control groups that were reused for a treatment regimen of Bc1.187 antibody at 50 mg/kg. (B) Evolution of infection over time in HBV-infected HUHEP mice receiving i.p. injections of human anti-HBs antibody Bc1.187 (20 mg/kg ∼0.4 mg every 3–4 d, n = 7; 50 mg/kg ∼1 mg, weekly, n = 5) for 3 wk. Red lines indicate the averages. Dagger (†) and asterisk indicate dead and controlled mice, respectively. The number of asterisks indicates the number of controlled mice. Circulating blood HBsAg, HBeAg, and HBV DNA levels (left) and average Δlog10 values compared with baseline (right, 20 mg/kg, blue lines; 50 mg/kg, purple lines) are shown. (C) Evolution of HBV infection over time in HBV-infected HUHEP mice receiving a treatment with the non-HBV isotype control mGO53 (20 mg/kg i.p.) or Entecavir (ETV) every 3–4 d for 3 wk. Blood levels of HBsAg (black lines), HBeAg (magenta dotted lines), and HBV DNA (black dotted lines) are shown. (D) Graphs showing the levels of human serum albumin over time in infected HUHEP mice and treated i.p. with 20 mg/kg and 50 mg/kg of Bc1.187 antibody as shown in B.

Comment in

  • Neutralizing hepatitis B.
    Robbiani DF. Robbiani DF. J Exp Med. 2020 Oct 5;217(10):e20201261. doi: 10.1084/jem.20201261. J Exp Med. 2020. PMID: 32790869 Free PMC article.

References

    1. Andrews S.F., Huang Y., Kaur K., Popova L.I., Ho I.Y., Pauli N.T., Henry Dunand C.J., Taylor W.M., Lim S., Huang M., et al. . 2015. Immune history profoundly affects broadly protective B cell responses to influenza. Sci. Transl. Med. 7 316ra192 10.1126/scitranslmed.aad0522 - DOI - PMC - PubMed
    1. Bauer T., Sprinzl M., and Protzer U.. 2011. Immune control of hepatitis B virus. Dig. Dis. 29:423–433. 10.1159/000329809 - DOI - PubMed
    1. Bertoletti A., and Ferrari C.. 2012. Innate and adaptive immune responses in chronic hepatitis B virus infections: towards restoration of immune control of viral infection. Gut. 61:1754–1764. 10.1136/gutjnl-2011-301073 - DOI - PubMed
    1. Bertoletti A., and Ferrari C.. 2016. Adaptive immunity in HBV infection. J. Hepatol. 64(1, Suppl):S71–S83. 10.1016/j.jhep.2016.01.026 - DOI - PubMed
    1. Burton A.R., Pallett L.J., McCoy L.E., Suveizdyte K., Amin O.E., Swadling L., Alberts E., Davidson B.R., Kennedy P.T., Gill U.S., et al. . 2018. Circulating and intrahepatic antiviral B cells are defective in hepatitis B. J. Clin. Invest. 128:4588–4603. 10.1172/JCI121960 - DOI - PMC - PubMed

Publication types