Review
. 2020 Nov;237(5):811-826.
doi: 10.1111/joa.13249. Epub 2020 Jun 24.

Femoral anteversion: significance and measurement

Affiliations
Review

Femoral anteversion: significance and measurement

Matteo Scorcelletti et al. J Anat. 2020 Nov.

Abstract

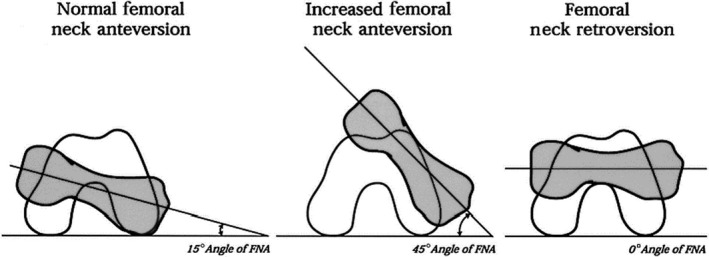
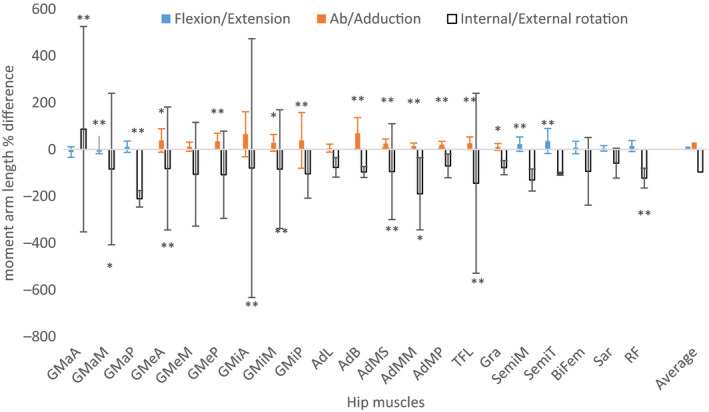
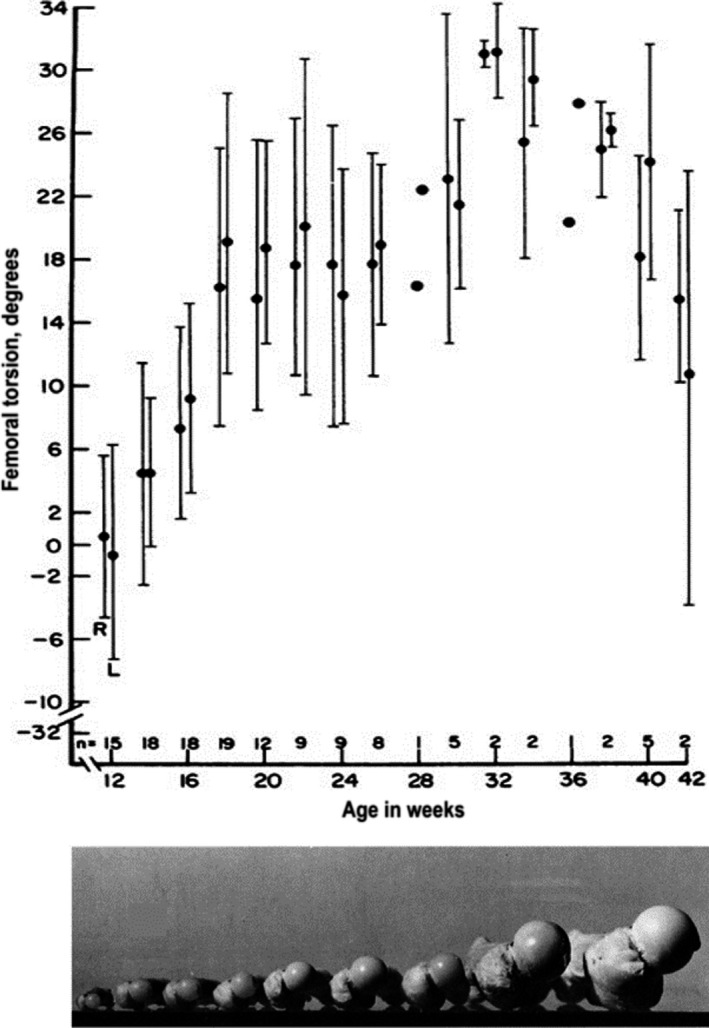
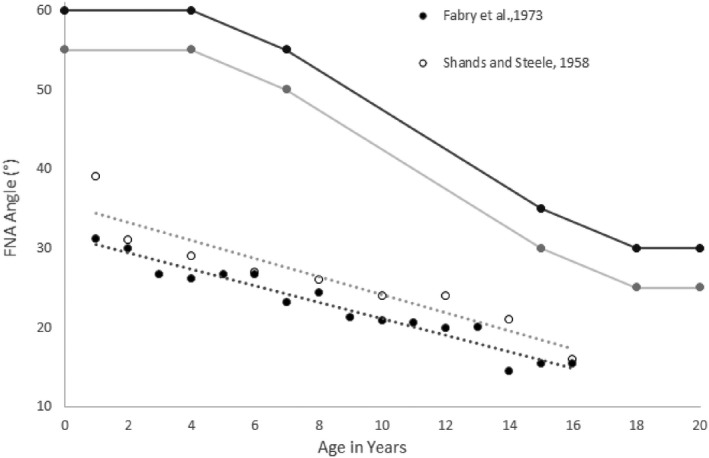
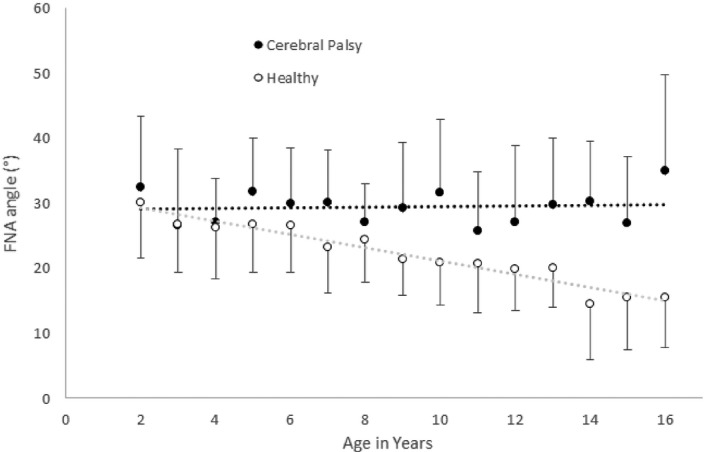
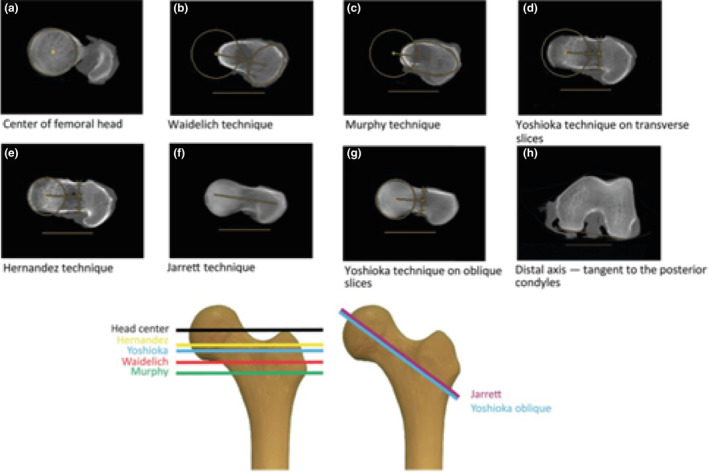
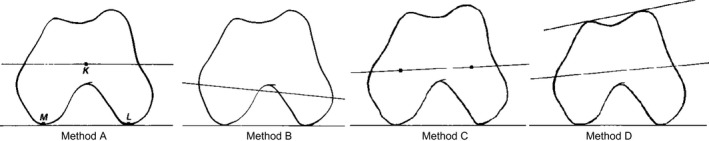
Femoral neck anteversion (FNA) is the angle between the femoral neck and femoral shaft, indicating the degree of torsion of the femur. Differences in FNA affect the biomechanics of the hip, through alterations in factors such as moment arm lengths and joint loading. Altered gait associated with differences in FNA may also contribute to the development of a wide range of skeletal disorders including osteoarthritis. FNA varies by up to 30° within apparently healthy adults. FNA increases substantially during gestation and thereafter decreases steadily until maturity. There is some evidence of a further decrease at a much lower rate during adulthood into old age, but the mechanisms behind it have never been studied. Development of FNA appears to be strongly influenced by mechanical forces experienced during everyday movements. This is evidenced by large differences in FNA in groups where movement is impaired, such as children born breech or individuals with neuromuscular conditions such as cerebral palsy. Several methods can be used to assess FNA, which may yield different values by up to 20° in the same participant. While MRI and CT are used clinically, limitations such as their cost, scanning time and exposure to ionising radiation limit their applicability in longitudinal and population studies, particularly in children. More broadly, applicable measures such as ultrasound and functional tests exist, but they are limited by poor reliability and validity. These issues highlight the need for a valid and reliable universally accepted method. Treatment for clinically problematic FNA is usually de-rotational osteotomy; passive, non-operative methods do not have any effect. Despite observational evidence for the effects of physical activity on FNA development, the efficacy of targeted physical activity remains unexplored. The aim of this review is to describe the biomechanical and clinical consequences of FNA, factors influencing FNA and the strengths and weaknesses of different methods used to assess FNA.

Keywords: antetorsion; hip; joint shape; proximal femur; skeletal development.


Conflict of interest statement

Matteo Scorcelletti, Neil Reeves, Jörn Rittweger and Alex Ireland declare that they have no conflict of interest.

Figures

FIGURE 1
FIGURE 1
Axial schematic representation of the right femur and of the femoral neck anteversion (FNA). The grey area represents the femoral neck and the white area represents the distal condylar region. From Cibulka (2004)
FIGURE 2
FIGURE 2
Effects of altered femoral neck anteversion (FNA) on reference moment arm length (MAL), calculated as the difference between subject‐specific model and a general model. The subject‐specific model is taken as the reference and therefore negative values indicate a higher value in subject‐specific models and vice versa. The subject‐specific model is an average of subjects with a high FNA (ranging from 25 to 51). The moment arm length is averaged over the whole range of motion (10° extension 90° flexion, 50° abduction, 20° adduction, 40° external and 40° internal rotation). Only the main function is recorded for every muscle and the internal/external rotation. Conventionally positive values are used for flexion abduction and internal rotation. Figure created using data from Scheys et al. (2008). GMaA, gluteus maximus anterior; GMaM; gluteus maximus medialis; GMaP Gluteus maximus posterior; GMeA, gluteus medius anterior; GMeM, gluteus medius medialis; GMeP, Gluteus medius posterior; GMiA, gluteus minimus anterior; GMiM, Gluteus minimus posterior; AdL, adductor longus; AdB, adductor brevis; AdMS, adductor magnus superior; AdMM, adductor magnus middle; AdMP, adductor magnus inferior; TFL, tensor fascia latae; Gra, gracilis; SemiM, semimembranosus; SemiT, semitendinosus; BiFem, biceps femoris long head; Sar, sartorius; RF, rectus femoris. Asterisks denote statistical significance:: *p < .05 and **p < .01
FIGURE 3
FIGURE 3
Epiphyseal growth plate: Radiography and computer tomography (CT) of cadaveric proximal femur of 13‐year‐old individual. Coronal view on top panels, axial view in bottom panels (Kandzierski et al., 2012)
FIGURE 4
FIGURE 4
Femoral neck anteversion (FNA) means and standard deviation of fetuses at different stages of gestation. Bottom panel shows photos of typical fetal femur samples at different developmental stages (12 weeks to term). Figures adapted from Walker and Goldsmith (1981)
FIGURE 5
FIGURE 5
Mean values and normal/pathological limits of femoral neck anteversion (described as antetorsion or AT angle) in children of different ages as measured by different investigators (Shands and Steele, 1958; Fabry et al., 1973; Tönnis and Heinecke, 1991)
FIGURE 6
FIGURE 6
Femoral neck anteversion (FNA) in children with cerebral palsy (CP) and typically developing controls during growth, presented as mean and standard deviation. Adapted from Bobroff et al., 1999 (Bobroff et al., 1999)
FIGURE 7
FIGURE 7
Top: Examples of different methods of femoral neck anteversion (FNA) assessment and how they affect the assessed geometry: A, B, C, D, E are transverse slice methods (Hernandez et al., 1981; Murphy et al., 1987; Yoshioka et al., 1987; Waidelich et al., 1992; Jarrett et al., 2010), and F and G use oblique slices (Yoshioka et al., 1987; Jarrett et al., 2010). The location of the slices in the coronal plan is shown in the lower panel. H shows that the posterior condylar line was taken as reference for all methods. Figure from Kaiser et al. (2016). Below: left, the proximal and distal part of the femur is superimposed in this picture. The lines through the neck depict different neck axes and table top condylar axes looking along the shaft axis: ‘Neck’ refers to the Berryman method (Berryman et al., 2014), a semiautomatic method taking into account the femoral head centre, the base of the femoral neck and the cluster of points of the neck. The Lee 2D (Lee et al., 2006) method uses a straight line connecting the femoral head centre and the most cephalic junction of the greater trochanter on one axial slice. The Reikeras (Reikerås et al., 1983) method uses a line connecting the centre of the femoral head on one slice and centre of the femoral neck on the slice that has the posterior and anterior edges of the neck running parallel. Murphy (Murphy et al., 1987) uses a line connecting the femoral head centre on one axial slice and the centre of the base of the neck on another axial slices. Figure from Berryman et al. (2014). Right: column 1 axial slice cranial, column 2 axial slice through the neck centre, column 3 axial slice through the base of the neck with little head left. Row A neck axis defined as centre of femoral head and centre of femoral neck. Row B neck axis defined as line connecting the two centres of the width of the neck; row C above I is the line connecting the femoral head and the greater trochanter lateral edge, and the line below is the anterior border of the femoral neck as in ultrasound methods
FIGURE 8
FIGURE 8
Different methods used to define the distal femoral axis. Method A (posterior condylar line), classical table top method, with posterior condyles lying on the table. Method B (epicondylar line), the most medial and lateral extremes of the condyles on the axial view (Weiner et al., 1978). Method C identifies the centroids of the medial and lateral condyles. Method D bisects the angle formed by the posterior and anterior condylar lines. Figure from Murphy et al. (1987)
FIGURE 9
FIGURE 9
Left panel adapted from Elke et al. (1991). Frontal view of different ultrasound approaches: the head‐trochanter line approach features the peak of the red ‘head’ section BD and the peak of the red ‘trochanter’ section AC (Upadhyay et al., 1987; Terjesen and Anda, 1987; Aamodt et al., 1995; Keppler et al., 1999). The femoral neck approach assesses the region parallel to the blue CD section (Clarac et al., 1985; Ehrenstein et al., 1999). The intertrochanteric plane approach assesses the bone parallel to the yellow GE line (Elke et al., 1991; Kulig et al., 2010; Passmore et al., 2016). Right panel: ultrasound images used to define FNA. H = femoral head, N = femoral neck, T = greater trochanter, I = intertrochanteric plane. The head‐trochanter line and parallel to the neck line can be drawn from the top right panel. The parallel to the intertrochanteric plane can be drawn from the bottom right panel. Figure from Terjesen et al. (1993)
FIGURE 10
FIGURE 10
Left: comparison of oblique magnetic resonance imaging (MRI) and computer tomography (CT) measurements of the FNA. Figure modified from Botser et al. (2012). The vertical shaded area represents the middle two quartiles of the CT measurement and the horizontal shaded area represents the middle two quartiles of the MRI measurement. The circled data point is the one with the greatest discrepancy between CT and MRI FNA values. The solid line is the line of best fit and the dashed line is the identity line. Right: comparison of CTA (computer tomography axial), CTO (computer tomography oblique), MRA (MRI axial) and MRO (MRI oblique). Note the systematic difference between MRI and CT values in the left panel. In addition the large differences occur in same specimens using the same reference axes to measure FNA but with different imaging techniques (MRI and CT). Adapted from Beebe et al. (2017)
FIGURE 11
FIGURE 11
Current methods to measure femoral neck anteversion (FNA), with short explanation of landmarks used

References

    1. Aamodt, A. , Terjesen, T. , Eine, J. and Kvistad, K. (1995) Femoral anteversion measured by ultrasound and CT: a comparative study. Skeletal Radiology, 24, 105–109. - PubMed
    1. Aird, J. , Hogg, A. and Rollinson, P. (2009) Femoral torsion in patients with Blount's disease: a previously unrecognised component. The Journal of Bone and Joint Surgery, British, 91, 1388–1393. - PubMed
    1. Alvik, I. (1962) Increased anteversion of the femur as the only manifestation of dysplasia of the hip. Clinical Orthopaedics, 22, 16–20. - PubMed
    1. Amraee, D. , Alizadeh, M. , Minoonejhad, H. , Razi, M. and Amraee, G. (2017) Predictor factors for lower extremity malalignment and non‐contact anterior cruciate ligament injuries in male athletes. Knee Surgery, Sports Traumatology, Arthroscopy, 25, 1625–1631. - PubMed
    1. Anda, S. , Terjesen, T. , Kvistad, K.A. and Svenningsen, S. (1991) Acetabular angles and femoral anteversion in dysplastic hips in adults: CT investigation. Journal of Computer Assisted Tomography, 15, 115–120. - PubMed

Publication types

MeSH terms