. 2020 Jul 2;27(1):125-136.e7.
doi: 10.1016/j.stem.2020.06.015. Epub 2020 Jun 19.

A Human Pluripotent Stem Cell-based Platform to Study SARS-CoV-2 Tropism and Model Virus Infection in Human Cells and Organoids

Affiliations

A Human Pluripotent Stem Cell-based Platform to Study SARS-CoV-2 Tropism and Model Virus Infection in Human Cells and Organoids

Liuliu Yang et al. Cell Stem Cell. .

Abstract

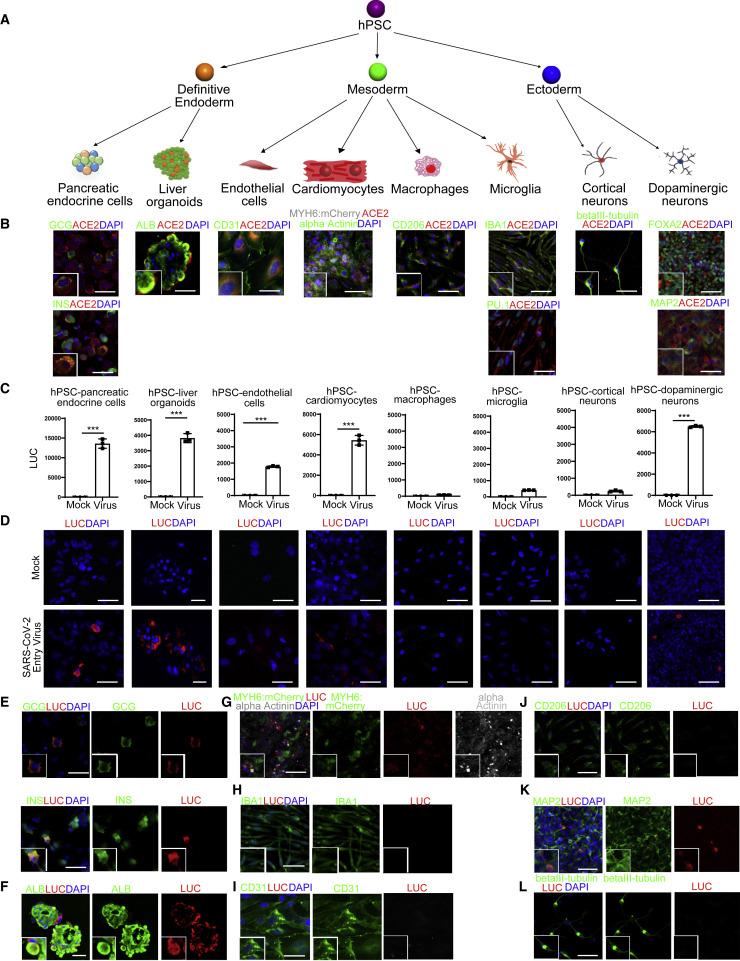
SARS-CoV-2 has caused the COVID-19 pandemic. There is an urgent need for physiological models to study SARS-CoV-2 infection using human disease-relevant cells. COVID-19 pathophysiology includes respiratory failure but involves other organ systems including gut, liver, heart, and pancreas. We present an experimental platform comprised of cell and organoid derivatives from human pluripotent stem cells (hPSCs). A Spike-enabled pseudo-entry virus infects pancreatic endocrine cells, liver organoids, cardiomyocytes, and dopaminergic neurons. Recent clinical studies show a strong association with COVID-19 and diabetes. We find that human pancreatic beta cells and liver organoids are highly permissive to SARS-CoV-2 infection, further validated using adult primary human islets and adult hepatocyte and cholangiocyte organoids. SARS-CoV-2 infection caused striking expression of chemokines, as also seen in primary human COVID-19 pulmonary autopsy samples. hPSC-derived cells/organoids provide valuable models for understanding the cellular responses of human tissues to SARS-CoV-2 infection and for disease modeling of COVID-19.

Keywords: SARS-CoV-2; alpha cells; beta cells; human pluripotent stem cells; liver organoids; pancreatic endocrine cells.


Conflict of interest statement

Declaration of Interests R.E.S. is on the scientific advisory board of Miromatrix Inc. The other authors have no conflicts of interest.

Figures

None
Graphical abstract
Figure 1
Figure 1
ACE2 Expression and Permissiveness of hPSC-Derived Cells and Organoids to SARS-CoV-2 Pseudo-entry Virus (A) Scheme of the hPSC differentiation to eight types of cells or organoids. (B) Confocal imaging of hPSC-derived cells or organoids using antibodies against ACE2 and pancreatic endocrine cell markers (INS and GCG), liver cell marker (ALB), endothelial cell marker (CD31), cardiomyocyte markers (MYH6:mCherry and alpha-Actinin), macrophage marker (CD206), microglia markers (IBA1 and PU.1), cortical neuron marker (beta-III tubulin), and dopaminergic neuron markers (FOXA2 and MAP2). Scale bar represents 25 μm. (C) Luciferase activity of eight types of hPSC-derived cells or organoids either mock or infected with SARS-CoV-2 pseudo-entry virus at 24 hpi (MOI = 0.01). n = 3 independent biological replicates. Data were presented as mean ± STDEV. p values were calculated by unpaired two-tailed Student’s t test. ∗∗∗p < 0.001. (D) Confocal imaging of eight types of hPSC-derived cells or organoids either mock or infected with SARS-CoV-2 pseudo-entry virus at 24 hpi (MOI = 0.01) for luciferase staining as a measure for pseudo-entry virus infection. Scale bar represents 25 μm. (E) Confocal imaging of hPSC-derived pancreatic endocrine cells infected with SARS-CoV-2 pseudo-entry virus using antibodies against luciferase or pancreatic endocrine cell markers, INS and GCG. Scale bar represents 10 μm. (F) Confocal imaging of hPSC-derived liver organoids infected with SARS-CoV-2 pseudo-entry virus using antibodies against luciferase or hepatocyte cell marker, ALB. Scale bar represents 50 μm. (G) Confocal imaging of hPSC-derived cardiomyocytes infected with SARS-CoV-2 pseudo-entry virus using antibodies against luciferase or cardiomyocyte markers, MYH6:mCherry and alpha-Actinin. Scale bar = 25 μm. (H) Confocal imaging of hPSC-derived microglia infected with SARS-CoV-2 pseudo-entry virus using antibodies against luciferase or microglia marker, IBA1. Scale bar represents 50 μm. (I) Confocal imaging of hPSC-derived endothelial cells infected with SARS-CoV-2 pseudo-entry virus using antibodies against luciferase and endothelial cell marker, CD31. Scale bar represents 25 μm. (J) Confocal imaging of hPSC-derived macrophages infected with SARS-CoV-2 pseudo-entry virus using antibodies against luciferase or macrophage marker, CD206. Scale bar represents 50 μm. (K) Confocal imaging of hPSC-derived dopaminergic neurons infected with SARS-CoV-2 pseudo-entry virus using antibodies against luciferase or dopaminergic neuron marker, MAP2. Scale bar represents 50 μm. (L) Confocal imaging of hPSC-derived cortical neurons infected with SARS-CoV-2 pseudo-entry virus using antibodies against luciferase or cortical neuron marker, beta-III tubulin. Scale bar represents 50 μm. See also Figures S1 and S2.
Figure 2
Figure 2
Adult Human Pancreatic Alpha and Beta Cells Express ACE2 and Are Permissive to SARS-CoV-2 Pseudo-entry Virus and SARS-CoV-2 Virus Infection (A) UMAP of adult human islets after single-cell RNA-seq. (B) UMAP of pancreatic cell markers, including PRSS1, KRT19, INS, GCG, COL1A1, PECAM1, TYROBP, SST, and PPY. (C) UMAP of ACE2 and TMPRSS2. (D) Jitter plots of ACE2 and TMPRSS2. (E) Confocal imaging of adult human islets stained with the antibodies against ACE2, INS, or GCG. Scale bar represents 10 μm. (F) Confocal imaging of adult human islets infected with SARS-CoV-2 (MOI = 0.01, 24 hpi) stained with antibodies against SARS-S, INS, or GCG. Scale bar represents 10 μm. (G) Scheme of viral inoculation in humanized mice. (H) Confocal imaging of human pancreatic endocrine xenografts with antibodies against ACE2, INS, or GCG. Scale bar represents 25 μm. (I and J) Confocal imaging (I) and quantification (J) of human pancreatic endocrine xenografts against LUC, INS, or GCG, at 24 hpi of SARS-CoV-2 pseudo-entry virus (1 × 104 PFU) infection. Scale bar represents 25 μm. n = 3 independent biological replicates. Data were presented as mean ± STDEV. p values were calculated by unpaired two-tailed Student’s t test. ∗∗∗p < 0.001. See also Figure S3.
Figure 3
Figure 3
RNA-Seq Analysis of hPSC-Derived Endocrine Cells after SARS-CoV-2 Virus Infection Reveals the Induction of Chemokine Expression, Similar to What Is Seen in Samples from Autopsies of COVID-19 Patients (A) qRT-PCR analysis of relative viral N sgRNA expression in hPSC-derived pancreatic endocrine cells infected with SARS-CoV-2 (MOI = 0.01, 0.05, 0.1) for 24 h. Viral N sgRNA levels were internally normalized to ACTB levels and different MOIs were compared relative to mock. (B and C) Confocal imaging (B) and quantification (C) of SARS-CoV-2-infected (MOI = 0.01, 24 hpi) hPSC-derived pancreatic endocrine cells stained for SARS-CoV-2 Spike protein, INS, or GCG. Scale bar represents 10 μm. (D) Read coverage of the SARS-CoV-2 genome in infected hPSC-derived pancreatic endocrine cells (MOI = 0.01, 24 hpi). Schematic denotes the SARS-CoV-2 genome. (E) PCA of differential gene expression from SARS-CoV-2-infected hPSC-derived pancreatic endocrine cells compared to mock infection. (F) KEGG gene set enrichment analysis of differential gene expression profiles from SARS-CoV-2-infected hPSC-derived pancreatic endocrine cells compared to mock infection. (G) Volcano plot analysis of differentially expressed genes from lung autopsies of healthy donors compared to COVID-19 patients. Individual genes denoted by gene name. Differentially expressed genes (p-adjusted value < 0.05) with a log2 (Fold Change) > 2 are indicated in red. Non-significant differentially expressed genes with a log2 (Fold Change) > 2 are indicated in green. (H) Heatmap of chemokine transcript levels in SARS-CoV-2-infected hPSC-derived pancreatic endocrine cell cells compared to mock infection. n = 3 independent biological replicates. Data were presented as mean ± SD. p values were calculated by unpaired two-tailed Student’s t test. ∗∗∗p < 0.001. See also Table S1.
Figure 4
Figure 4
Adult Hepatocyte and Cholangiocyte Organoids Are Permissive to SARS-CoV-2 Virus Infection and Show a Similar Chemokine Response Compared to Autopsy Samples from COVID-19 Patients (A) qRT-PCR analysis of relative viral N sgRNA expression in adult human hepatocyte organoids infected with SARS-CoV-2 (MOI = 0.1) for 24 h. Viral N sgRNA levels were internally normalized to ACTB levels and depicted relative to mock. (B and C) Confocal imaging (B) and quantification (C) of adult human hepatocyte organoids at 24 hpi of SARS-CoV-2 virus infection (MOI = 0.1). Scale bar represents 50 μm. (D) qRT-PCR analysis of relative viral N sgRNA expression in adult human cholangiocyte organoids infected with SARS-CoV-2 (MOI = 0.1) for 24 h. Viral N sgRNA levels were internally normalized to ACTB levels and depicted relative to mock. (E and F) Confocal imaging (E) and quantification (F) of human cholangiocyte organoids at 24 hpi of SARS-CoV-2 virus infection (MOI = 0.1). Scale bar represents 50 μm. (G) Read coverage of the SARS-CoV-2 genome in infected human hepatocyte organoids at 24 hpi of SARS-CoV-2 virus infection (MOI = 0.1). Schematic denotes the SARS-CoV-2 genome. (H) Read coverage of the SARS-CoV-2 genome in infected adult human cholangiocyte organoids (donor 1 and donor 2) at 24 hpi of SARS-CoV-2 virus infection (MOI = 0.1). Schematic denotes the SARS-CoV-2 genome. (I and J) PCA (I) and volcano plot (J) analysis of differential expressed genes in SARS-CoV-2-infected human hepatocyte organoids compared to mock infection. Individual genes denoted by gene name. Differentially expressed genes (p-adjusted value < 0.05) with a log2 (Fold Change) > 2 are indicated in red. Non-significant differentially expressed genes with a log2 (Fold Change) > 2 are indicated in green. (K) KEGG gene set enrichment analysis of transcript profiles from SARS-CoV-2-infected human hepatocyte organoids compared to mock infection. (L and M) PCA (L) and volcano plot (M) analysis of differential expressed genes in SARS-CoV-2-infected adult human cholangiocyte organoids (donor 1) compared to mock infection. Individual genes denoted by gene name. (N) KEGG gene set enrichment analysis of transcripts from SARS-CoV-2-infected adult human cholangiocyte organoids (donor 1) compared to mock infection. n = 3 independent biological replicates. Data were presented as mean ± SD. p values were calculated by unpaired two-tailed Student’s t test. p < 0.05, ∗∗∗p < 0.001. See also Figure S4 and Table S1.

Comment in

Similar articles

Cited by

References

    1. Anagandula M., Richardson S.J., Oberste M.S., Sioofy-Khojine A.B., Hyöty H., Morgan N.G., Korsgren O., Frisk G. Infection of human islets of Langerhans with two strains of Coxsackie B virus serotype 1: assessment of virus replication, degree of cell death and induction of genes involved in the innate immunity pathway. J. Med. Virol. 2014;86:1402–1411. - PubMed
    1. Blanco-Melo D., Nilsson-Payant B.E., Liu W.C., Uhl S., Hoagland D., Møller R., Jordan T.X., Oishi K., Panis M., Sachs D. Imbalanced Host Response to SARS-CoV-2 Drives Development of COVID-19. Cell. 2020;181:1036–1045.e9. - PMC - PubMed
    1. Bornstein S.R., Rubino F., Khunti K., Mingrone G., Hopkins D., Birkenfeld A.L., Boehm B., Amiel S., Holt R.I., Skyler J.S. Practical recommendations for the management of diabetes in patients with COVID-19. Lancet Diabetes Endocrinol. 2020;8:546–550. - PMC - PubMed
    1. Butler A., Hoffman P., Smibert P., Papalexi E., Satija R. Integrating single-cell transcriptomic data across different conditions, technologies, and species. Nat. Biotechnol. 2018;36:411–420. - PMC - PubMed
    1. Cao X., Yakala G.K., van den Hil F.E., Cochrane A., Mummery C.L., Orlova V.V. Differentiation and Functional Comparison of Monocytes and Macrophages from hiPSCs with Peripheral Blood Derivatives. Stem Cell Reports. 2019;12:1282–1297. - PMC - PubMed

Publication types

MeSH terms