

Impact of Intraocular Pressure Control on Rates of Retinal Nerve Fiber Layer Loss in a Large Clinical Population
- PMID: 32579892
- PMCID: PMC7750282
- DOI: 10.1016/j.ophtha.2020.06.027
Impact of Intraocular Pressure Control on Rates of Retinal Nerve Fiber Layer Loss in a Large Clinical Population
Abstract
Purpose: To investigate the impact of intraocular pressure (IOP) control on rates of change of spectral-domain OCT (SD-OCT) retinal nerve fiber layer (RNFL) thickness in a large clinical population.
Design: Retrospective cohort study.
Participants: A total of 85 835 IOP measurements and 60 223 SD-OCT tests from 14 790 eyes of 7844 patients.
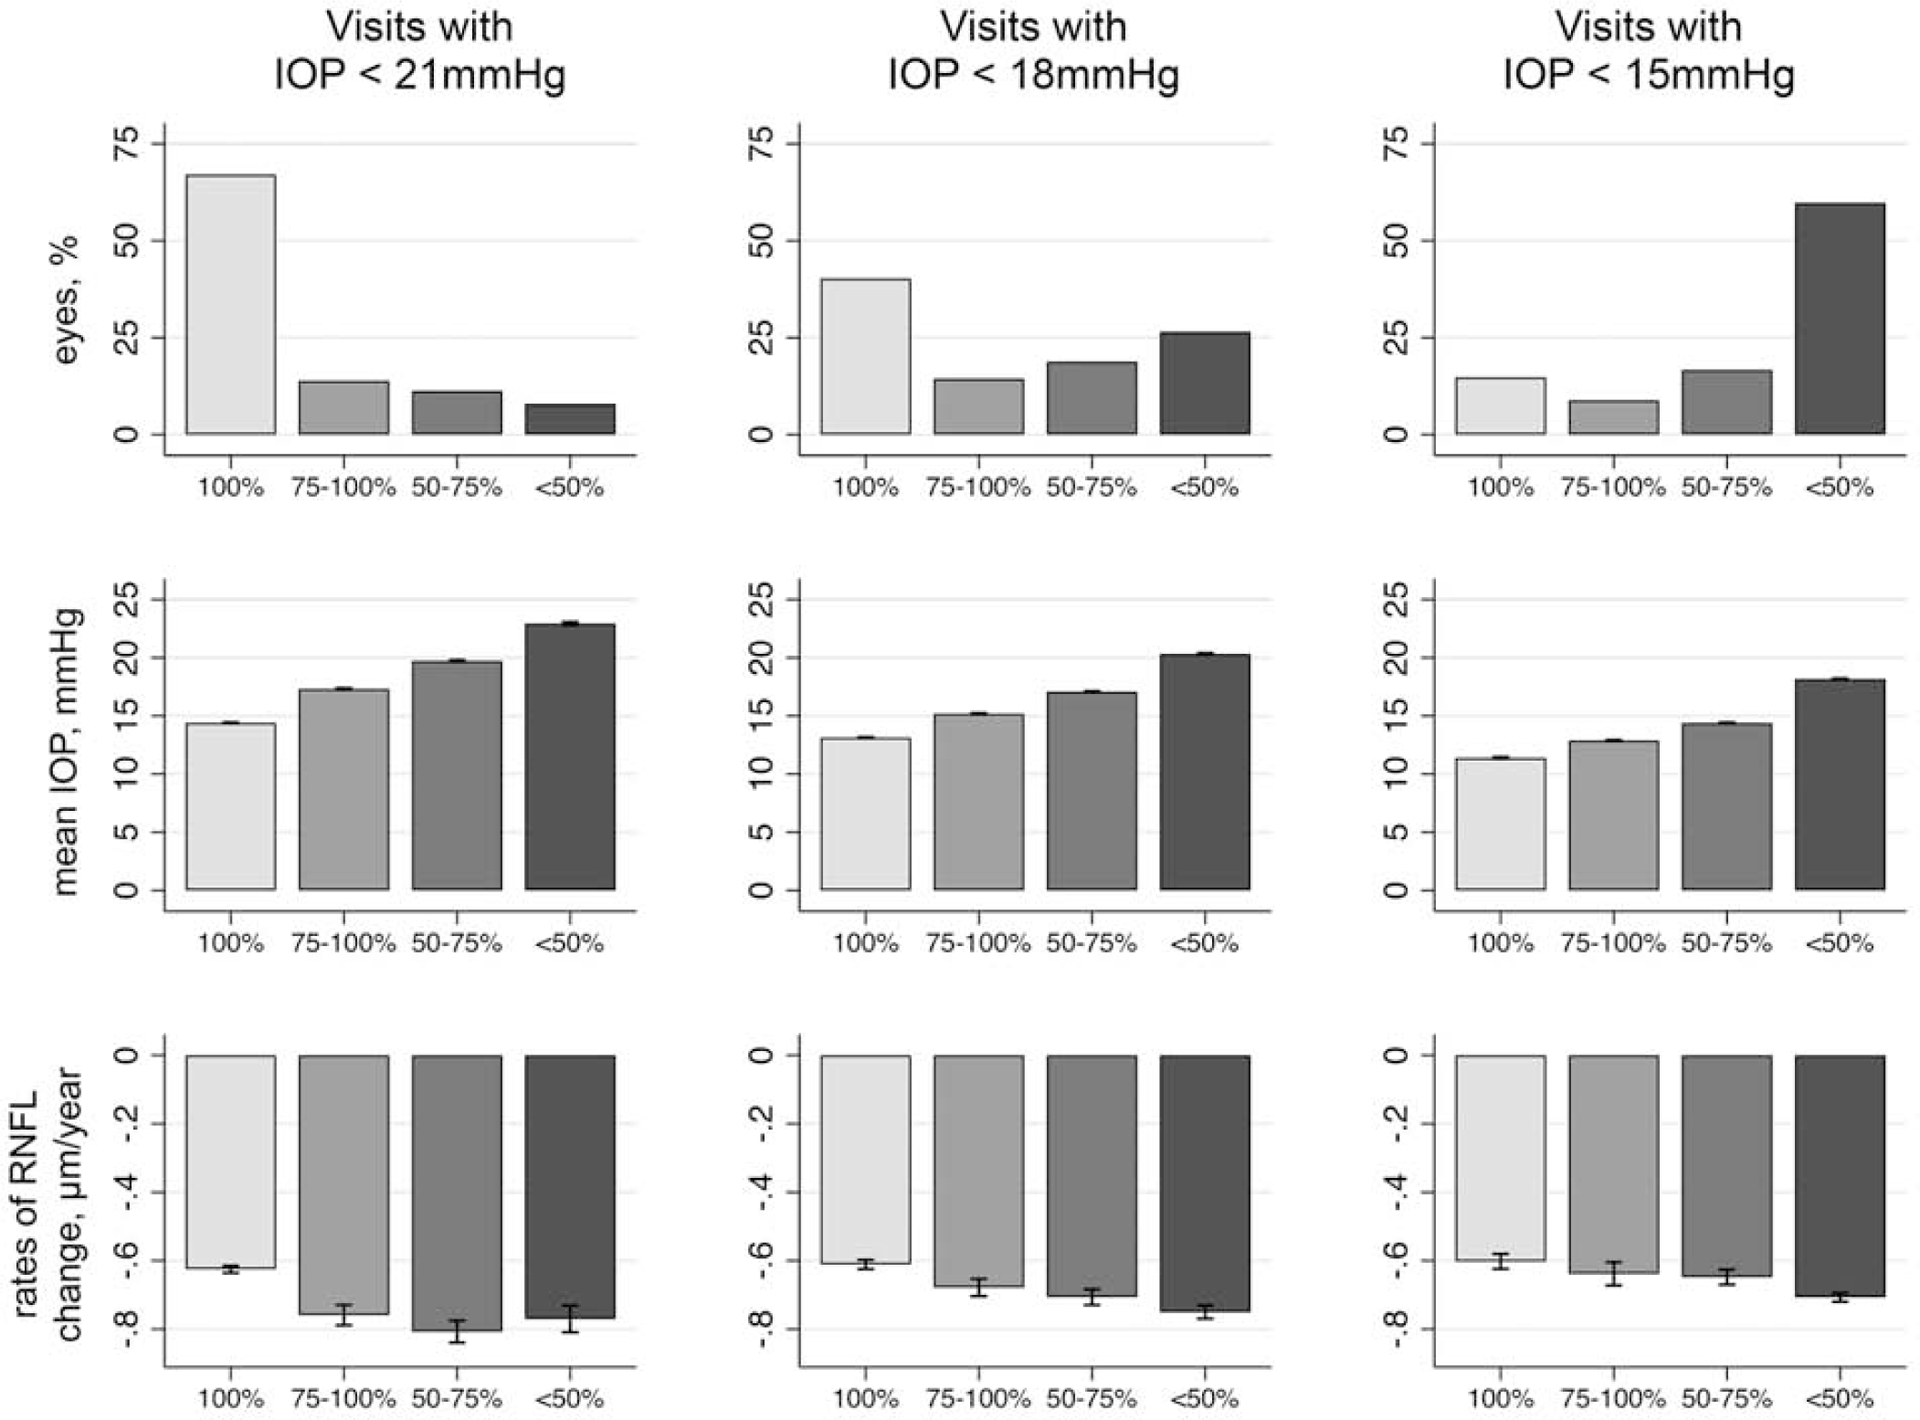
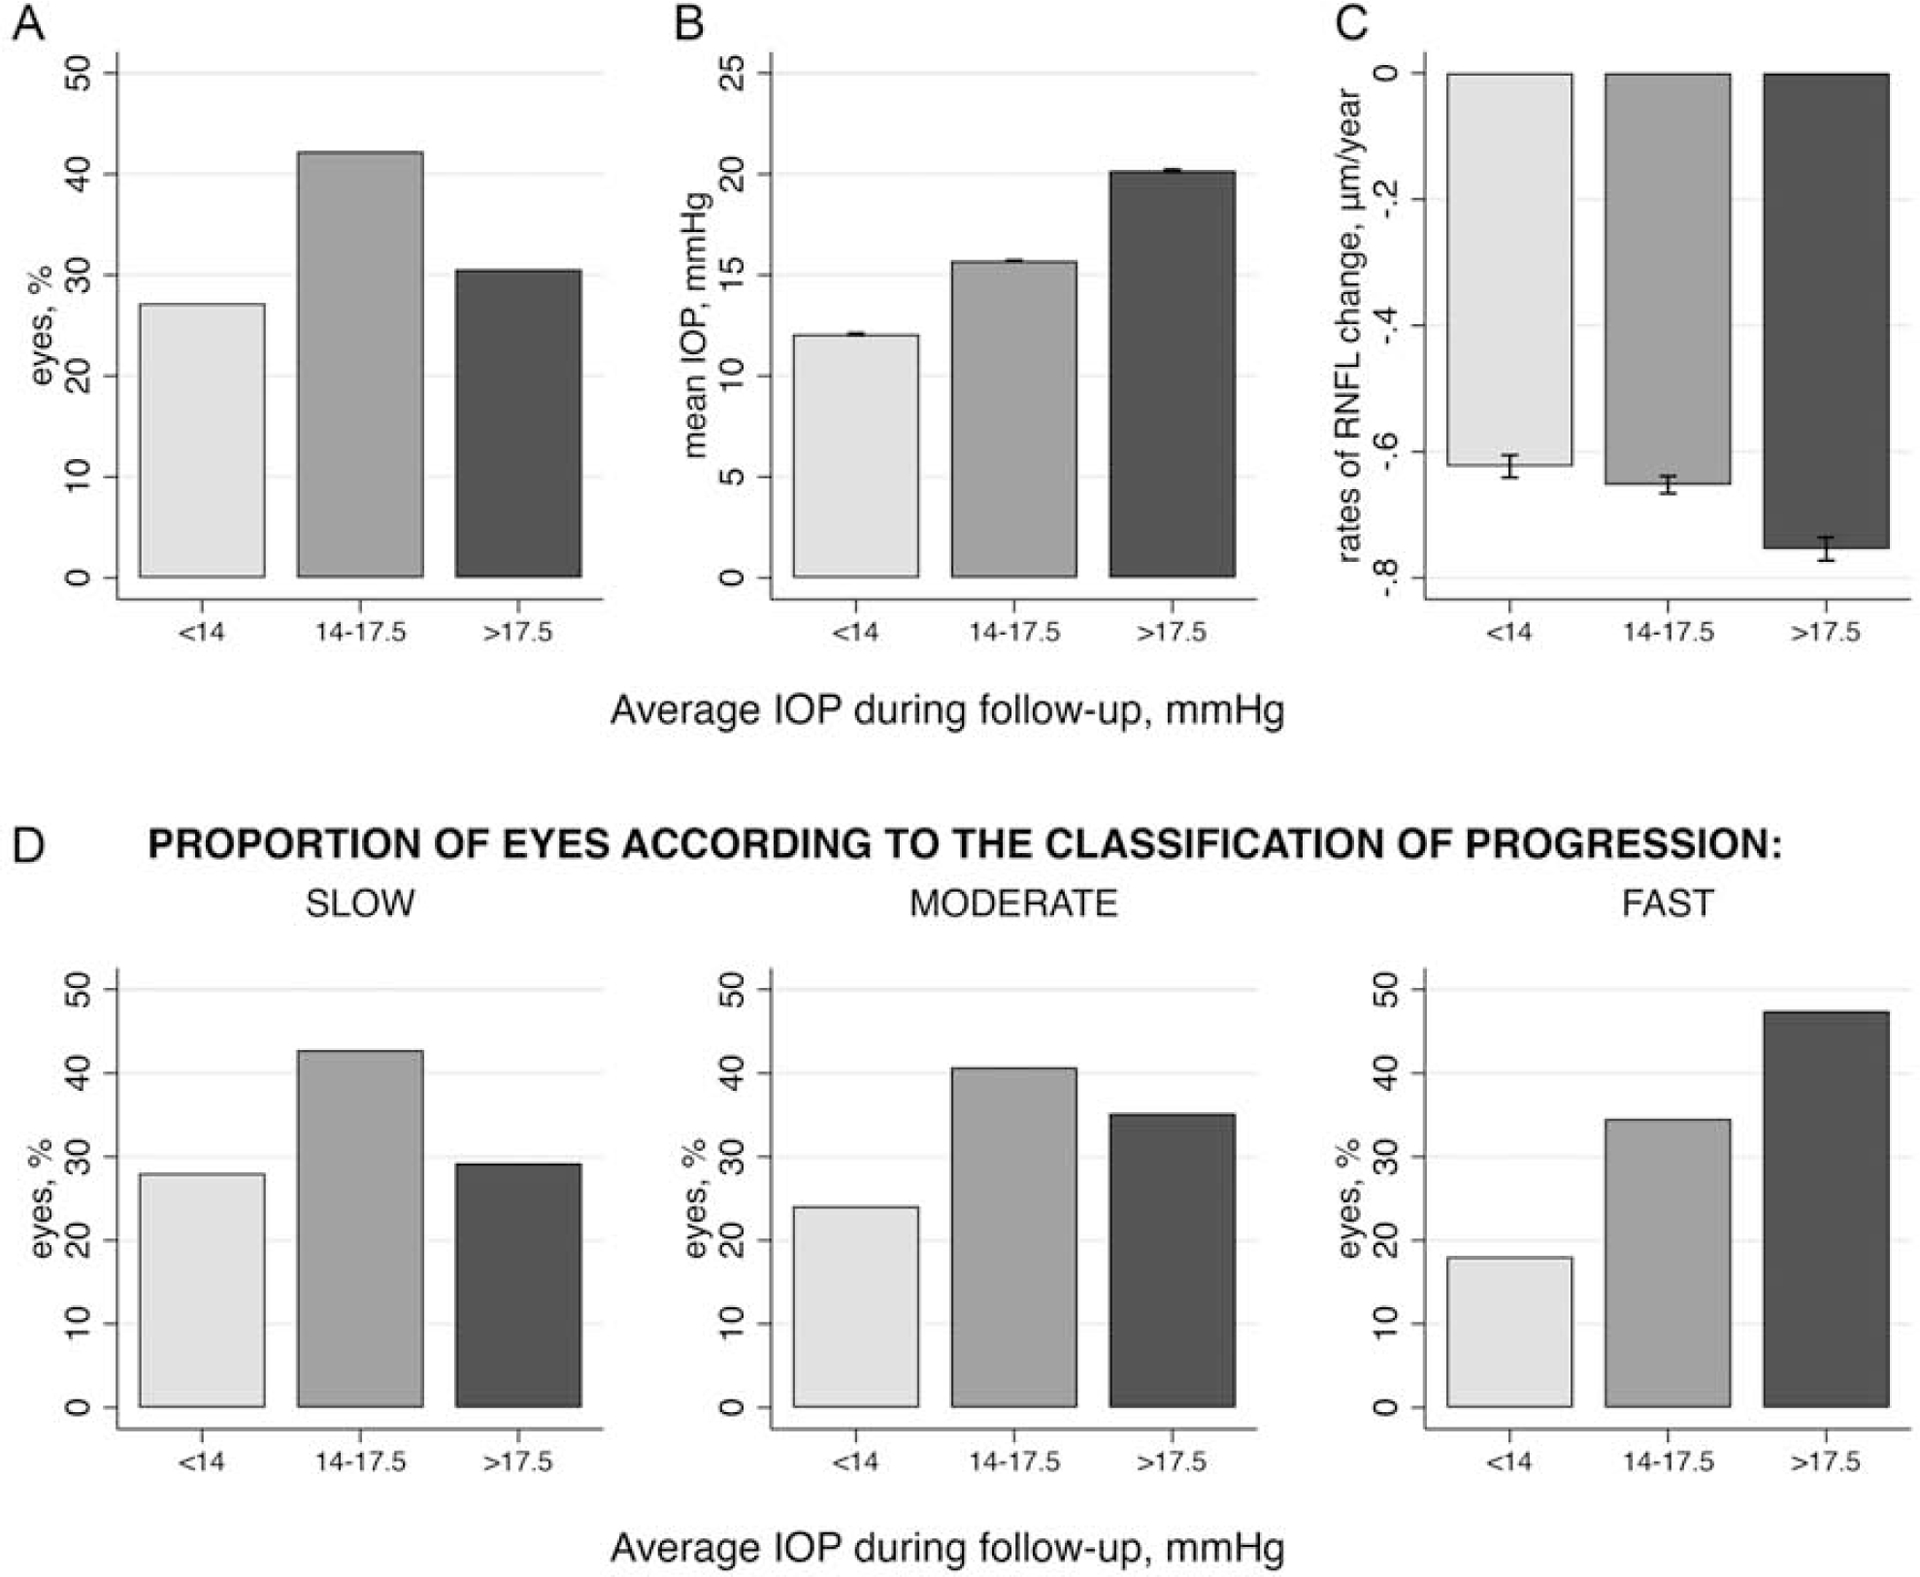
Methods: Data were extracted from the Duke Glaucoma Registry, a large database of electronic medical records of patients with glaucoma and suspected disease followed over time at the Duke Eye Center and satellite clinics. All records from patients with a minimum of 6 months of follow-up and at least 2 good-quality SD-OCT scans and 2 clinical visits with Goldmann applanation tonometry were included. Eyes were categorized according to the frequency of visits with IOP below cutoffs of 21 mmHg, 18 mmHg, and 15 mmHg over time. Rates of change for global RNFL thickness were obtained using linear mixed models and classified as slow if change was slower than -1.0 μm/year; moderate if between -1.0 and -2.0 μm/year; and fast if faster than -2.0 μm/year. Multivariable models were adjusted for age, gender, race, diagnosis, central corneal thickness, follow-up time, and baseline disease severity.
Main outcome measures: Rates of change in SD-OCT RNFL thickness according to levels of IOP control.
Results: Eyes had a mean follow-up of 3.5±1.9 years. Average rate of change in RNFL thickness was -0.68±0.59 μm/year. Each 1 mmHg higher mean IOP was associated with 0.05 μm/year faster RNFL loss (P < 0.001) after adjustment for potentially confounding variables. For eyes that had fast progression, 41% of them had IOP <21 mmHg in all visits during follow-up, whereas 20% of them had all visits with IOP <18 mmHg, but only 9% of them had all visits with IOP <15 mmHg.
Conclusions: Intraocular pressure was significantly associated with rates of progressive RNFL loss in a large clinical population. Eyes with stricter IOP control over follow-up visits had a smaller chance of exhibiting fast deterioration. Our findings may assist clinicians in establishing target pressures in clinical practice.
Copyright © 2020 American Academy of Ophthalmology. Published by Elsevier Inc. All rights reserved.
Figures

References
-
- Mariotti SP. Global Data on Vision Impairments 2010 Bull World Health Organ. Switzerland: World Health Organization, 2012.
-
- Leske MC, Heijl A, Hyman L, et al. Predictors of long-term progression in the early manifest glaucoma trial. Ophthalmology 2007;114(11):1965–72. - PubMed
-
- Gordon MO, Beiser JA, Brandt JD, et al. The Ocular Hypertension Treatment Study: baseline factors that predict the onset of primary open-angle glaucoma. Arch Ophthalmol 2002;120(6):714–20; discussion 829–30. - PubMed
-
- European Glaucoma Prevention Study G, Miglior S, Pfeiffer N, et al. Predictive factors for open-angle glaucoma among patients with ocular hypertension in the European Glaucoma Prevention Study. Ophthalmology 2007;114(1):3–9. - PubMed
-
- The Advanced Glaucoma Intervention Study (AGIS): 7. The relationship between control of intraocular pressure and visual field deterioration.The AGIS Investigators. Am J Ophthalmol 2000;130(4):429–40. - PubMed
Publication types
MeSH terms
Grants and funding
LinkOut - more resources
Full Text Sources
Other Literature Sources
Medical
