. 2020 Jun 23;31(12):107806.
doi: 10.1016/j.celrep.2020.107806.

mTOR Signaling and SREBP Activity Increase FADS2 Expression and Can Activate Sapienate Biosynthesis

Affiliations

mTOR Signaling and SREBP Activity Increase FADS2 Expression and Can Activate Sapienate Biosynthesis

Mouna Triki et al. Cell Rep. .

Abstract

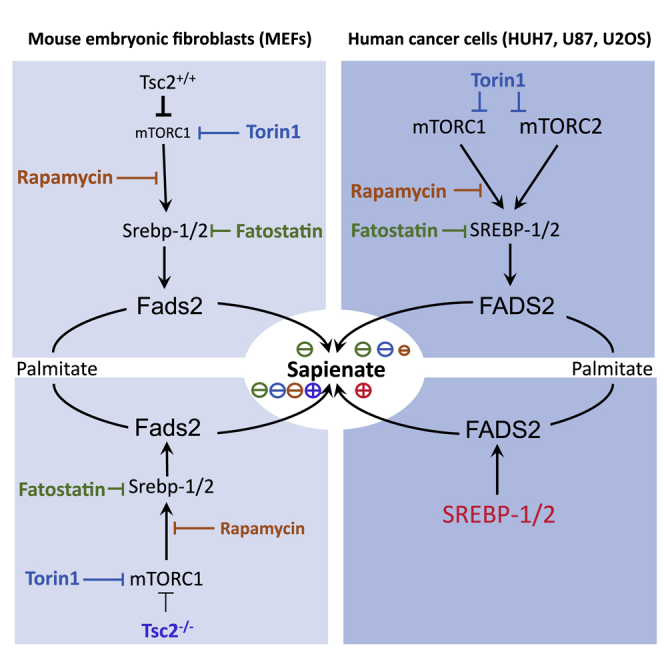
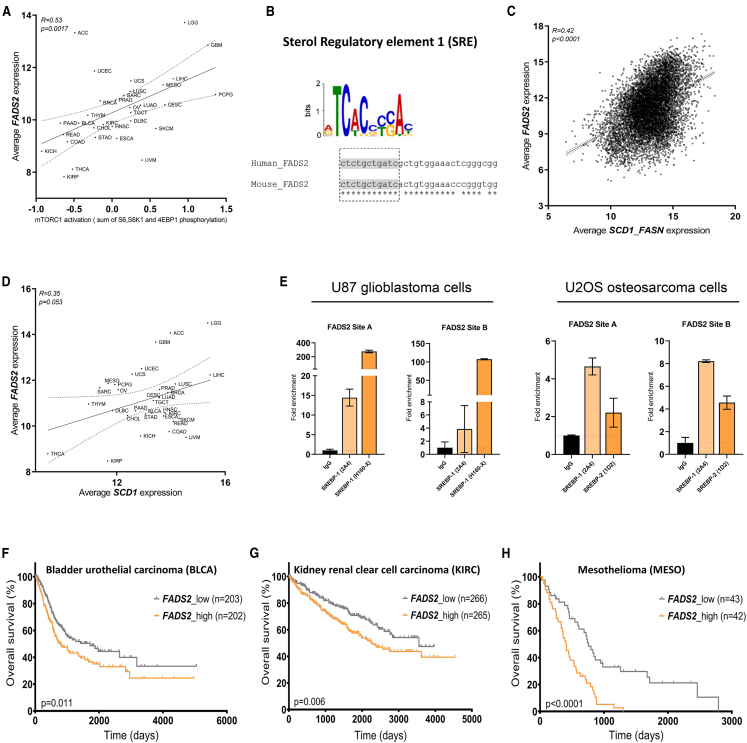
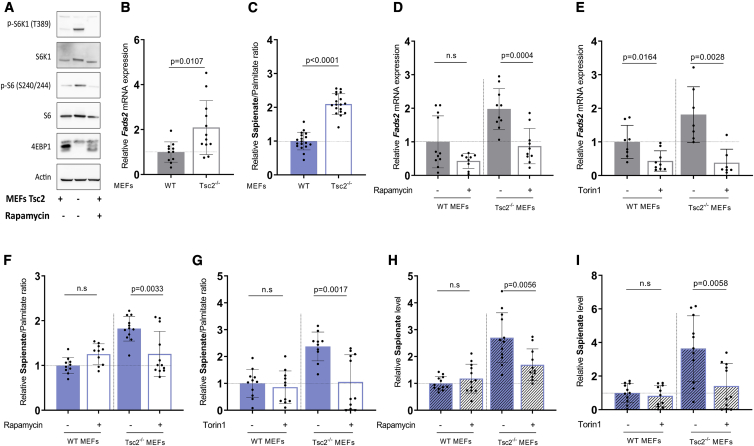
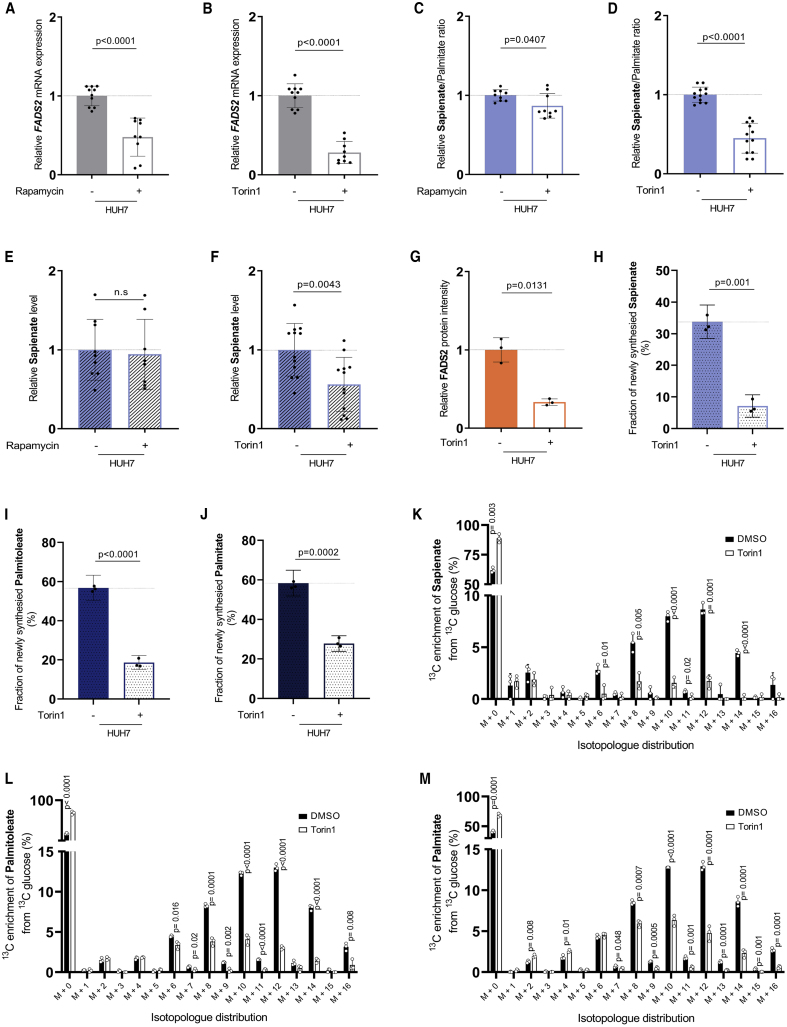
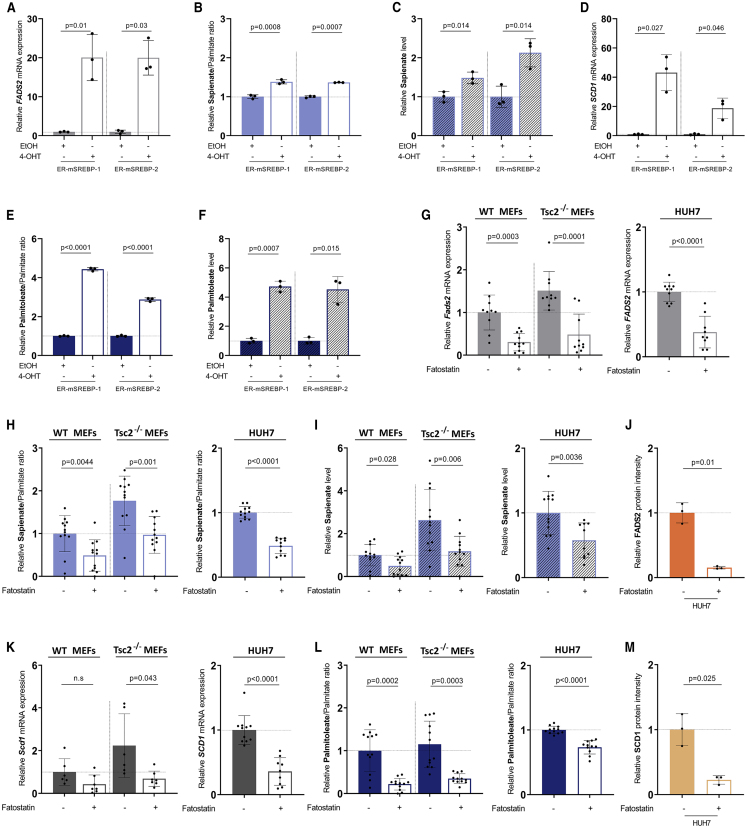
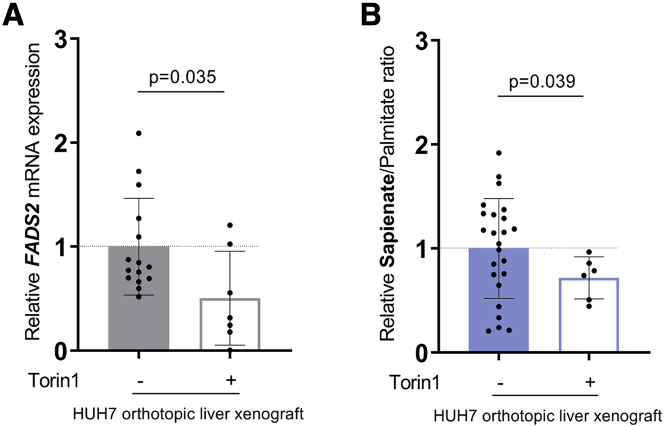
Cancer cells display an increased plasticity in their lipid metabolism, which includes the conversion of palmitate to sapienate via the enzyme fatty acid desaturase 2 (FADS2). We find that FADS2 expression correlates with mammalian target of rapamycin (mTOR) signaling and sterol regulatory element-binding protein 1 (SREBP-1) activity across multiple cancer types and is prognostic in some cancer types. Accordingly, activating mTOR signaling by deleting tuberous sclerosis complex 2 (Tsc2) or overexpression of SREBP-1/2 is sufficient to increase FADS2 mRNA expression and sapienate metabolism in mouse embryonic fibroblasts (MEFs) and U87 glioblastoma cells, respectively. Conversely, inhibiting mTOR signaling decreases FADS2 expression and sapienate biosynthesis in MEFs with Tsc2 deletion, HUH7 hepatocellular carcinoma cells, and orthotopic HUH7 liver xenografts. In conclusion, we show that mTOR signaling and SREBP activity are sufficient to activate sapienate metabolism by increasing FADS2 expression. Consequently, targeting mTOR signaling can reduce sapienate metabolism in vivo.

Keywords: FADS2; SCD1; SREBP; cancer; fatty acid metabolism; glioblastoma; hepatocellular carcinoma; mTOR; palmitate; palmitoleate; sapienate.


Conflict of interest statement

Declaration of Interests S.-M.F. has received funding from Bayer, Merck, and Black Belt Therapeutics and has consulted for Funds+.

Figures

None
Graphical abstract
Figure 1
Figure 1
FADS2 mRNA Expression Correlates with mTORC1 Signaling and SREBP-1 Activity and Has Prognostic Value (A) Correlation between FADS2 mRNA expression and mTOR activity in 7,407 human cancers representing 32 different cancer type. Reverse-phase protein array (RPPA) profiles were scored for an mTOR pathway signature, defined as the sum of phosphoprotein levels of mTOR, 4E-BP1 (S65, T37/T46, and T70 RPPA features), P70S6K, and S6 (S235/S236 and S240/S244 features). Trend line (dashed line) and 95% confidence intervals (dotted lines) are depicted. (B) Conserved regions for the sterol regulatory element 1 (SRE) consensus sequence in human and mouse FADS2 promoter region are highlighted in gray, while identical nucleotides are indicated with asterisks. (C) Correlation between FADS2 mRNA expression and SREBP-1 targets (SCD1 and FASN) across 9,185 human cancers representing 32 major tumor types. Trend line (dashed line) and 95% confidence intervals (dotted lines) are depicted. (D) Correlation between FADS2 and SCD1 mRNA expression in 9,185 human cancers representing 32 major tumor types. Trend line (dashed line) and 95% confidence intervals (dotted lines) are depicted. (E) ChIP-qPCR assay using anti-SREBP-1 and anti-SREBP-2 antibodies to detect enriched gene-promoter fragments of FADS2 in U87 (left panel) and U2OS (right panel) cancer cells. IgG was used as ChIP control. Values represent relative increase of real-time PCR signals compared with the signal of IgG ChIP. Three technical triplicates are presented as mean ± SD. (F) Kaplan-Meier survival curves based on low (gray curve) or high (orange curve) mRNA expression of FADS2 in bladder urothelial carcinoma (BLCA), kidney renal cell carcinoma (KIRC) and mesothelioma (MESO). Significance for differential overall survival of the two groups was assessed with the Mantel-Haenszel test. ACC, adrenocortical carcinoma; BLCA, bladder urothelial carcinoma; BRCA, breast invasive carcinoma; CESC, cervical squamous cell carcinoma and endocervical adenocarcinoma; CHOL, cholangiocarcinoma; COAD, colon adenocarcinoma; DLBC, lymphoid neoplasm diffuse large B cell lymphoma; ESCA, esophageal carcinoma; GBM, glioblastoma multiforme; HNSC, head and neck squamous cell carcinoma; KICH, kidney chromophobe; KIRC, kidney renal clear cell carcinoma; KIRP, kidney renal papillary cell carcinoma; LAML, acute myeloid leukemia; LGG, brain lower-grade glioma; LIHC, liver hepatocellular carcinoma; LUAD, lung adenocarcinoma; LUSC, lung squamous cell carcinoma; MESO, mesothelioma; OV, ovarian serous cystadenocarcinoma; PAAD, pancreatic adenocarcinoma; PCPG, pheochromocytoma and paraganglioma; PRAD, prostate adenocarcinoma; READ, rectum adenocarcinoma; SARC, sarcoma; SKCM, skin cutaneous melanoma; STAD, stomach adenocarcinoma; TGCT, testicular germ cell tumors; THCA, thyroid carcinoma; THYM, thymoma; UCEC, uterine corpus endometrial carcinoma; UCS, uterine carcinosarcoma; UVM, uveal melanoma.
Figure 2
Figure 2
mTOR Can Regulate Fads2 Expression and Sapienate Metabolism (A) Representative western blot of mTORC1 activity in wild-type (WT) and Tsc2−/− MEFs. mTORC1 activity was analyzed by immunoblotting with the indicated antibodies. (B) Relative Fads2 mRNA expression in WT (n = 11) and Tsc2−/− (n = 12) MEFs based on qRT-PCR. Bar graphs are presented as mean ± SD from biological independent samples. Statistical testing was performed by a two-sided unpaired Student’s t test. (C) Relative sapienate to palmitate ratio in WT and Tsc2−/− MEFs based on mass spectrometry analysis. n = 18. Bar graphs are presented as mean ± SD from biological independent samples. Statistical testing was performed by a two-sided unpaired Student’s t test. (D and E) Relative Fads2 mRNA expression in WT and Tsc2−/− MEFs upon treatment with DMSO (D: WT n = 11, Tsc2−/− n = 10; E: WT n = 8, Tsc2−/− n = 7), rapamycin (D) (20 nM, 72 h, WT n = 9, Tsc2−/− n = 10), or Torin1 (E) (40 nM, 72 h, WT n = 9, Tsc2−/− n = 7). Bar graphs are presented as mean ± SD from biological independent samples. Statistical testing was performed by a two-sided unpaired Student’s t test. (F and G) Sapienate to palmitate ratio in WT and Tsc2−/− MEFs upon treatment with DMSO (F: WT N = 11, Tsc2−/− n = 12; G: WT n = 11, Tsc2−/− n = 10), rapamycin (F) (20 nM, 72 h, WT n = 10, Tsc2−/− n = 12), or Torin1 (G) (40 nM, 72 h, WT n = 11, Tsc2−/− n = 11). Bar graphs are presented as mean ± SD from biological independent samples. Statistical testing was performed by a two-sided unpaired Student’s t test. (H and I) Relative sapienate level in WT and Tsc2−/− MEFs upon treatment with DMSO (H: n = 12; I: n = 11), rapamycin (H) (20 nM, 72 h, n = 12), or Torin1 (I) (40 nM, 72 h, n = 11). Bar graphs are presented as mean ± SD from biological independent samples. Statistical testing was performed by a two-sided unpaired Student’s t test.
Figure 3
Figure 3
Inhibition of mTOR Reduces FADS2 Transcription, Protein Expression, and Sapienate Metabolism (A and B) Relative FADS2 mRNA expression upon treatment with DMSO (n = 10), rapamycin (A) (20 nM, 72 h, n = 9), or Torin1 (B) (40 nM, 72 h, n = 9) in HUH7 cells. Bar graphs are presented as mean ± SD from biological independent samples. Statistical testing was performed by a two-sided unpaired Student’s t test. (C and D) Sapienate to palmitate ratio upon treatment with DMSO (C: n = 9; D: n = 12), rapamycin (C) (20 nM, 72 h, n = 9), or Torin1 (D) (40 nM, 72 h, n = 12) in HUH7 cells. Bar graphs are presented as mean ± SD from biological independent samples. Statistical testing was performed by a two-sided unpaired Student’s t test. (E and F) Relative sapienate level upon treatment with DMSO (E: n = 9; F: n = 12), rapamycin (E) (20 nM, 72 h, n = 9), or Torin1 (F) (40 nM, 72 h, n = 12) in HUH7 cells. Bar graphs are presented as mean ± SD from biological independent samples. Statistical testing was performed by a two-sided unpaired Student’s t test. (G) Relative FADS2 protein expression upon treatment with DMSO or Torin1 (40 nM, 72 h, n = 3) in HUH7 cells. Bar graphs are presented as mean ± SD from biological independent samples. Statistical testing was performed by a two-sided unpaired Student’s t test. (H–J) Fraction of newly synthesized sapienate (H), palmitoleate (I), and palmitate (J) based on isotopomer spectral analysis in the HUH7 cultured in the presence of DMSO or Torin1 with 13C6 glucose. Cells were grown in DMEM (4.5 g/L glucose, 10% FBS), after which cells were grown for 72 h in 10% dialyzed FBS DMEM containing 4.5 g/L 13C6 glucose supplemented with DMSO or 40 nM Torin1 (n = 3). Bar graphs are presented as lower and upper 95% confidence intervals. Statistical testing was performed by a two-sided unpaired Student’s t test. (K–M) 13C6 glucose incorporation into sapienate (K), palmitoleate (L), and palmitate (M) in HUH7 in control condition (DMSO, black) or upon Torin1 treatment (white). Cells were grown in DMEM (4.5 g/L glucose, 10% FBS) after which cells were grown for 72 h in 10% dialyzed FBS DMEM containing 4.5 g/ L 13C6 glucose supplemented with DMSO or 40 nM Torin1 (n = 3). Bar graphs are presented as mean ± SD from biological independent samples. Statistical testing was performed by a two-sided unpaired Student’s t test.
Figure 4
Figure 4
Modulation of SREBP Alters FADS2 Transcription and Sapienate Metabolism (A and D) Relative FADS2 (A) and SCD1 (D) mRNA expression relative to actin beta (ACTB) was determined in U87 cells stably expressing ER-mSREBP-1 or ER-mSREBP-2. Cells were treated with 100 nM 4-OHT or solvent for 24 h in medium containing 10% FBS (n = 3). Bar graphs are presented as mean ± SD from biological independent samples. Statistical testing was performed by a two-sided unpaired Student’s t test. (B and E) Sapienate to palmitate ratio (B) and palmitoleate to palmitate ratio (E) were determined in U87 cells stably expressing ER-mSREBP-1 or ER-mSREBP-2. Cells were treated with 100 nM 4-OHT or solvent for 24 h in medium containing 10% FBS (n = 3). Bar graphs are presented as mean ± SD from biological independent samples. Statistical testing was performed by a two-sided unpaired Student’s t test. (C and F) Relative sapienate (C) and palmitoleate (F) levels in U87 cells stably expressing ER-mSREBP-1 or ER-mSREBP-2 (n = 3). Bar graphs are presented as mean ± SD from biological independent samples. Statistical testing was performed by a two-sided unpaired Student’s t test. (G) Relative FADS2 mRNA expression upon treatment with DMSO (n = 10) or fatostatin (10 μM, 72 h, WT n = 11, Tsc2−/− n = 10, HUH7 n = 9) in WT and Tsc2−/− MEFs or HUH7 cancer cells. Bar graphs are presented as mean ± SD from biological independent samples. Statistical testing was performed by a two-sided unpaired Student’s t test. (H) Sapienate to palmitate ratio upon treatment with DMSO (n = 12) or fatostatin (10 μM, 72 h, MEFs n = 12, HUH7 n = 11) in WT and Tsc2−/− MEFs or HUH7 cancer cells. Bar graphs are presented as mean ± SD from biological independent samples. Statistical testing was performed by a two-sided unpaired Student’s t test. (I) Relative sapienate level upon treatment with DMSO (n = 12) or fatostatin (10 μM, 72 h, MEFs n = 12, HUH7 n = 11) in WT and Tsc2−/− MEFs or HUH7 cancer cells. Bar graphs are presented as mean ± SD from biological independent samples. Statistical testing was performed by a two-sided unpaired Student’s t test. (J and M) Relative FADS2 (J) and SCD1 (M) protein expression upon treatment with DMSO or fatostatin (10 μM, 72 h, n = 3) in HUH7 cancer cells. Bar graphs are presented as mean ± SD from biological independent samples. Statistical testing was performed by a two-sided unpaired Student’s t test. (K) Relative SCD1 mRNA expression in WT and Tsc2−/− MEFs or HUH7 cancer cells upon treatment with DMSO (MEFs n = 6, HUH7 n = 11) or fatostatin (10 μM, 72 h, MEFs n = 7, HUH7 n = 9). Bar graphs are presented as mean ± SD from biological independent samples. Statistical testing was performed by a two-sided unpaired Student’s t test. (L) Palmitoleate to palmitate ratio in WT and Tsc2−/− MEFs or in HUH7 cancer cells upon treatment with DMSO (n = 12) or fatostatin (10 μM, 72 h, MEFs n = 12, HUH7 n = 11). Bar graphs are presented as mean ± SD from biological independent samples. Statistical testing was performed by a two-sided unpaired Student’s t test.
Figure 5
Figure 5
mTOR Inhibition Decreases Sapienate Metabolism In Vivo (A) Relative FADS2 mRNA expression in HUH7 orthotopic liver xenografts treated with vehicle (n = 15) or Torin1 (20 mg/kg daily, i.p., for 3 days; n = 7) normalized to control tumor. Treatment was started 10 days after tumor initiation. The mice were sacrificed 2 h after the last dose of Torin1. Bar graphs are presented as mean ± SD from biological independent samples. Statistical testing was performed by a two-sided unpaired Student’s t test. (B) Sapienate to palmitate ratio in HUH7 orthotopic liver xenografts treated with vehicle (n = 24) or Torin1 (20 mg/kg daily, i.p., for 3 days; n = 6) normalized to control tumor. Treatment was started 10 days after tumor initiation. The mice were sacrificed 2 h after the last dose of Torin1. Bar graphs are presented as mean ± SD from biological independent samples. Statistical testing was performed by a two-sided unpaired Student’s t test.

References

    1. Baluapuri A., Hofstetter J., Dudvarski Stankovic N., Endres T., Bhandare P., Vos S.M., Adhikari B., Schwarz J.D., Narain A., Vogt M. MYC recruits SPT5 to RNA polymerase II to promote processive transcription elongation. Mol. Cell. 2019;74:674–687.e11. - PMC - PubMed
    1. Ben-Sahra I., Manning B.D. mTORC1 signaling and the metabolic control of cell growth. Curr. Opin. Cell Biol. 2017;45:72–82. - PMC - PubMed
    1. Buescher J.M., Antoniewicz M.R., Boros L.G., Burgess S.C., Brunengraber H., Clish C.B., DeBerardinis R.J., Feron O., Frezza C., Ghesquiere B. A roadmap for interpreting (13)C metabolite labeling patterns from cells. Curr. Opin. Biotechnol. 2015;34:189–201. - PMC - PubMed
    1. Cheng X., Li J., Guo D. SCAP/SREBPs are central players in lipid metabolism and novel metabolic targets in cancer therapy. Curr. Top. Med. Chem. 2018;18:484–493. - PMC - PubMed
    1. Cho H.P., Nakamura M.T., Clarke S.D. Cloning, expression, and nutritional regulation of the mammalian Δ-6 desaturase. J. Biol. Chem. 1999;274:471–477. - PubMed

Publication types

MeSH terms