

Combining imaging- and gene-based hypoxia biomarkers in cervical cancer improves prediction of chemoradiotherapy failure independent of intratumour heterogeneity
- PMID: 32580139
- PMCID: PMC7317686
- DOI: 10.1016/j.ebiom.2020.102841
Combining imaging- and gene-based hypoxia biomarkers in cervical cancer improves prediction of chemoradiotherapy failure independent of intratumour heterogeneity
Abstract
Background: Emerging biomarkers from medical imaging or molecular characterization of tumour biopsies open up for combining the two and exploiting their synergy in treatment planning of cancer patients. We generated a paired data set of imaging- and gene-based hypoxia biomarkers in cervical cancer, appraised the influence of intratumour heterogeneity in patient classification, and investigated the benefit of combining the methodologies in prediction of chemoradiotherapy failure.
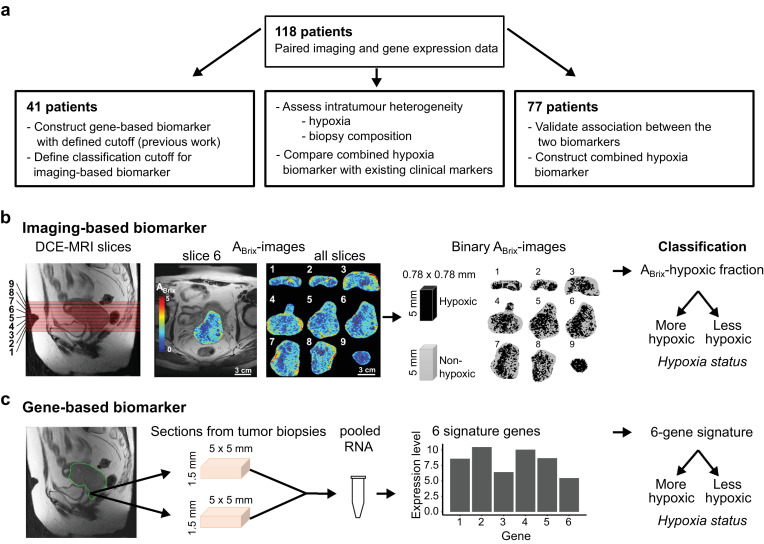
Methods: Hypoxic fraction from dynamic contrast enhanced (DCE)-MR images and an expression signature of six hypoxia-responsive genes were assessed as imaging- and gene-based biomarker, respectively in 118 patients.
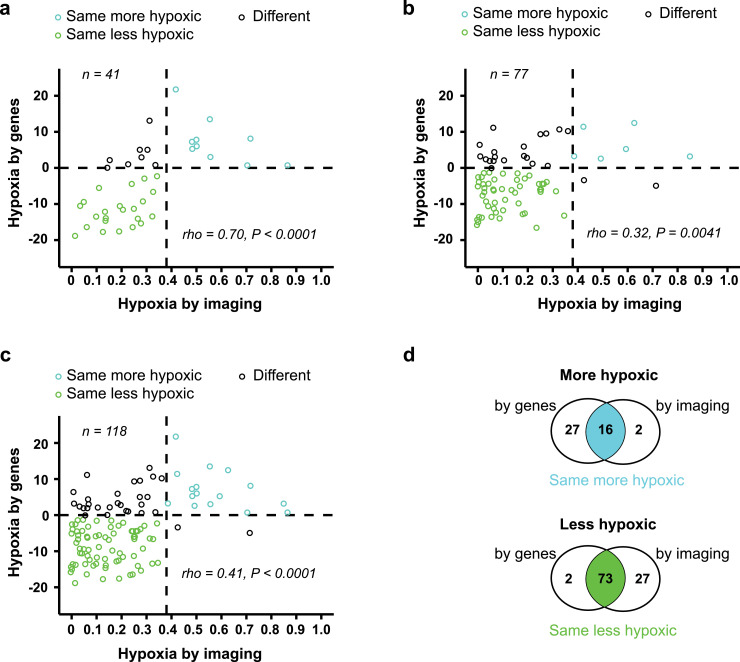
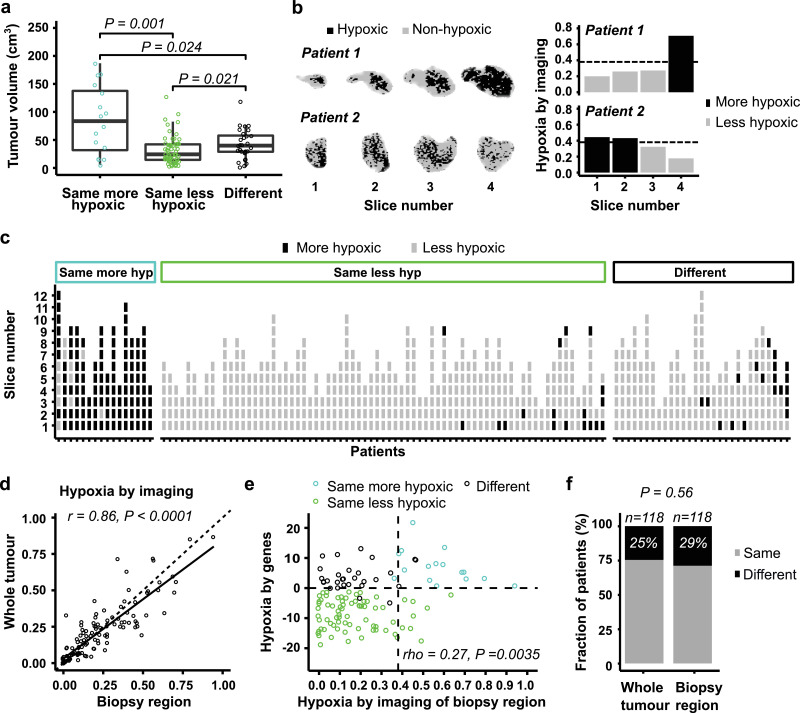
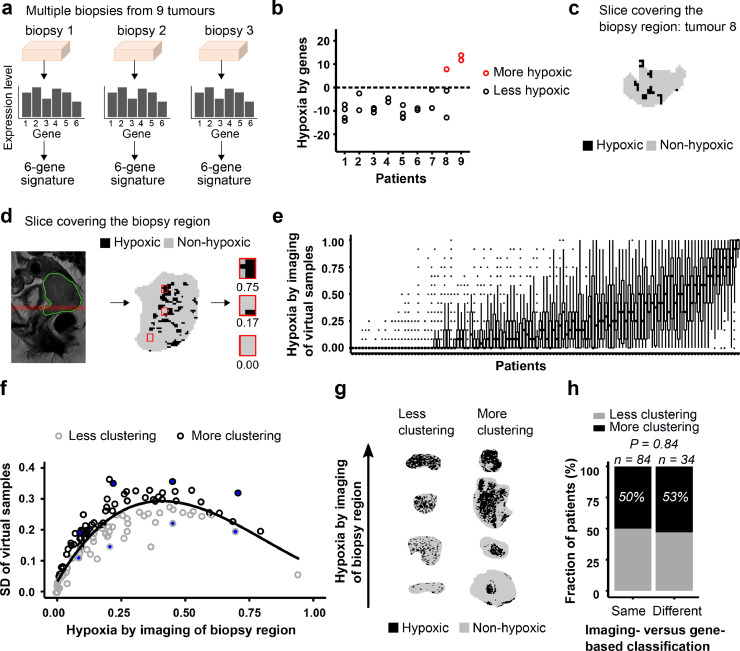
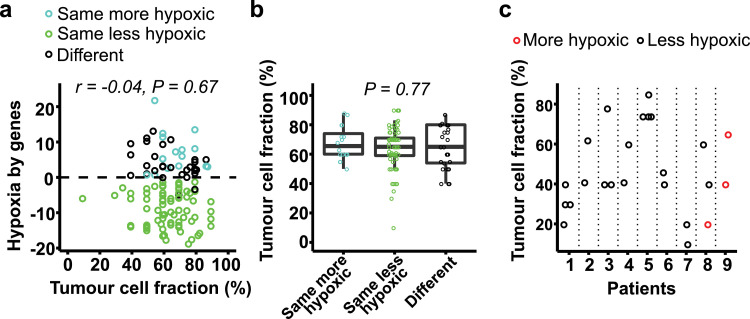
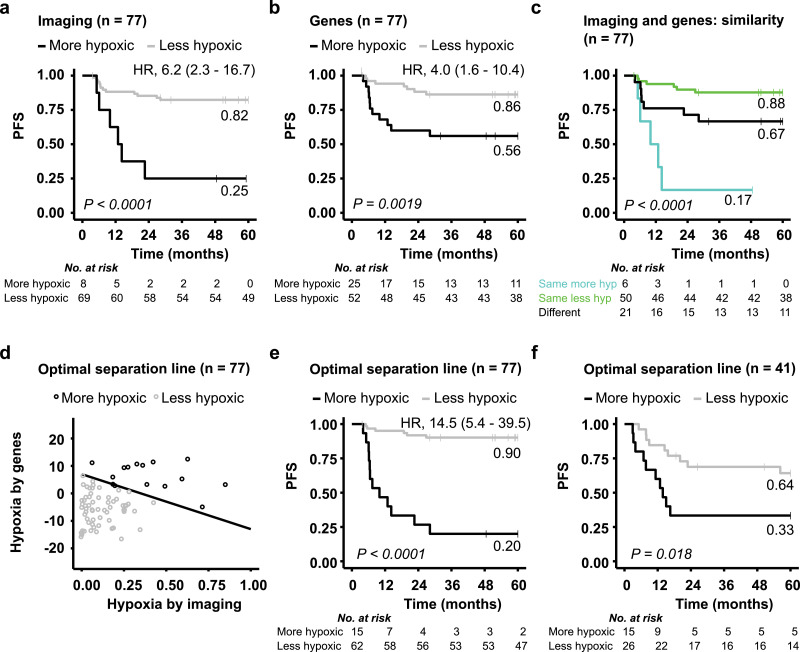
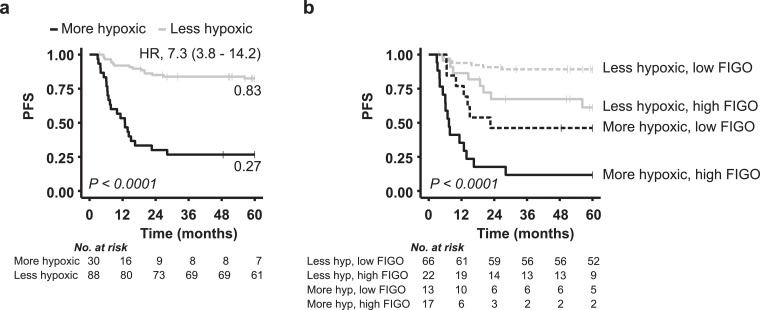
Findings: Dichotomous biomarker cutoff to yield similar hypoxia status by imaging and genes was defined in 41 patients, and the association was validated in the remaining 77 patients. The two biomarkers classified 75% of 118 patients with the same hypoxia status, and inconsistent classification was not related to imaging-defined intratumour heterogeneity in hypoxia. Gene-based hypoxia was independent on tumour cell fraction in the biopsies and showed minor heterogeneity across multiple samples in 9 tumours. Combining imaging- and gene-based classification gave a significantly better prediction of PFS than one biomarker alone. A combined dichotomous biomarker optimized in 77 patients showed a large separation in PFS between more and less hypoxic tumours, and separated the remaining 41 patients with different PFS. The combined biomarker showed prognostic value together with tumour stage in multivariate analysis.
Interpretation: Combining imaging- and gene-based biomarkers may enable more precise and informative assessment of hypoxia-related chemoradiotherapy resistance in cervical cancer.
Funding: Norwegian Cancer Society, South-Eastern Norway Regional Health Authority, and Norwegian Research Council.
Keywords: Cervical cancer; Gene expression signature; Hypoxia; Intratumour heterogeneity; Medical imaging; Prognostic biomarker.
Copyright © 2020 The Authors. Published by Elsevier B.V. All rights reserved.
Conflict of interest statement
Declaration of Competing Interest HL is registered as inventor of a patent application covering the clinical use of the hypoxia gene signature (WO2013/124,738).
Figures
Comment in
-
A new prognostic hypoxia biomarker consisting of imaging and gene-based data.EBioMedicine. 2020 Aug;58:102901. doi: 10.1016/j.ebiom.2020.102901. Epub 2020 Jul 30. EBioMedicine. 2020. PMID: 32739865 Free PMC article. No abstract available.
Similar articles
-
Integrative Analysis of DCE-MRI and Gene Expression Profiles in Construction of a Gene Classifier for Assessment of Hypoxia-Related Risk of Chemoradiotherapy Failure in Cervical Cancer.Clin Cancer Res. 2016 Aug 15;22(16):4067-76. doi: 10.1158/1078-0432.CCR-15-2322. Epub 2016 Mar 24. Clin Cancer Res. 2016. PMID: 27012812
-
Hypoxia-induced gene expression in chemoradioresistant cervical cancer revealed by dynamic contrast-enhanced MRI.Cancer Res. 2012 Oct 15;72(20):5285-95. doi: 10.1158/0008-5472.CAN-12-1085. Epub 2012 Aug 13. Cancer Res. 2012. PMID: 22890239
-
MRI Distinguishes Tumor Hypoxia Levels of Different Prognostic and Biological Significance in Cervical Cancer.Cancer Res. 2020 Sep 15;80(18):3993-4003. doi: 10.1158/0008-5472.CAN-20-0950. Epub 2020 Jun 30. Cancer Res. 2020. PMID: 32606004
-
Hypoxia gene expression signatures as predictive biomarkers for personalising radiotherapy.Br J Radiol. 2019 Jan;92(1093):20180036. doi: 10.1259/bjr.20180036. Epub 2018 Mar 20. Br J Radiol. 2019. PMID: 29513038 Free PMC article. Review.
-
Impact of hypoxia on cervical cancer outcomes.Int J Gynecol Cancer. 2021 Nov;31(11):1459-1470. doi: 10.1136/ijgc-2021-002806. Epub 2021 Sep 30. Int J Gynecol Cancer. 2021. PMID: 34593564 Review.
Cited by
-
A new prognostic hypoxia biomarker consisting of imaging and gene-based data.EBioMedicine. 2020 Aug;58:102901. doi: 10.1016/j.ebiom.2020.102901. Epub 2020 Jul 30. EBioMedicine. 2020. PMID: 32739865 Free PMC article. No abstract available.
-
Tumor Hypoxia Regulates Immune Escape/Invasion: Influence on Angiogenesis and Potential Impact of Hypoxic Biomarkers on Cancer Therapies.Front Immunol. 2021 Jan 20;11:613114. doi: 10.3389/fimmu.2020.613114. eCollection 2020. Front Immunol. 2021. PMID: 33552076 Free PMC article. Review.
-
Prediction of prostate tumour hypoxia using pre-treatment MRI-derived radiomics: preliminary findings.Radiol Med. 2023 Jun;128(6):765-774. doi: 10.1007/s11547-023-01644-3. Epub 2023 May 17. Radiol Med. 2023. PMID: 37198374 Free PMC article.
-
Predicting Response to Chemotherapy in Patients With Newly Diagnosed High-Risk Neuroblastoma: A Report From the International Neuroblastoma Risk Group.JCO Clin Cancer Inform. 2021 Dec;5:1181-1188. doi: 10.1200/CCI.21.00103. JCO Clin Cancer Inform. 2021. PMID: 34882497 Free PMC article.
-
Progression Risk Score Estimation Based on Immunostaining Data in Oral Cancer Using Unsupervised Hierarchical Clustering Analysis: A Retrospective Study in Taiwan.J Pers Med. 2021 Sep 13;11(9):908. doi: 10.3390/jpm11090908. J Pers Med. 2021. PMID: 34575686 Free PMC article.
References
-
- Jaffray D.A., Das S., Jacobs P.M., Jeraj R., Lambin P. How advances in imaging will affect precision radiation oncology. Int J Radiat Oncol Biol Phys. 2018;101(2):292–298. - PubMed
Publication types
MeSH terms
Substances
LinkOut - more resources
Full Text Sources
Medical
Molecular Biology Databases
