. 2020 Jul:57:102845.
doi: 10.1016/j.ebiom.2020.102845. Epub 2020 Jun 21.

Nanoscale regulation of L-type calcium channels differentiates between ischemic and dilated cardiomyopathies

Affiliations

Nanoscale regulation of L-type calcium channels differentiates between ischemic and dilated cardiomyopathies

Jose L Sanchez-Alonso et al. EBioMedicine. 2020 Jul.

Abstract

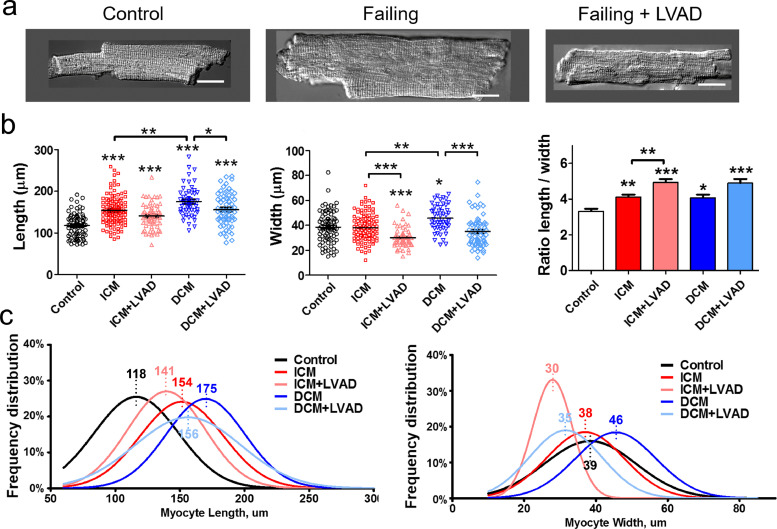
Background: Subcellular localization and function of L-type calcium channels (LTCCs) play an important role in regulating contraction of cardiomyocytes. Understanding how this is affected by the disruption of transverse tubules during heart failure could lead to new insights into the disease.

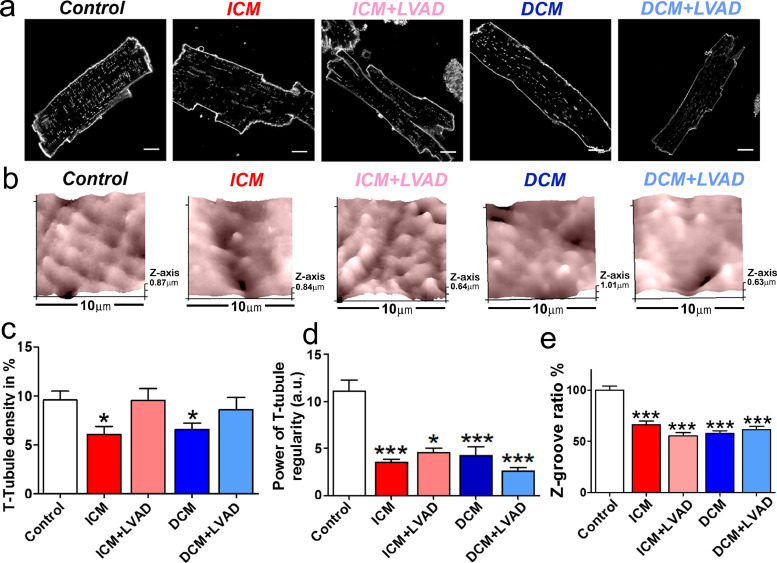
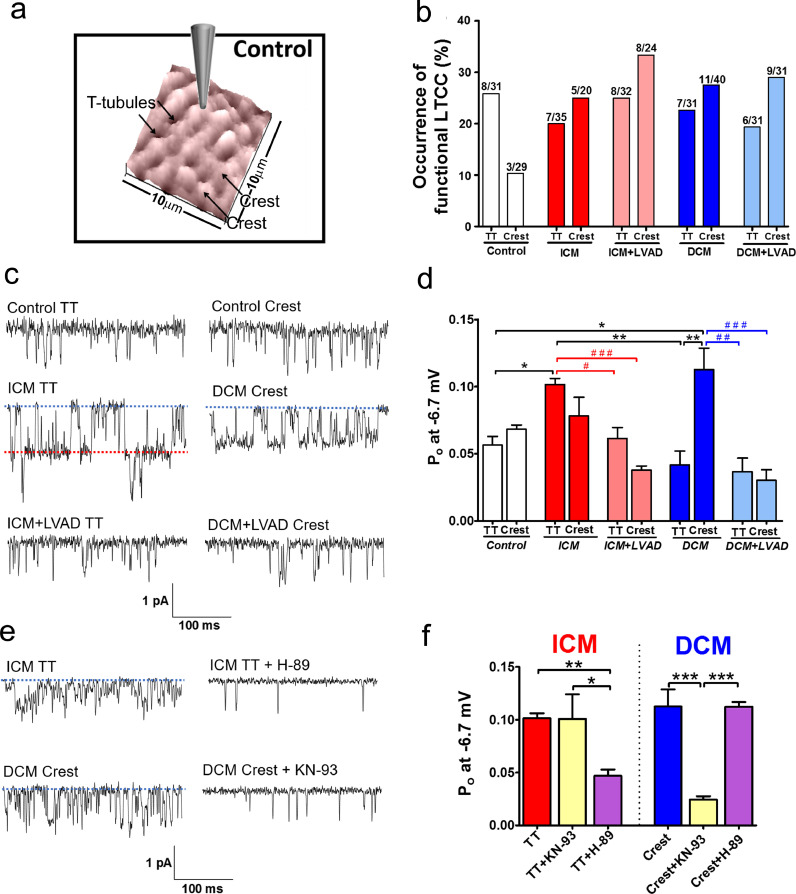
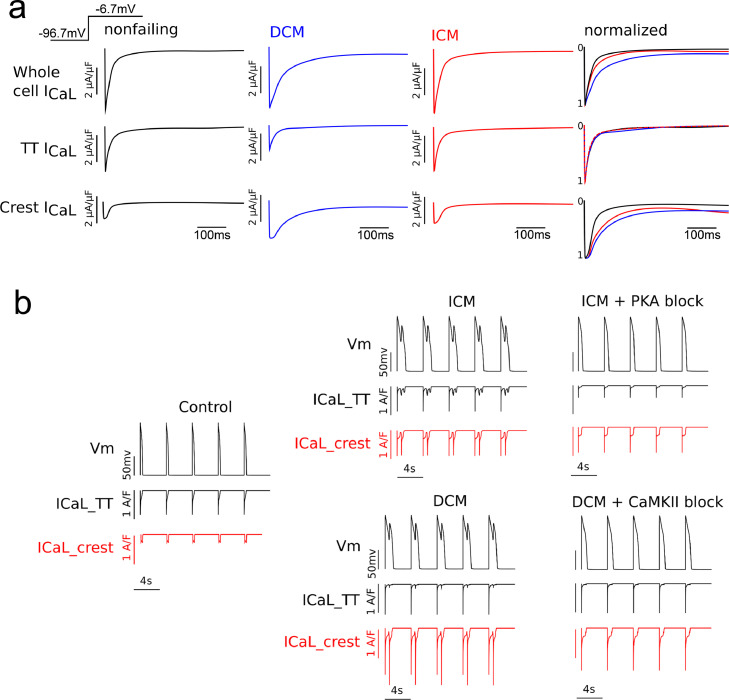
Methods: Cardiomyocytes were isolated from healthy donor hearts, as well as from patients with cardiomyopathies and with left ventricular assist devices. Scanning ion conductance and confocal microscopy was used to study membrane structures in the cells. Super-resolution scanning patch-clamp was used to examine LTCC function in different microdomains. Computational modeling predicted the impact of these changes to arrhythmogenesis at the whole-heart level.

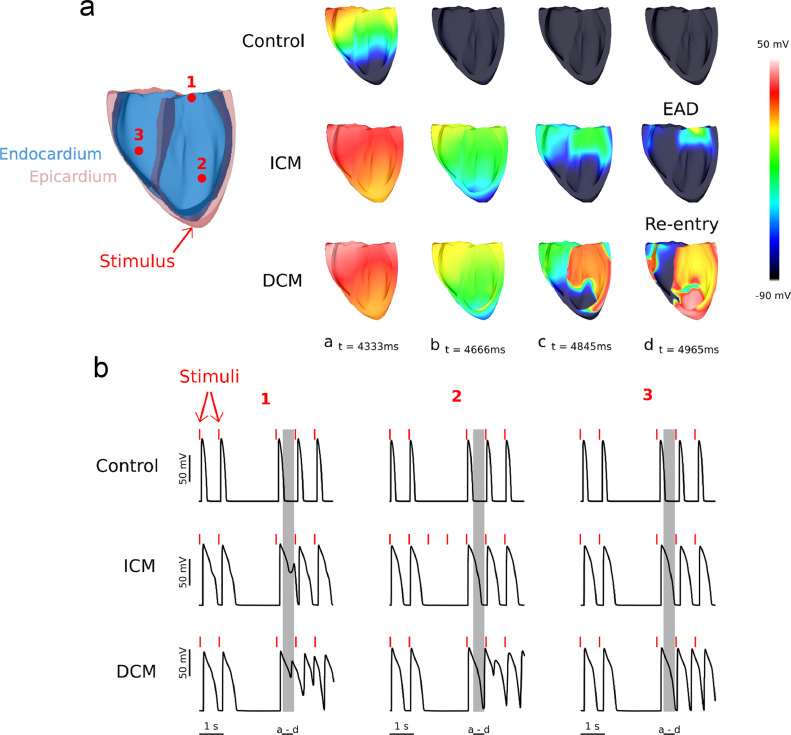
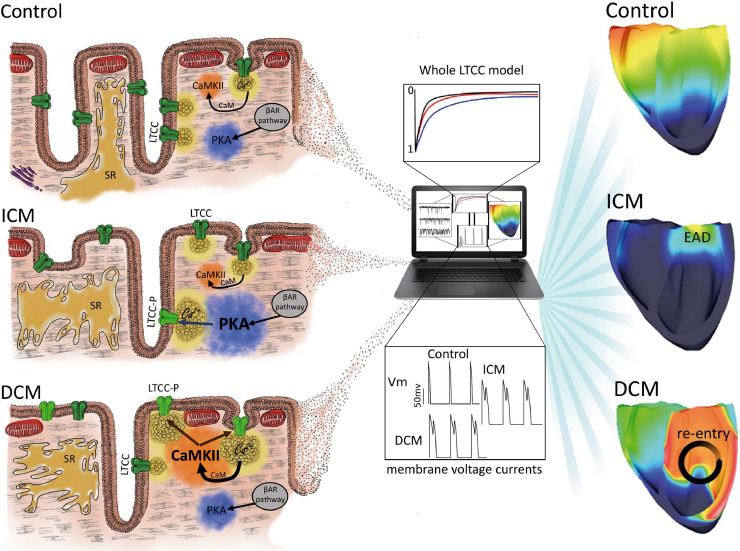
Findings: We showed that loss of structural organization in failing myocytes leads to re-distribution of functional LTCCs from the T-tubules to the sarcolemma. In ischemic cardiomyopathy, the increased LTCC open probability in the T-tubules depends on the phosphorylation by protein kinase A, whereas in dilated cardiomyopathy, the increased LTCC opening probability in the sarcolemma results from enhanced phosphorylation by calcium-calmodulin kinase II. LVAD implantation corrected LTCCs pathophysiological activity, although it did not improve their distribution. Using computational modeling in a 3D anatomically-realistic human ventricular model, we showed how LTCC location and activity can trigger heart rhythm disorders of different severity.

Interpretation: Our findings demonstrate that LTCC redistribution and function differentiate between disease aetiologies. The subcellular changes observed in specific microdomains could be the consequence of the action of distinct protein kinases.

Funding: This work was supported by NIH grant (ROI-HL 126802 to NT-JG) and British Heart Foundation (grant RG/17/13/33173 to JG, project grant PG/16/17/32069 to RAC). Funders had no role in study design, data collection, data analysis, interpretation, writing of the report.

Keywords: Cardiomyopathy; Computational biology; Electrophysiology; Heart Failure; Ion channels.


Conflict of interest statement

Declaration of Competing Interest The authors declare no competing interests.

Figures

Fig. 1
Fig. 1
Human ventricular cardiomyocyte size is increased in failing cells and partially reverts after LVAD implantation. (a) Representative images of single cardiomyocytes from control, failing and failing with LVAD patients, scale bar 20 µm. (b) Length, width and their ratio from control (black, 80 cells), ICM (red, 112 cells), ICM+LVAD (pink, 64 cells), DCM (blue, 52 cells), and DCM+LVAD (light blue, 65 cells) groups. (c) Histograms of frequency distribution of individual cardiomyocyte dimensions from b. In each plot, x-axis indicates percent of cells in each size range. Average length and width for each group is represented in the top of each graph. Data are represented as mean ± SEM. * denotes p<0.05, ** denotes p<0.01, *** denotes p<0.001. One-Way ANOVA (length) and Kruskal-Wallis (width and ratio) tests were used.
Fig. 2
Fig. 2
Structural loss in failing ventricular myocytes. (a) Confocal image examples of human control and failing cardiomyocytes showing membranes stained with di-8-ANNEPS, scale bar 10 µm. (b) SICM 10 µm x 10 µm scans examples from the cell surface shows regular undulations, indicating spatially alternating TT invaginations and surface membrane crests in control and failing cardiomyocytes. (c) TT density in control and failing cardiomyocytes (Control n = 35, ICM n = 28, ICM+LVAD n = 14, DCM n = 32, DCM+LVAD n = 23). (d) Power of TT regularity in control and failing cells (Control n = 35, ICM n = 21, ICM+LVAD n = 13, DCM n = 32, DCM+LVAD n = 23). (e) Z-groove index in cardiomyocytes normalized to control average value (Control n = 96, ICM n = 68, ICM+LVAD n = 70, DCM n = 116, DCM+LVAD n = 80). Data are represented as mean ± SEM. * denotes p<0.05, *** denotes p<0.001. One-Way ANOVA (TT density) and Kruskal-Wallis (TT regularity and Z-groove ratio) tests were used.
Fig. 3
Fig. 3
LTCC localization and characteristics in control versus failing ventricular cardiomyocytes. (a) 10 × 10 µm representative SICM topographical image of a control cell showing the location of TT and Crest microdomains. (b) Representation of the chance of obtaining a LTCC current (% of occurrence). It represents the number of recordings with LTCC activity (left number in the bar) versus the total number of recordings done in a specific microdomain and group (right number in the bar). (c) Representative single channel traces at −6.7 mV. (d) Graph showing the Po of TT or Crest channels in all the groups. Po is increased on TT of ICM cells, and on Crest of DCM cells. LVAD implantation recover these values to control levels (n number TT/crest: Control 13/11; ICM 9/8; ICM+LVAD 15/13; DCM 11/13; DCM+LVAD 9/13). (e) Representative single channel traces at −6.7 mV with or without kinase blocker. (f) Graph showing how the Po of ICM and DCM channels decrease after the application of H-89 or KN-93 (ICM: TT n = 9, TT+KN-93 n = 5, TT+H-89 n = 7, DCM: Crest n = 12, Crest+KN-93 n = 13, Crest+H-89 n = 10). Data are represented as mean ± SEM. * denotes p<0.05, ** denotes p<0.01. Kruskal–Wallis test was used.
Fig. 4
Fig. 4
Computational modeling. (a) Overview of whole L-type calcium current model under voltage-clamp protocol. LTCC current from the control (black), DCM (blue) and ICM (red) models. Currents were normalized and plotted on the same graph to compare their decay rates. The three rows represent the whole cell LTCC current (first row), the TT component (second row) or the crest component (third row). (b) Comparation of membrane voltage and L-type Calcium current traces. For the ICM model, EADs were obtained when the LTCCs in the TTs were phosphorylated by PKA (top row, left), but not when PKA activity was blocked (top row, right). Similarly, arrhythmogenic triggers developed in the DCM model when LTCCs from the crest were phosphorylated by CaMKII (bottom row, left), and not when CaMKII activity was blocked (bottom row, right).
Fig. 5
Fig. 5
Graphical representation of the whole heart simulations. (a) The voltage maps from 4 different points in time were plotted for the three cases (Control, ICM, DCM). A short depolarization between two consecutive stimuli was recorded in the ICM heart, while a reentrant arrhythmia was obtained in the DCM organ. (b) The membrane potential was recorded from three different virtual electrodes in the ventricles and displayed. In the ICM case, an island of tissue displayed a synchronous single EAD following the stimulus after the skipped 2 beats. In the DCM case, both singular and multiple EADs were recorded in one or more beats after the skipped ones.
Fig. 6
Fig. 6
Schematic representation of the mechanism suggested in the differences between ICM and DCM during the progression of HF. A redistribution of L-type calcium channels from the loss of TT to the sarcolemma surface happens in failing cardiomyocytes. At the same time, LTCC channels are phosphorylated (LTCC-P) in the TT of ICM cells, and in the Crest of DCM cells, by an increase of PKA and CaMKII activity respectively. LVAD implantation would produce a decrease of these enzymatic activity leading to a decrease in the open probability of the LTCC. The experimental data was used in a 3D anatomically realistic human ventricular model, showing how LTCC location and activity can trigger pathological events of different severity. BAR: βeta-adrenergic receptor; CaM: Calmodulin; EAD: Early after depolarization.

References

    1. Tomaselli G.F. What causes sudden death in heart failure? Circ Res. 2004;95:754–763. - PubMed
    1. Roger V.L., Go A.S., Lloyd-Jones D.M. Heart disease and stroke statistics–2011 update: a report from the American heart association. Circulation. 2011;123:e18–209. - PMC - PubMed
    1. Al Chekakie M.O. Traditional heart failure medications and sudden cardiac death prevention: a review. J Cardiovasc Pharmacol Ther. 2013;18:412–426. - PubMed
    1. Bers D.M. Calcium cycling and signaling in cardiac myocytes. Annu Rev Physiol. 2008;70:23–49. - PubMed
    1. Simms B.A., Zamponi G.W. Trafficking and stability of voltage-gated calcium channels. Cell Mol Life Sci. 2012;69:843–856. - PMC - PubMed

MeSH terms

Substances