

Artificial Sweeteners Disrupt Tight Junctions and Barrier Function in the Intestinal Epithelium through Activation of the Sweet Taste Receptor, T1R3
- PMID: 32580504
- PMCID: PMC7353258
- DOI: 10.3390/nu12061862
Artificial Sweeteners Disrupt Tight Junctions and Barrier Function in the Intestinal Epithelium through Activation of the Sweet Taste Receptor, T1R3
Abstract
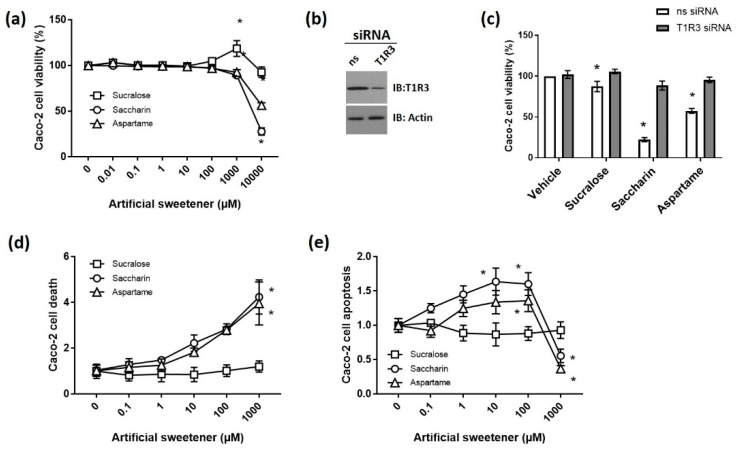
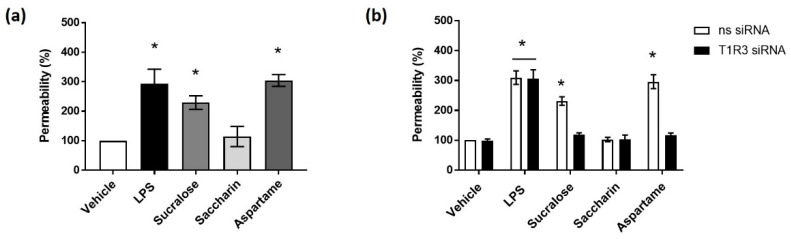
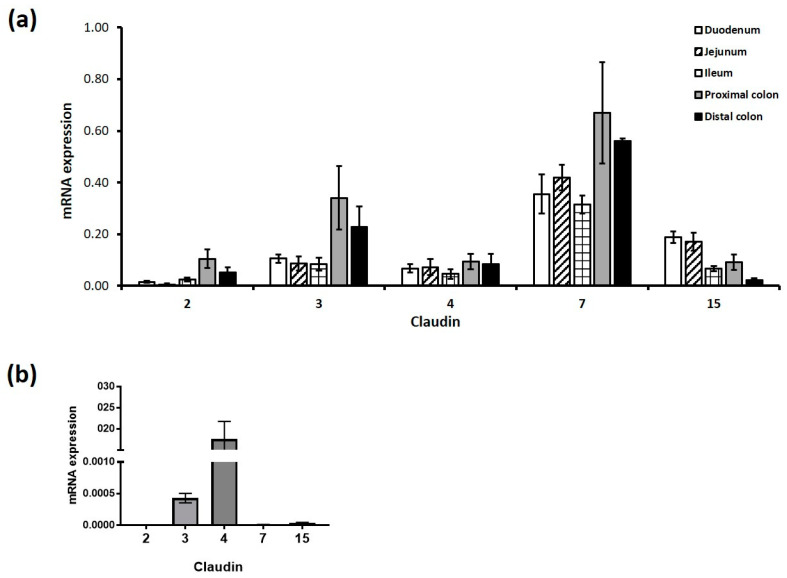
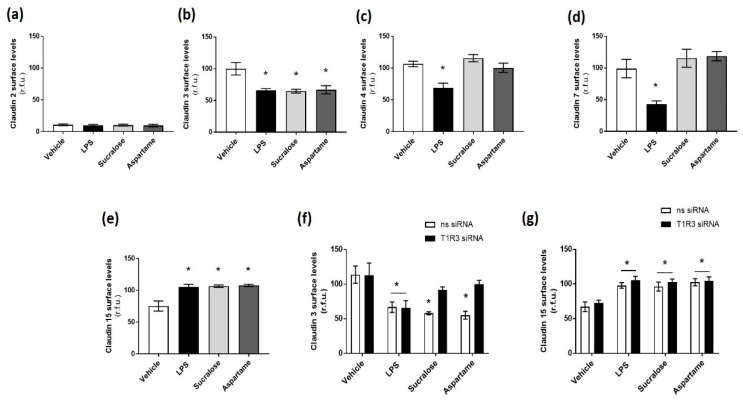
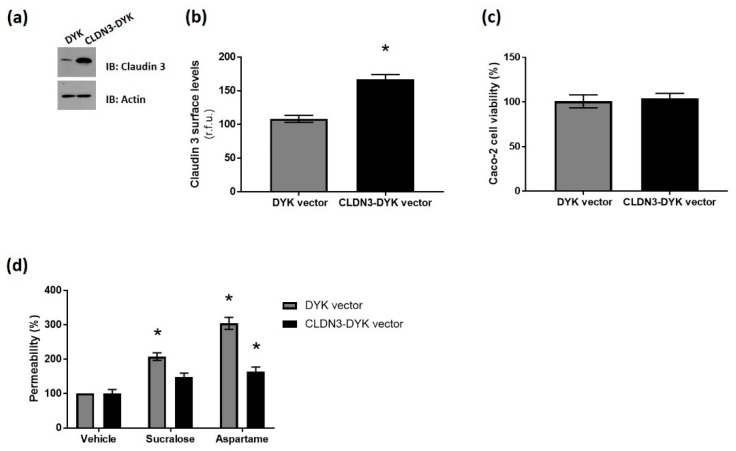
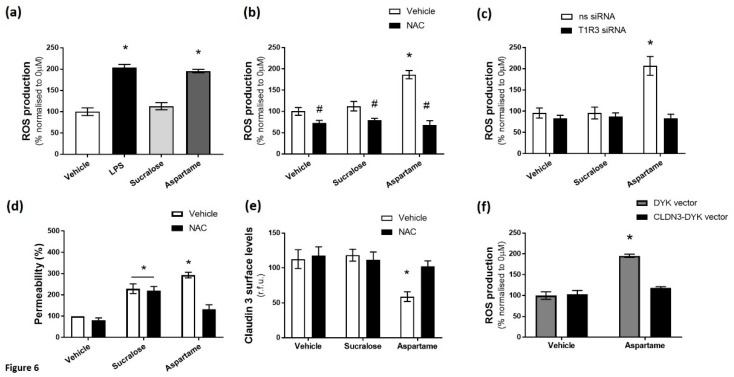
The breakdown of the intestinal epithelial barrier and subsequent increase in intestinal permeability can lead to systemic inflammatory diseases and multiple-organ failure. Nutrition impacts the intestinal barrier, with dietary components such as gluten increasing permeability. Artificial sweeteners are increasingly consumed by the general public in a range of foods and drinks. The sweet taste receptor (T1R3) is activated by artificial sweeteners and has been identified in the intestine to play a role in incretin release and glucose transport; however, T1R3 has not been previously linked to intestinal permeability. Here, the intestinal epithelial cell line, Caco-2, was used to study the effect of commonly-consumed artificial sweeteners, sucralose, aspartame and saccharin, on permeability. At high concentrations, aspartame and saccharin were found to induce apoptosis and cell death in intestinal epithelial cells, while at low concentrations, sucralose and aspartame increased epithelial barrier permeability and down-regulated claudin 3 at the cell surface. T1R3 knockdown was found to attenuate these effects of artificial sweeteners. Aspartame induced reactive oxygen species (ROS) production to cause permeability and claudin 3 internalization, while sweetener-induced permeability and oxidative stress was rescued by the overexpression of claudin 3. Taken together, our findings demonstrate that the artificial sweeteners sucralose, aspartame, and saccharin exert a range of negative effects on the intestinal epithelium through the sweet taste receptor T1R3.
Keywords: Caco-2; claudin; intestinal epithelium; permeability; sweeteners.
Conflict of interest statement
The authors declare no conflict of interest.
Figures
Similar articles
-
Artificial sweetener saccharin disrupts intestinal epithelial cells' barrier function in vitro.Food Funct. 2018 Jul 17;9(7):3815-3822. doi: 10.1039/c8fo00883c. Food Funct. 2018. PMID: 29938270
-
Activation of the sweet taste receptor, T1R3, by the artificial sweetener sucralose regulates the pulmonary endothelium.Am J Physiol Lung Cell Mol Physiol. 2018 Jan 1;314(1):L165-L176. doi: 10.1152/ajplung.00490.2016. Epub 2017 Sep 28. Am J Physiol Lung Cell Mol Physiol. 2018. PMID: 28971978 Free PMC article.
-
Sweet taste receptor expression in ruminant intestine and its activation by artificial sweeteners to regulate glucose absorption.J Dairy Sci. 2014;97(8):4955-72. doi: 10.3168/jds.2014-8004. Epub 2014 Jun 2. J Dairy Sci. 2014. PMID: 24881785
-
Is the Use of Artificial Sweeteners Beneficial for Patients with Diabetes Mellitus? The Advantages and Disadvantages of Artificial Sweeteners.Nutrients. 2022 Oct 22;14(21):4446. doi: 10.3390/nu14214446. Nutrients. 2022. PMID: 36364710 Free PMC article. Review.
-
Understanding the link between aspartame and cancer.Expert Rev Anticancer Ther. 2024 Sep;24(9):793-802. doi: 10.1080/14737140.2024.2383675. Epub 2024 Jul 31. Expert Rev Anticancer Ther. 2024. PMID: 39041328 Review.
Cited by
-
Inflammation-Associated Stem Cells in Gastrointestinal Cancers: Their Utility as Prognostic Biomarkers and Therapeutic Targets.Cancers (Basel). 2024 Sep 12;16(18):3134. doi: 10.3390/cancers16183134. Cancers (Basel). 2024. PMID: 39335106 Free PMC article. Review.
-
Ultra-processed foods as a possible culprit for the rising prevalence of inflammatory bowel diseases.Front Med (Lausanne). 2022 Nov 7;9:1058373. doi: 10.3389/fmed.2022.1058373. eCollection 2022. Front Med (Lausanne). 2022. PMID: 36419796 Free PMC article. Review.
-
Artificial Sweeteners: History and New Concepts on Inflammation.Front Nutr. 2021 Sep 24;8:746247. doi: 10.3389/fnut.2021.746247. eCollection 2021. Front Nutr. 2021. PMID: 34631773 Free PMC article. Review.
-
Physiological Integration of Taste and Metabolism.N Engl J Med. 2024 May 9;390(18):1699-1710. doi: 10.1056/NEJMra2304578. N Engl J Med. 2024. PMID: 38718360 Free PMC article. Review. No abstract available.
-
The artificial sweetener neotame negatively regulates the intestinal epithelium directly through T1R3-signaling and indirectly through pathogenic changes to model gut bacteria.Front Nutr. 2024 Apr 24;11:1366409. doi: 10.3389/fnut.2024.1366409. eCollection 2024. Front Nutr. 2024. PMID: 38721028 Free PMC article.
References
-
- Rayes N., Seehofer D., Hansen S., Boucsein K., Muller A.R., Serke S., Bengmark S., Neuhaus P. Early Enteral Supply of Lactobacillus and Fiber Versus Selective Bowel Decontamination: A Controlled Trial in Liver Transplant Recipients. Transplantation. 2002;74:123–127. doi: 10.1097/00007890-200207150-00021. - DOI - PubMed
MeSH terms
Substances
Grants and funding
LinkOut - more resources
Full Text Sources
