. 2020 Jul 20;147(14):dev185777.
doi: 10.1242/dev.185777.

A single cell transcriptional atlas of early synovial joint development

Affiliations

A single cell transcriptional atlas of early synovial joint development

Qin Bian et al. Development. .

Abstract

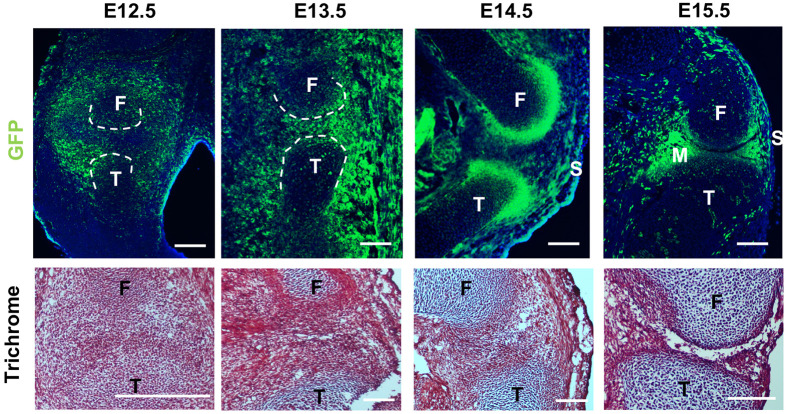
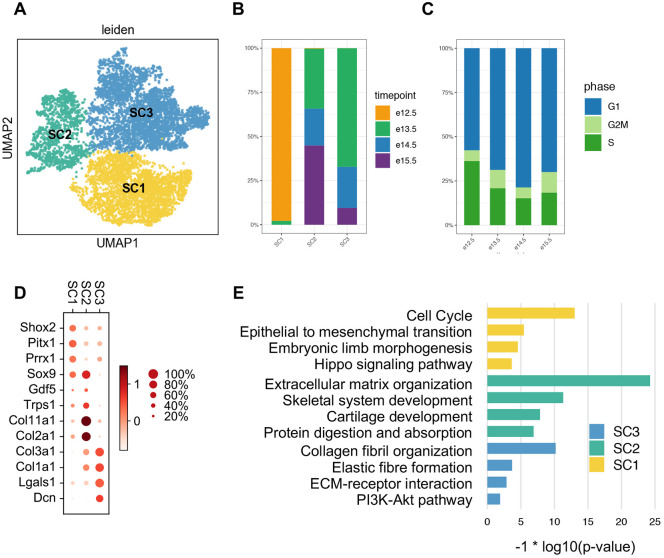
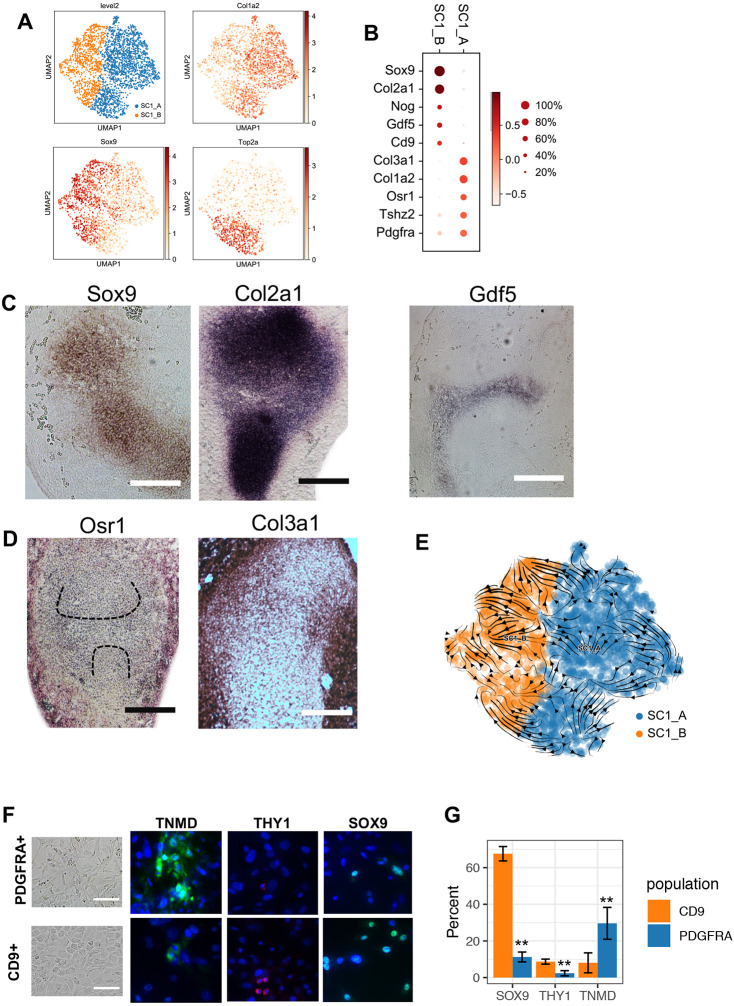
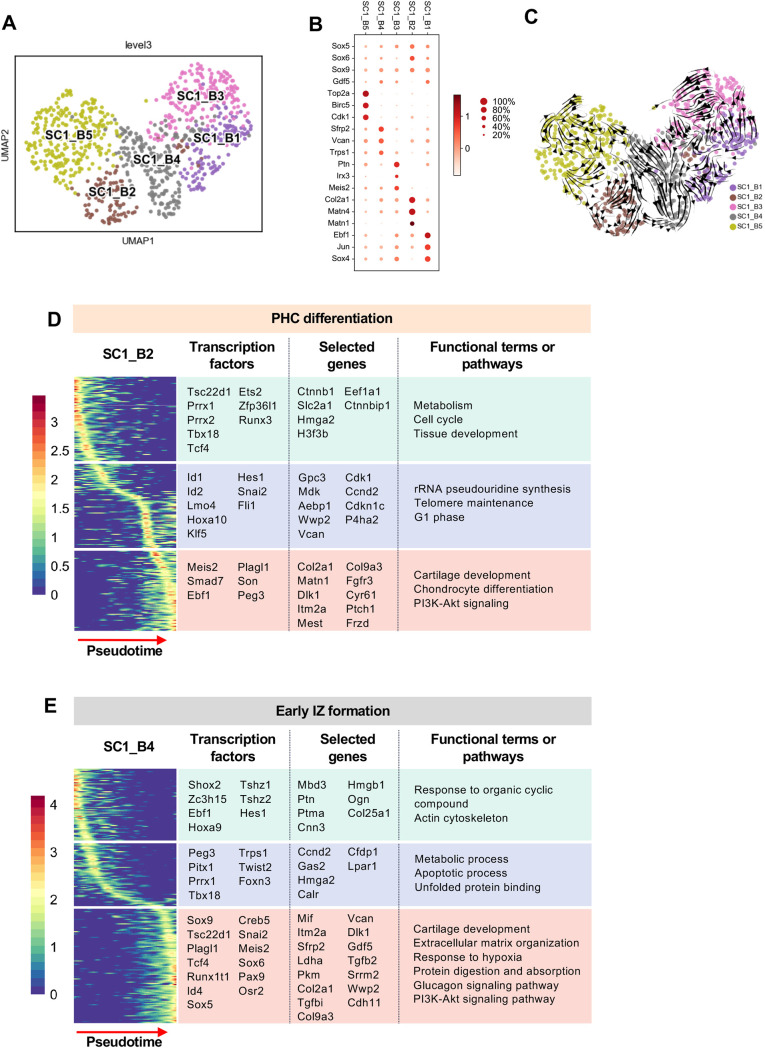
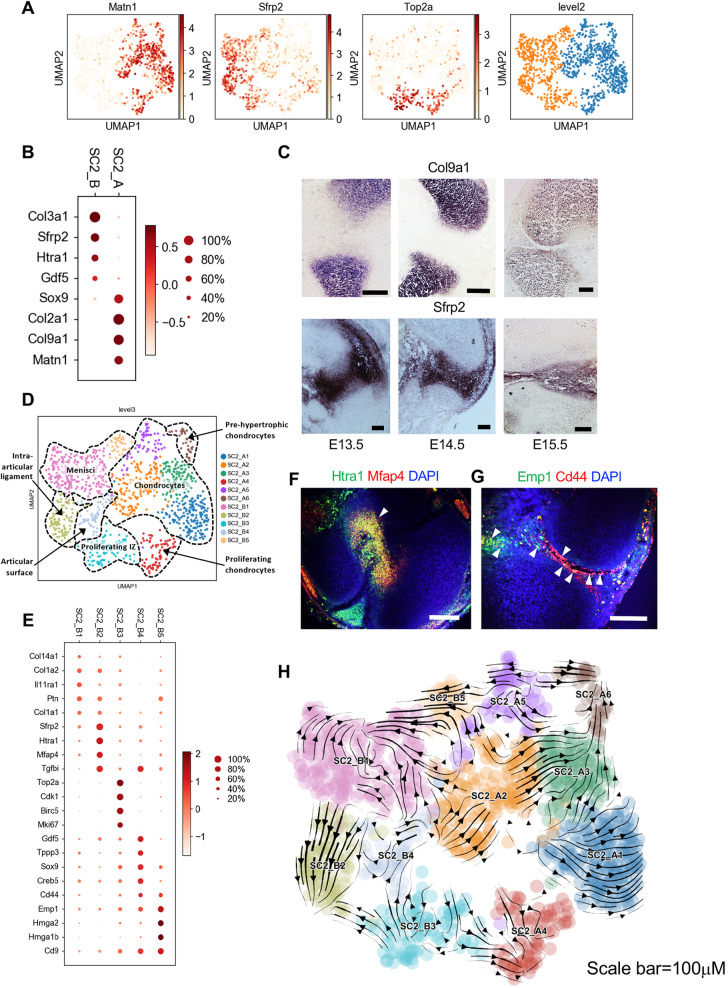
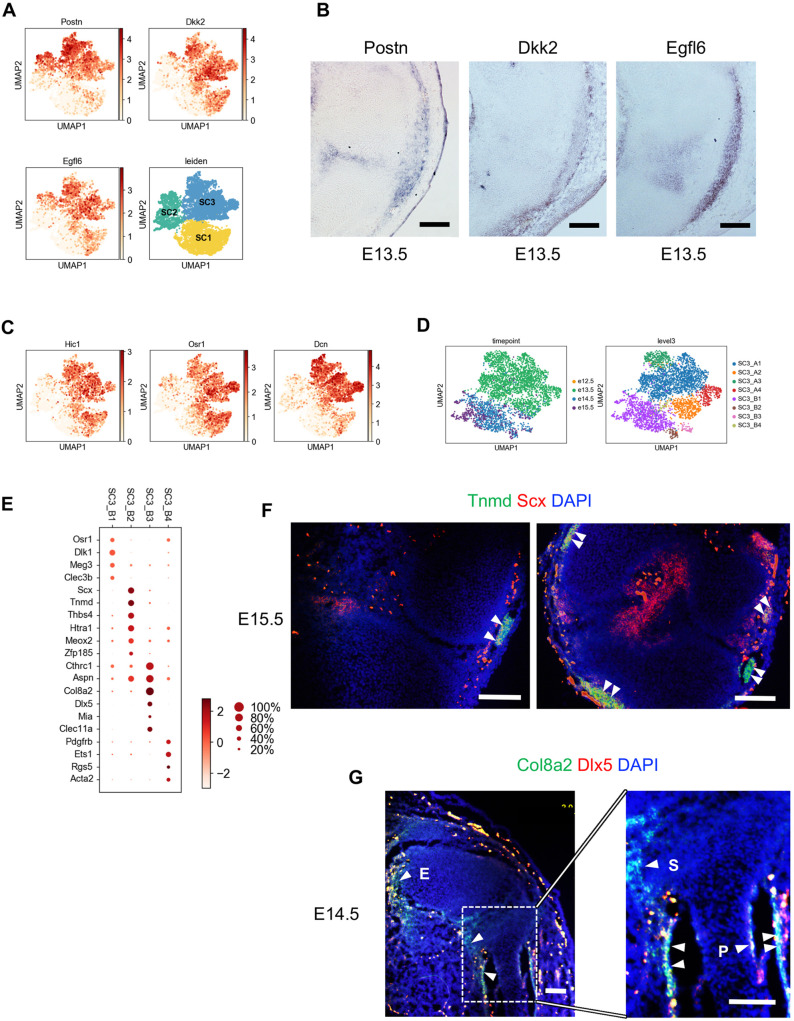
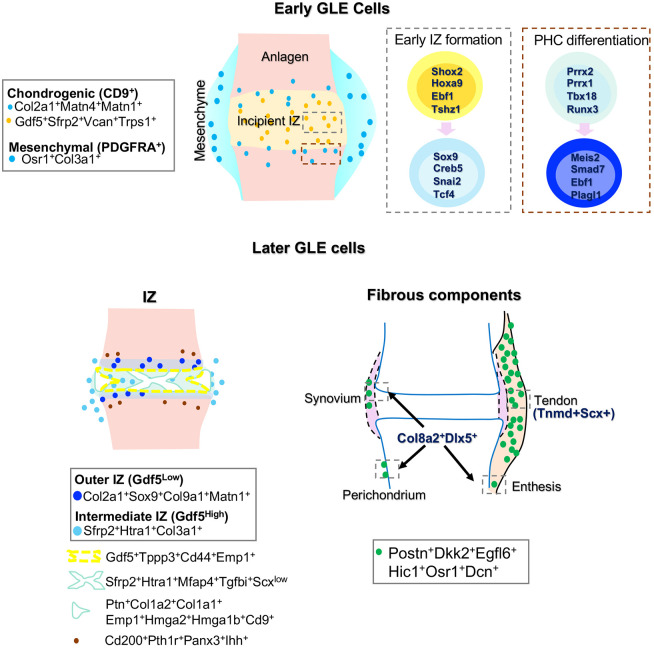
Synovial joint development begins with the formation of the interzone, a region of condensed mesenchymal cells at the site of the prospective joint. Recently, lineage-tracing strategies have revealed that Gdf5-lineage cells native to and from outside the interzone contribute to most, if not all, of the major joint components. However, there is limited knowledge of the specific transcriptional and signaling programs that regulate interzone formation and fate diversification of synovial joint constituents. To address this, we have performed single cell RNA-Seq analysis of 7329 synovial joint progenitor cells from the developing murine knee joint from E12.5 to E15.5. By using a combination of computational analytics, in situ hybridization and in vitro characterization of prospectively isolated populations, we have identified the transcriptional profiles of the major developmental paths for joint progenitors. Our freely available single cell transcriptional atlas will serve as a resource for the community to uncover transcriptional programs and cell interactions that regulate synovial joint development.

Keywords: Articular cartilage; Chondrocyte; Gdf5; Interzone; Ligament; Meniscus; Single cell RNA-Seq; Synovial joint development; Synovium.


Conflict of interest statement

Competing interestsThe authors declare no competing or financial interests.

Figures

Fig. 1.
Fig. 1.
Morphology of the embryonic knee joint and localization of Gdf5-lineage cells. Top: localization of Gdf5-lineage cells in murine hindlimb. Bottom: cell density and morphology during joint formation, as shown by trichrome staining. n=6 per timepoint. F, femur; M, meniscus; S, synovium; T, tibia. Scale bars: 100 µm.
Fig. 2.
Fig. 2.
scRNA-Seq of Gdf5 lineage-enriched cells during knee development. (A) Leiden clustering and UMAP embedding of the three distinct superclusters of GLE cells. (B) The proportion of cells from each timepoint varies across superclusters. (C) The proportion of mitosis phases in each timepoint. (D) Expression of genes well-characterized in limb and joint development. Size of each dot reflects the percentage of cells in which the gene is detected within the supercluster. The color indicates mean expression, including cells in which there is no detectable expression. (E) Supercluster gene set enrichment analysis, showing selected categories. Complete results are in Table S1.
Fig. 3.
Fig. 3.
SC1 is composed of chondrogenic and mesenchymal fated cells. (A) Leiden clustering and UMAP map embedding SC1 and representative gene expression patterns. (B) Dot plot expression of representative genes differentially expressed between SC1_A and SC1_B. (C,D) In situ hybridization detection for SC1_A and SC1_B representative genes. (E) RNA velocity analysis. Arrows indicate the predicted future state of SC1 cells, showing a minimal transition between SC1_A and SC1_B. (F) In vitro culture of YFP+/PDGFRA+ and YFP+/CD9+ hindlimb cells from E12.5 embryos shows distinct morphology of the cells (left). Immunofluorescence staining of the tendon and ligament marker TNMD, the fibroblast marker THY1 and the chondrocyte regulator SOX9 (right). (G) Quantification of the proportion of cells positive for each marker. Three independent experiments were conducted. Data are mean±s.d. **P<0.01 versus CD9 group (unpaired Student's t-test). Scale bars: 100 µm.
Fig. 4.
Fig. 4.
Dynamic expression patterns of nascent interzone. (A) Leiden clustering and UMAP map embedding of SC1B. (B) Dot plot of expression of representative genes differentially expressed between SC1B subclusters. (C) RNA velocity indicates no obvious trajectories of subclusters. Pseudotime analysis identifies three stages of gene expression in PHC differentiation (D) and early IZ formation (E). Transcription factors, selected genes and functional terms or pathways from each stage are listed on the right.
Fig. 5.
Fig. 5.
SC2 is composed of interzone fated cells. (A) Leiden clustering and UMAP map embedding SC2 and representative gene expression patterns. (B) Dot plot expression of representative genes differentially expressed between SC2_A and SC2_B. (C) In situ hybridization detection for SC2_A (Col9a1) and SC2_B (Sfrp2) representative genes illustrating expression of Col9a1 in transient cartilage and Sfrp2 in the IZ. (D) Subclustering of SC2_A and SC2_B. Potential cell types are labeled. (E) Dot plot expression of representative genes differentially expressed between SC2_B subclusters. (F) Coronal section of E15.5 knee joint showing co-expression of Htra1 (green) and Mfap4 (red) in intra-articular ligaments. (G) Detection of Emp1 (green) and Cd44 (red) transcripts with RNAscope Hiplex probes on sagittal section of E15.5. Arrowheads indicate co-expression. (H) RNA Velocity analysis. Arrows indicate the predicted future state of SC2 cells, showing a transition between SC2_A2 and SC2_A3, SC2_A3 and SC2_A6, and SC2_B5 and SC2_B1. Scale bars: 100 µm.
Fig. 6.
Fig. 6.
SC3 is composed of articular fibrous component cells. (A) Gene expression patterns of three SC3 representative genes. (B) In situ hybridization detection for SC3 representative genes, showing expressions of Postn, Dkk2 and Egfl6 in the IZ region, outer tendon and fibrous tissue of E13.5 sagittal sections. (C) Distribution of genes detected in surrounding mesenchyme. (D) Subclustering of SC3 by Leiden. (E) Dot plot expression of representative genes differentially expressed among SC3_B subclusters. (F) RNAscope Hiplex for Tnmd (green) and Scx (red) of sagittal (left) and coronal (right) sections from E15.5 knee joint. Arrowheads indicate double-positive cells. (G) Sagittal sections of E14.5 knee joint showing the expression of Col8a2 (green) and Dlx5 (red). Higher magnification (right) of the boxed area (left) illustrating double-positive staining in perichondrium (P), synovium (S) and enthesis (E). Scale bars: 100 µm.
Fig. 7.
Fig. 7.
Nascent joint development. Diagram of nascent joint development populations and markers identified here.

References

    1. Amarilio R., Viukov S. V., Sharir A., Eshkar-Oren I., Johnson R. S. and Zelzer E. (2007). HIF1α regulation of Sox9 is necessary to maintain differentiation of hypoxic prechondrogenic cells during early skeletogenesis. Development 134, 3917-3928. 10.1242/dev.008441 - DOI - PubMed
    1. Aro E., Salo A. M., Khatri R., Finnilä M., Miinalainen I., Sormunen R., Pakkanen O., Holster T., Soininen R., Prein C. et al. (2015). Severe extracellular matrix abnormalities and chondrodysplasia in mice lacking collagen Prolyl 4-hydroxylase isoenzyme II in combination with a reduced amount of Isoenzyme I. J. Biol. Chem. 290, 16964-16978. 10.1074/jbc.M115.662635 - DOI - PMC - PubMed
    1. Asahara H., Inui M. and Lotz M. K. (2017). Tendons and ligaments: connecting developmental biology to musculoskeletal disease pathogenesis. J. Bone Miner. Res. 32, 1773-1782. 10.1002/jbmr.3199 - DOI - PMC - PubMed
    1. Bhattaram P., Penzo-Méndez A., Sock E., Colmenares C., Kaneko K. J., Vassilev A., Depamphilis M. L., Wegner M. and Lefebvre V. (2010). Organogenesis relies on SoxC transcription factors for the survival of neural and mesenchymal progenitors. Nat. Commun. 1, 9 10.1038/ncomms1008 - DOI - PMC - PubMed
    1. Blackburn P. R., Xu Z., Tumelty K. E., Zhao R. W., Monis W. J., Harris K. G., Gass J. M., Cousin M. A., Boczek N. J., Mitkov M. V. et al. (2018). Bi-allelic alterations in AEBP1 lead to defective collagen assembly and connective tissue structure resulting in a variant of ehlers-danlos syndrome. Am. J. Hum. Genet. 102, 696-705. 10.1016/j.ajhg.2018.02.018 - DOI - PMC - PubMed

Publication types

MeSH terms