. 2020 Jun;8(1):e000328.
doi: 10.1136/jitc-2019-000328.

MRI of tumor T cell infiltration in response to checkpoint inhibitor therapy

Affiliations

MRI of tumor T cell infiltration in response to checkpoint inhibitor therapy

Xiaoyu Jiang et al. J Immunother Cancer. 2020 Jun.

Erratum in

Abstract

Background: Immune checkpoint inhibitors, the most widespread class of immunotherapies, have demonstrated unique response patterns that are not always adequately captured by traditional response criteria such as the Response Evaluation Criteria in Solid Tumors or even immune-specific response criteria. These response metrics rely on monitoring tumor growth, but an increase in tumor size and/or appearance after starting immunotherapy does not always represent tumor progression, but also can be a result of T cell infiltration and thus positive treatment response. Therefore, non-invasive and longitudinal monitoring of T cell infiltration are needed to assess the effects of immunotherapies such as checkpoint inhibitors. Here, we proposed an innovative concept that a sufficiently large influx of tumor infiltrating T cells, which have a smaller diameter than cancer cells, will change the diameter distribution and decrease the average size of cells within a volume to a degree that can be quantified by non-invasive MRI.

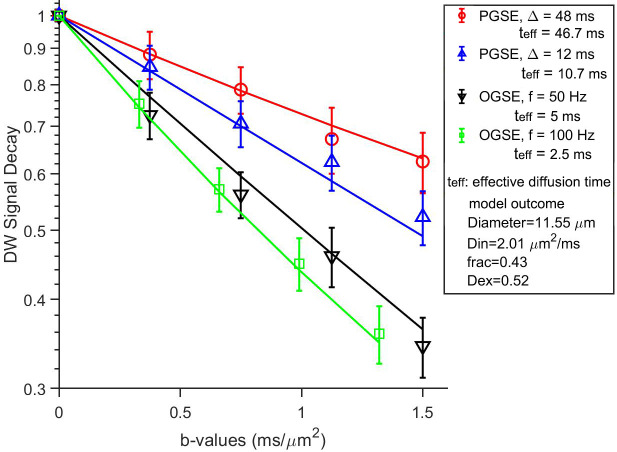
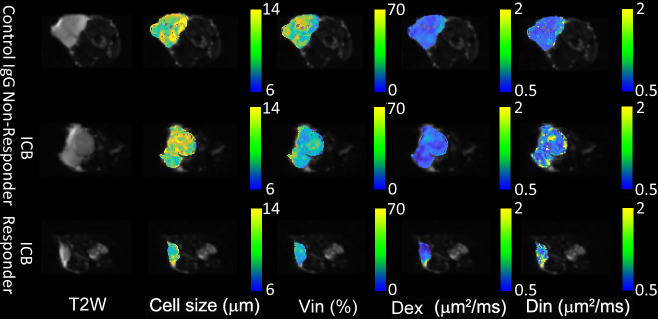
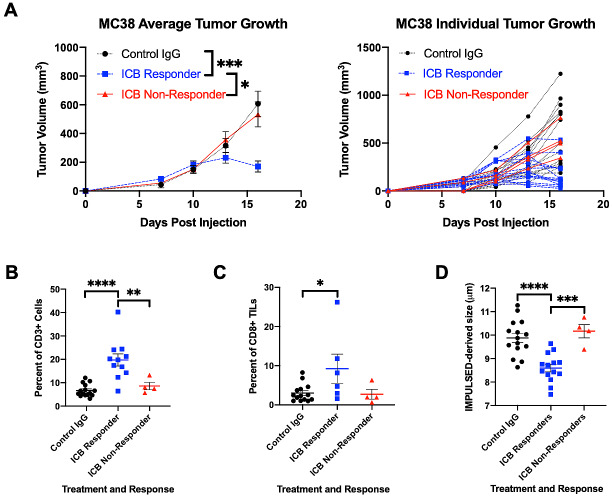
Methods: We validated our hypothesis by studying tumor response to combination immune-checkpoint blockade (ICB) of anti-PD-1 and anti-CTLA4 in a mouse model of colon adenocarcinoma (MC38). The response was monitored longitudinally using Imaging Microstructural Parameters Using Limited Spectrally Edited Diffusion (IMPULSED), a diffusion MRI-based method which has been previously shown to non-invasively map changes in intracellular structure and cell sizes with the spatial resolution of MRI, in cell cultures and in animal models. Tumors were collected for immunohistochemical and flow cytometry analyzes immediately after the last imaging session.

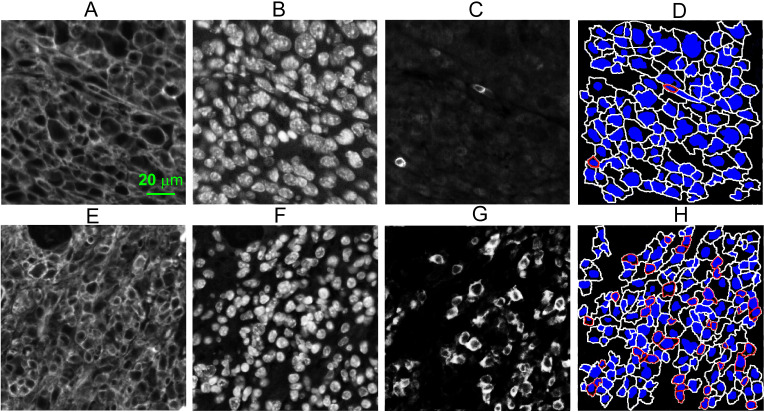
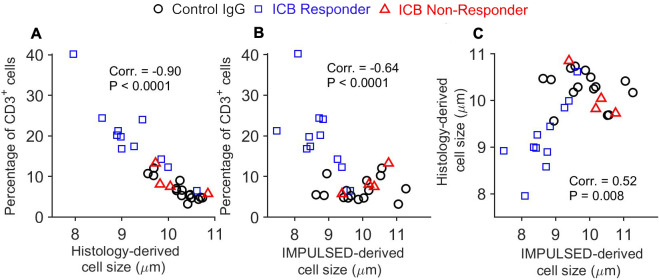
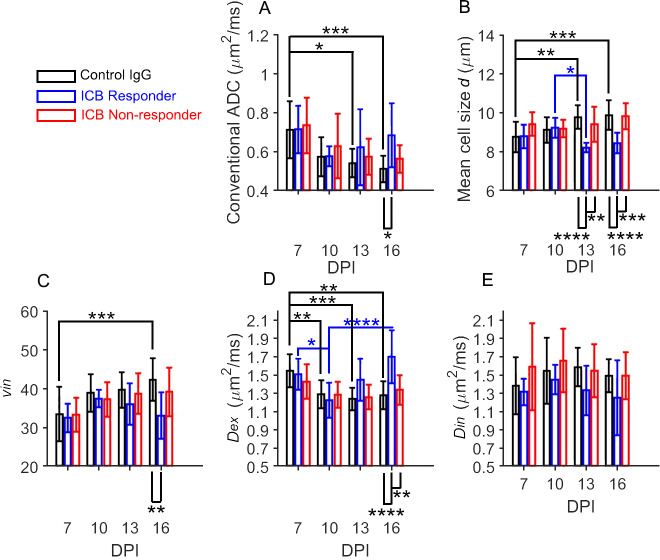
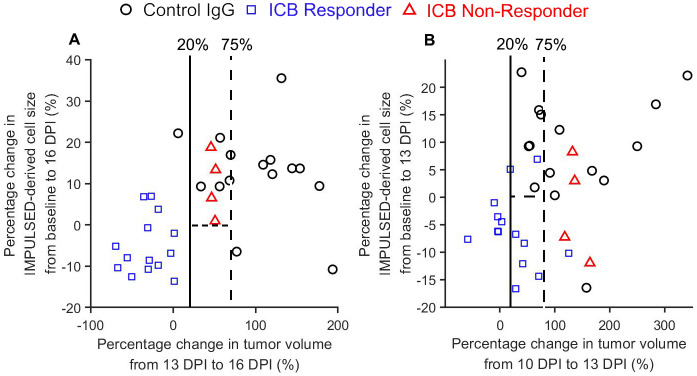
Results: Immunohistochemical analysis revealed that increased T cell infiltration of the tumors results in a decrease in mean cell size (eg, a 10% increase of CD3+ T cell fraction results a ~1 µm decrease in the mean cell size). IMPULSED showed that the ICB responders, mice with tumor volumes were less than 250 mm3 or had tumors with stable or decreased volumes, had significantly smaller mean cell sizes than both Control IgG-treated tumors and ICB non-responder tumors.

Conclusions: IMPULSED-derived cell size could potentially serve as an imaging marker for differentiating responsive and non-responsive tumors after checkpoint inhibitor therapies, a current clinical challenge that is not solved by simply monitoring tumor growth.

Keywords: MRI; immunology; physics; tumors.


Conflict of interest statement

Competing interests: None declared.

Figures

Figure 1
Figure 1
Typical normalized DW signals (mean±SD) for a single slice from a control IgG-treated tumor. The solid lines represent fits using the IMPULSED signal model. DW, diffusion-weighted; IMPULSED, Microstructural Parameters Using Limited Spectrally Edited Diffusion; OGSE, oscillating gradient spin echo; PGSE, pulsed gradient spin echo.
Figure 2
Figure 2
Representative T2-weighted images and parametric maps of cell size d, vin, Dex, and Din for control IgG treated, ICB non-responder, and ICB Responder tumors, respectively, at 16 DPI. ICB, immune-checkpoint blockade.
Figure 3
Figure 3
(A) Average (left) and individual (right) tumor volume of MC38 colon cancer tumors subcutaneously inoculated in 7–8 week-old C57BL/6 female mice and treated with either control IgG-treated (n=15) or combination immune-checkpoint blockade (ICB) of anti-PD-1 and anti-CTLA4 (n=18) as measured by MRI. ICB responders had final tumor volumes <250 mm3 or had tumors with stable or decreased volumes. tumor volumes depicted as mean±SE error of mean. (B) Tumors from ICB responders (n=11) had a significantly higher percent of CD3 +T cells as measured by immunohistochemistry compared with ICB non-responders (n=4) and control IgG-treated mice (n=15). (C) Tumors from ICB responders had a significantly higher percent of cytotoxic CD8+TILs as measured by flow cytometry analysis compared with control IgG-treated mice. (D) ICB responding tumors had a significantly smaller mean cell size as measured by impulse than tumors from control or ICB non-responders. Two-way ANOVA with Tukey post hoc test. P values used. *P<0.05, ***P<0.001, ****p<0.0001 as measured by two-way ANOVA for (B–D). ANOVA, analysis of variance; IMPULSED, Microstructural Parameters Using Limited Spectrally Edited Diffusion; TILs, tumor infiltrating lymphocytes.
Figure 4
Figure 4
Examples of immunohistochemical analyzes of MC38 tumors treated with either control IgG (A–D) or checkpoint inhibitors (E–H). (A, E) Fluorescence images of Na+/K+-ATPase stained MC38 tumor cells; (B, F) fluorescence images of DAPI stained MC38 tumor cells; (C, G) fluorescence images of CD3 stained T cells; (D, H) segmented cells with blue nuclei and T cells outlined in red or tumor cells outlined in white.
Figure 5
Figure 5
(A) Correlation between histology-derived cell sizes and percentage of CD3+ cells; (B) Correlation between IMPULSED-derived cell sizes and percentage of CD3+ cells; (C) correlation between histology-derived cell sizes and IMPULSED-derived apparent cell sizes. ICB, immune-checkpoint blockade; IMPULSED, Microstructural Parameters Using Limited Spectrally Edited Diffusion.
Figure 6
Figure 6
Temporal changes measured by conventional DWI and IMPULSED after either control IgG-treatment or dual ICB treatment in MC38 tumor models, including conventional ADC and IMPULSED-derived parameters (d, vin, Din, and Dex). *P<0.05, **P<0.01, ***P<0.001, ****P<0.0001, as measured by two-way repeated-measures analysis of variance with a Tukey post-hoc test. ADC, Apparent Diffusion Coefficient; DWI, diffusion weighted imaging; ICB, immune-checkpoint blockade; IMPULSED, Microstructural Parameters Using Limited Spectrally Edited Diffusion.
Figure 7
Figure 7
Scatter plots of the percentage changes in tumor volume and IMPULSED-derived cell size for control IgG-treated, ICB responders, and ICB non-responders. ICB, immune-checkpoint blockade; IMPULSED, Microstructural Parameters Using Limited Spectrally Edited Diffusion.

References

    1. Pardoll DM. The blockade of immune checkpoints in cancer immunotherapy. Nat Rev Cancer 2012;12:252–64. 10.1038/nrc3239 - DOI - PMC - PubMed
    1. Hodi FS, Ballinger M, Lyons B, et al. . Immune-Modified response evaluation criteria in solid tumors (imRECIST): refining guidelines to assess the clinical benefit of cancer immunotherapy. J Clin Oncol 2018;36:850–8. 10.1200/JCO.2017.75.1644 - DOI - PubMed
    1. Seymour L, Bogaerts J, Perrone A, et al. . iRECIST: guidelines for response criteria for use in trials testing immunotherapeutics. Lancet Oncol 2017;18:E242 10.1016/S1470-2045(17)30074-8 - DOI - PMC - PubMed
    1. Haslam A, Prasad V. Estimation of the percentage of US patients with cancer who are eligible for and respond to checkpoint inhibitor immunotherapy drugs. JAMA Netw Open 2019;2:e192535. 10.1001/jamanetworkopen.2019.2535 - DOI - PMC - PubMed
    1. Chiou VL, Burotto M, Pseudoprogression BM. Pseudoprogression and immune-related response in solid tumors. J Clin Oncol 2015;33:3541–3. 10.1200/JCO.2015.61.6870 - DOI - PMC - PubMed

Publication types

Substances