. 2020 Jun;8(1):e000804.
doi: 10.1136/jitc-2020-000804.

Initial dose of oncolytic myxoma virus programs durable antitumor immunity independent of in vivo viral replication

Affiliations

Initial dose of oncolytic myxoma virus programs durable antitumor immunity independent of in vivo viral replication

Erica B Flores et al. J Immunother Cancer. 2020 Jun.

Abstract

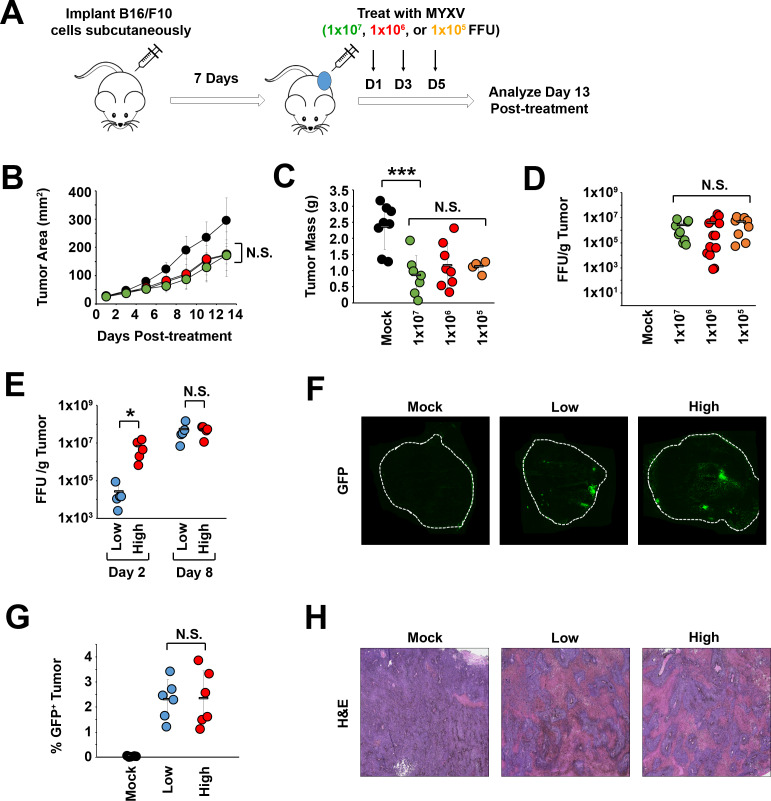
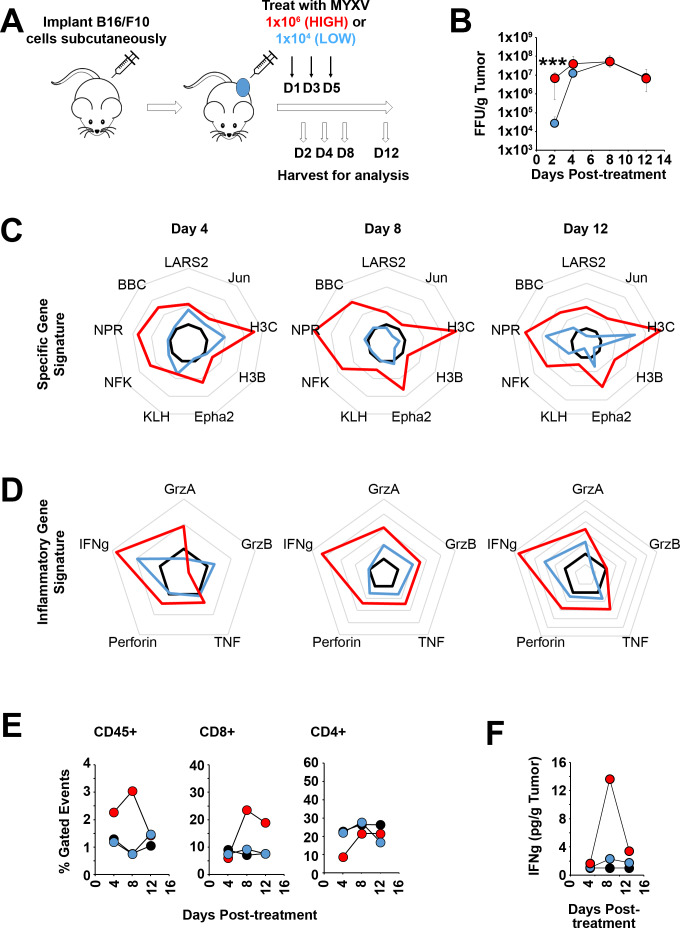
Background: Oncolytic therapy uses live-replicating viruses to improve the immunological status of treated tumors. Critically, while these viruses are known to self-amplify in vivo, clinical oncolytic therapies still appear to display a strong dose dependence and the mechanisms mediating this dose dependence are not well understood.

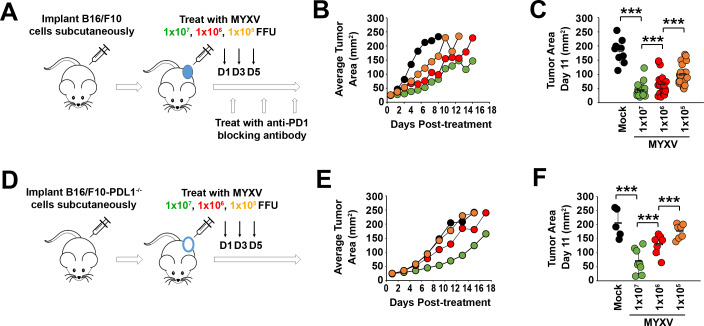
Methods: To explore this apparent contradiction, we investigated how the initial dose of oncolytic myxoma virus affected the subsequent ability of treatment to alter the immunological status of tumors as well as synergize with programmed cell death protein 1 (PD1) blockade.

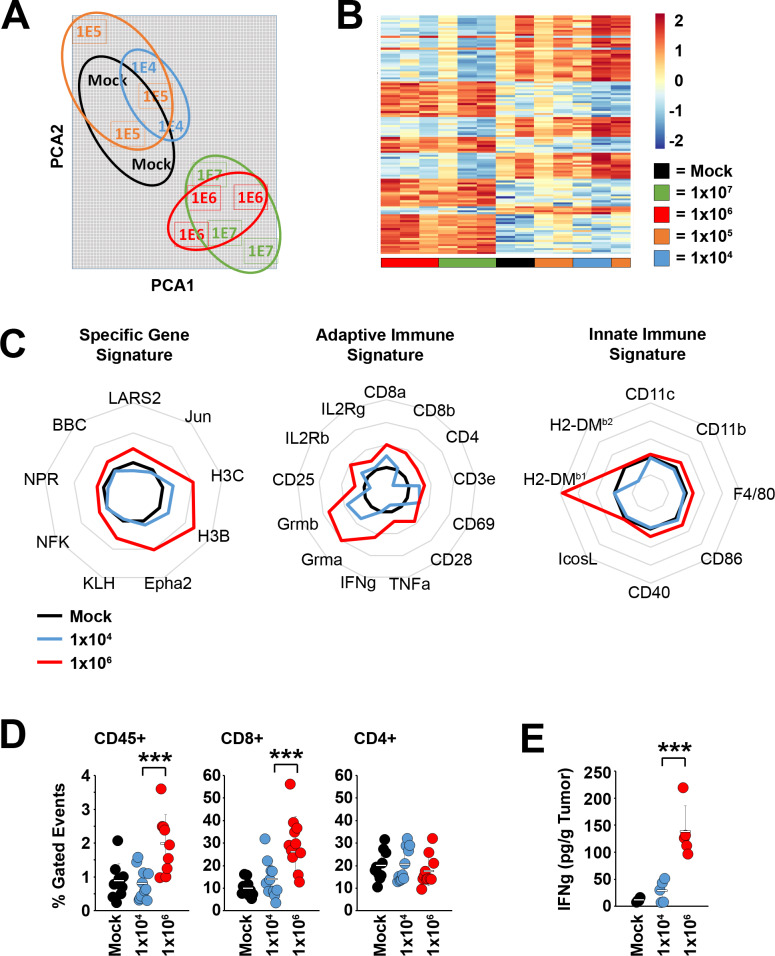
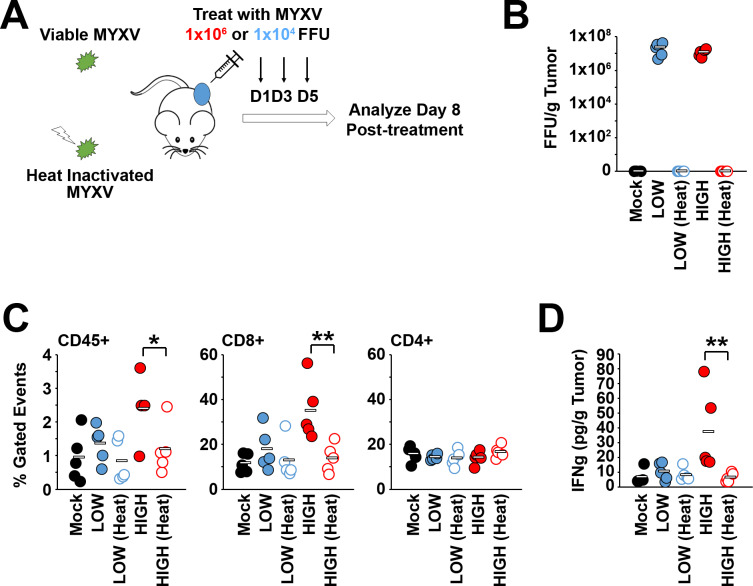
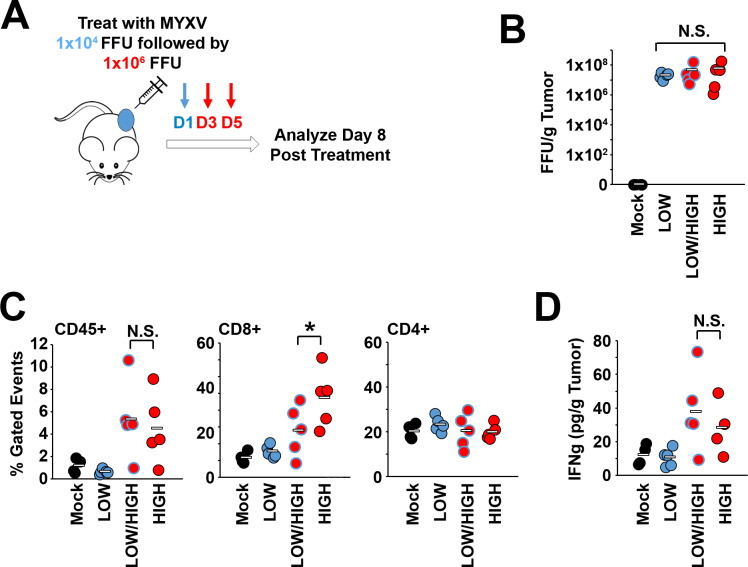
Results: Our results indicate that, due to viral self-amplification in vivo, the overall load of myxoma virus rapidly normalizes within treated tumors despite up to 3-log differences in inoculating dose. Because of this, therapeutic efficacy in the absence of checkpoint blockade is largely dose independent. Despite this rapid normalization, however, treatment with high or low doses of myxoma virus induces distinct immunological changes within treated tumors. Critically, these changes appear to be durably programmed based on the initial oncolytic dose with low-dose treatment failing to induce immunological improvements despite rapidly achieving equivalent viral burdens. Finally, due to the distinct immunological profiles induced by high and low myxoma virus doses, oncolytic efficacy resulting from combination with PD1 blockade therapy displays a strong dose dependence.

Conclusions: Taken together, these data suggest that the ability of oncolytic myxoma virus to immunologically reprogram treated tumors is dependent on initial viral dose. Additionally, this work could provide a possible mechanistic explanation for clinical results observed with other oncolytic viruses.

Keywords: oncolytic virotherapy; oncolytic viruses.


Conflict of interest statement

Competing interests: None declared.

Figures

Figure 1
Figure 1
Total load of oncolytic virus normalizes in vivo independent of initial dose. (A) Schematic diagram of experimental design. C57/B6 mice were injected subcutaneously with B16/F10 cells. Once tumors reached ~25 mm2, animals were either mock treated (n=8) or treated with three intratumorous injections of either 1×10⁷ (n=7), 1×10⁶ (n=8), or 1×10⁵ (n=8) foci forming units (FFU) of myxoma virus (MYXV). (B) Average tumor area (mm2) for each treatment over time. (C) Total tumor mass on day 13. (D) Quantitation of infectious virus in each tumor. Data are normalized to tumor mass and displayed as FFU/gram tissue. (E–H) Tumors were established in mice as above and treated with either a high dose (1×10⁶ FFU, n=6) or a low dose (1×10⁴ FFU, n=6) of MYXV. (E) Quantitation of infectious virus in each tumor either 2 days or 8 days after treatment. Data are normalized to tumor mass and displayed as FFU/gram tissue. (F) Visual depiction of GFP+ viral foci in snap-frozen tumor sections. (G) Quantitation of the number of GFP+ tumor cells presents in each tumor at Day 8. (H) Representative images of H&E-stained tumor sections from each treatment group. Viable tumor is visualized as purple regions while necrotic tumor is visualized as pink. Statistical significance was determined using unpaired Student’s t-test (N.S., *p<0.05, ***p<0.001). N.S., not significant.
Figure 2
Figure 2
Only high-dose oncolytic therapy improves a tumor’s immunological status. Schematic diagram of experimental design. C57/B6 mice were injected subcutaneously with B16/F10 cells. Once tumors reached ~25 mm2, animals were either mock treated or treated with two intratumorous injections of either 1×10⁷, 1×10⁶, 1×10⁵, or 1×10⁴ foci forming units (FFU) of myxoma virus (MYXV) (n=3/group). Tumors were harvested 4 days after initiation of treatment and overall gene expression patterns analyzed using RNAseq. (A) Principle component analysis of resulting gene expression profiles indicating treatments cluster into two distinct groups. (B) Hierarchical clustering analysis of gene expression profiles. (C) Visualization of expression profiles from specific gene clusters in mice treated with either 1×10⁶ or 1×10⁴ FFU of MYXV. Clusters include a unique gene set made up of 10 most significantly altered genes between the two groups, two curated gene sets made up of known molecules involved in adaptive or innate immunity. (D) Abundance of total CD45+ cells, CD8+ T cells, or CD4+ T cells within tumors treated as indicated measured by flow cytometry. (E) Abundance of the T-cell effector molecule interferon-γ within tumors treated as indicated measured by ELISA. Statistical significance was determined using unpaired Student’s t-test (***p<0.001). IFNg, interferon gamma.
Figure 3
Figure 3
Heat-inactivated mxyoma virus (MXYV) is not sufficient to improve the immunological status of tumors. (A) Schematic diagram of experimental design. C57/B6 mice were injected subcutaneously with B16/F10 cells. Once tumors reached ~25 mm2, animals were either mock treated or treated with three intratumorous injections of either a high dose (1×10⁶ foci forming units (FFU)) or low dose (1×10⁴ FFU) of live or heat-inactivated MYXV (n=5/group). Tumors were harvested 8 days after initiation of treatment for analysis. (B) Quantitation of infectious virus in each tumor. Data are normalized to tumor mass and displayed as FFU/gram tissue. (C) Abundance of total CD45+ cells, CD8+ T cells, or CD4+ T cells within tumors treated as indicated measured by flow cytometry. (D) Abundance of the T-cell effector molecule interferon-γ within tumors treated as indicated measured by ELISA. Statistical significance was determined using unpaired Student’s t-test (*p<0.05, **p<0.01). IFNg, interferon gamma.
Figure 4
Figure 4
Treatment with low doses of oncolytic virus does not prevent immunological improvement on secondary treatment with high doses. (A) Schematic diagram of experimental design. C57/B6 mice were injected subcutaneously with B16/F10 cells. Once tumors reached ~25 mm2, animals were either mock treated, treated with three intratumorous injections of either a high dose (1×10⁶ foci forming units (FFU)) or low dose (1×10⁴ FFU) of myxoma virus (MYXV) or treated with a single low dose of virus followed by two secondary treatments with high dose (LOW/HIGH) (n=5/group). Tumors were harvested 8 days after initiation of treatment for analysis. (B) Quantitation of infectious virus in each tumor. Data are normalized to tumor mass and displayed as FFU/gram tissue. (C) Abundance of total CD45+ cells, CD8+ T cells or CD4+ T cells within tumors treated as indicated measured by flow cytometry. (D) Abundance of the T-cell effector molecule interferon-γ within tumors treated as indicated measured by ELISA. Statistical significance was determined using unpaired Student’s t-test (*p<0.05, N.S.). IFNg, interferon gamma; N.S., not significant.
Figure 5
Figure 5
Initial oncolytic dose determines a durable immunological program. (A) Schematic diagram of experimental design. C57/B6 mice were injected subcutaneously with B16/F10 cells. Once tumors reached ~25 mm2, animals were either mock treated or treated with three intratumorous injections of either a high (1×10⁶ foci forming units (FFU)) or low (1×10⁴ FFU) oncolytic dose of myxoma virus (MYXV). Tumors were then harvested 2, 4, 8, or 12 days after the initiation of treatment (n=5/time point/dose). (B) Quantitation of infectious virus in each tumor at each time point. Data are normalized to tumor mass and displayed as FFU/gram tissue. (C) Expression of the top 10 most significantly altered genes 4, 8, and 12 days post-treatment measured by quantitative-polylmerase chain reaction (qt-PCR). (D) Expression of a curated gene set made up of known adaptive immune mediators 4, 8, and 12 days post-treatment measured by qt-PCR. (E) Abundance of total CD45+ cells, CD8+ T cells, or CD4+ T cells within tumors treated as indicated at 4, 8, or 12 days post-treatment measured by flow cytometry. (E) Abundance of the T-cell effector molecule interferon-γ within tumors treated as indicated at 4, 8, or 12 days post-treatment measured by ELISA. Statistical significance was determined using unpaired Student’s t-test (***p<0.001). IFNg, interferon gamma.
Figure 6
Figure 6
Efficacy of combined oncolytic virotherapy/programmed cell death protein 1 (PD1) blockade therapy is dose dependent. (A) Schematic diagram of experimental design. C57/B6 mice were injected subcutaneously with B16/F10 cells. Once tumors reached ~25 mm2, animals were either mock treated or treated with three intratumorous injections of 1×10⁷, 1×10⁶, or 1×10⁵ foci forming units (FFU) of myxoma virus (MYXV) (n=10+/group). Animals were subsequently given intraperitoneal injections of PD1-blocking antibody and monitored for tumor burden every other day. (B) Average tumor area (mm2) for each treatment over time. (C) Total tumor area on day 11. (D) Schematic diagram of experimental design. C57/B6 mice were injected subcutaneously with B16/F10-PDL1-/- cells. Once tumors reached ~25 mm2, animals were either mock treated or treated with three intratumorous injections of 1×10⁷, 1×10⁶, or 1×10⁵ FFU of MYXV (n=7+/group) and monitored for tumor burden every other day. (E) Average tumor area (mm2) for each treatment over time. (F) Total tumor area on day 11. Statistical significance was determined using unpaired Student’s t-test (***p<0.001). PDL1, programmed death-ligand 1.

References

    1. Couzin-Frankel J. Breakthrough of the year 2013. cancer immunotherapy. Science 2013;342:1432–3. 10.1126/science.342.6165.1432 - DOI - PubMed
    1. Tomioka N, Azuma M, Ikarashi M, et al. . The therapeutic candidate for immune checkpoint inhibitors elucidated by the status of tumor-infiltrating lymphocytes (TILs) and programmed death ligand 1 (PD-L1) expression in triple negative breast cancer (TNBC). Breast Cancer 2018;25:34–42. 10.1007/s12282-017-0781-0 - DOI - PubMed
    1. Yagi T, Baba Y, Ishimoto T, et al. . PD-L1 expression, tumor-infiltrating lymphocytes, and clinical outcome in patients with surgically resected esophageal cancer. Ann Surg 2019;269:471–8. 10.1097/SLA.0000000000002616 - DOI - PubMed
    1. Popovic A, Jaffee EM, Zaidi N. Emerging strategies for combination checkpoint modulators in cancer immunotherapy. J Clin Invest 2018;128:3209–18. 10.1172/JCI120775 - DOI - PMC - PubMed
    1. Melcher A, Parato K, Rooney CM, et al. . Thunder and lightning: immunotherapy and oncolytic viruses collide. Mol Ther 2011;19:1008–16. 10.1038/mt.2011.65 - DOI - PMC - PubMed

Publication types