. 2020 Aug 17;94(17):e00442-20.
doi: 10.1128/JVI.00442-20. Print 2020 Aug 17.

Interferon Alpha Induces Multiple Cellular Proteins That Coordinately Suppress Hepadnaviral Covalently Closed Circular DNA Transcription

Affiliations

Interferon Alpha Induces Multiple Cellular Proteins That Coordinately Suppress Hepadnaviral Covalently Closed Circular DNA Transcription

Junjun Cheng et al. J Virol. .

Abstract

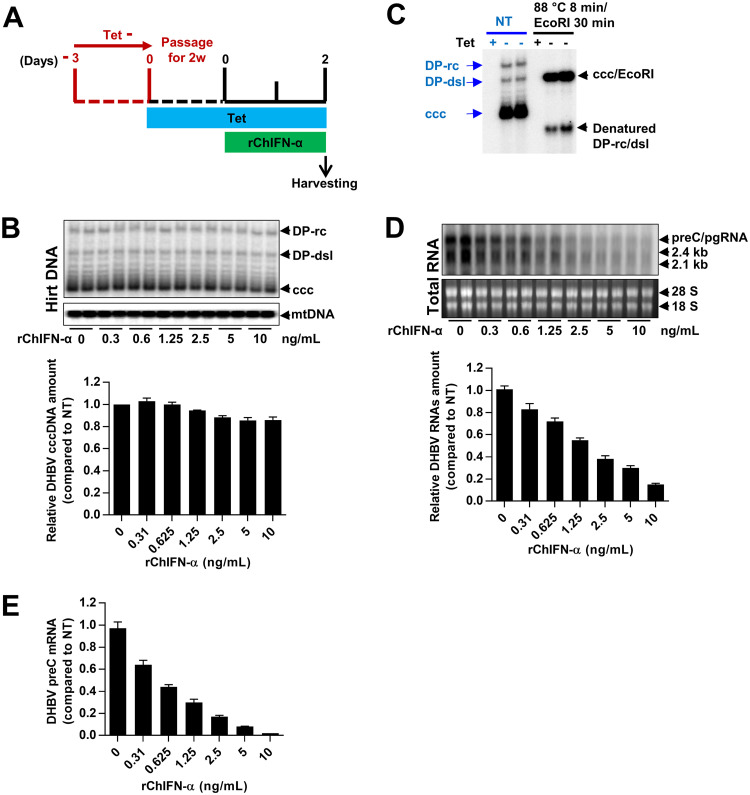
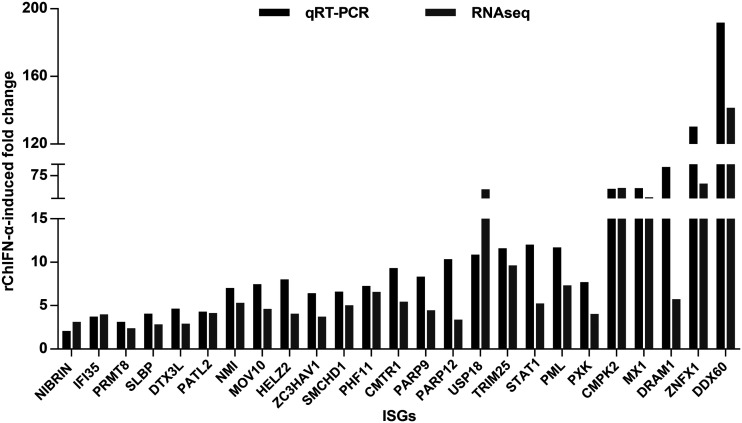
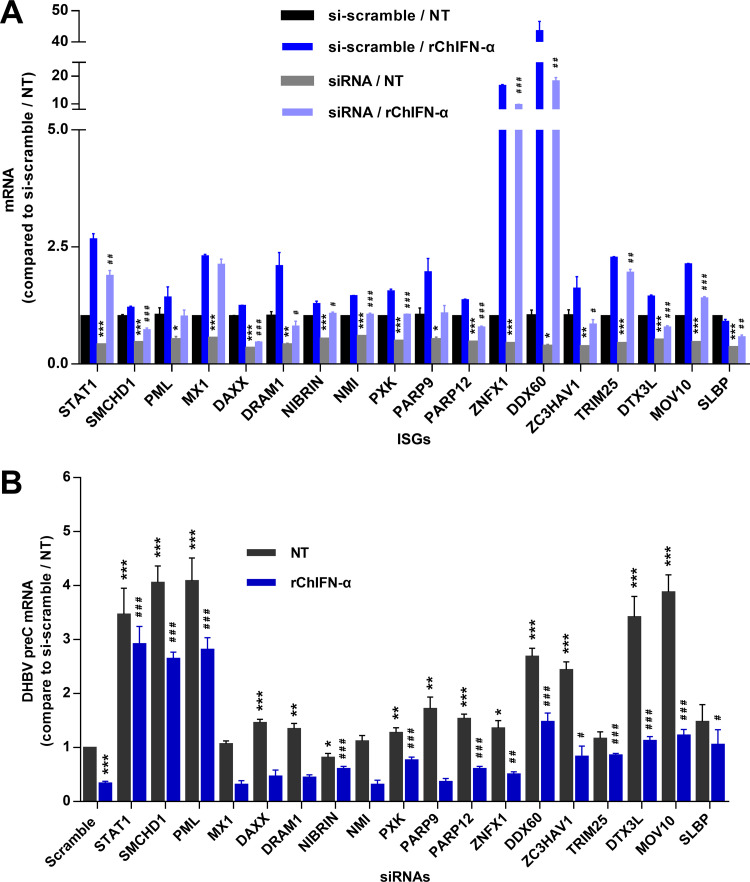
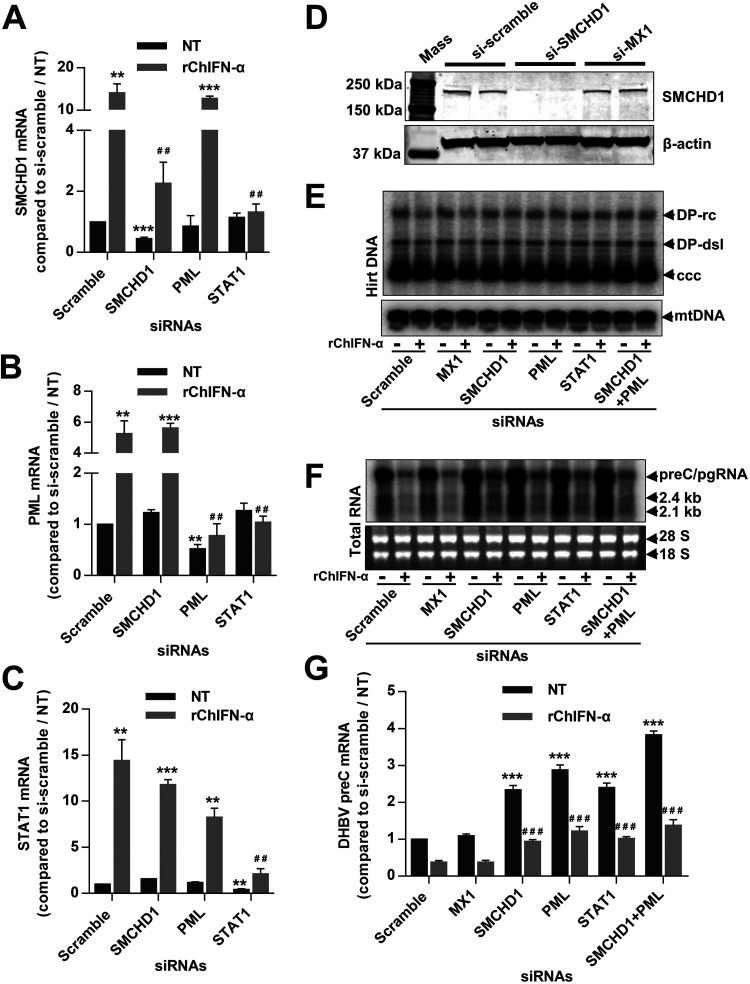
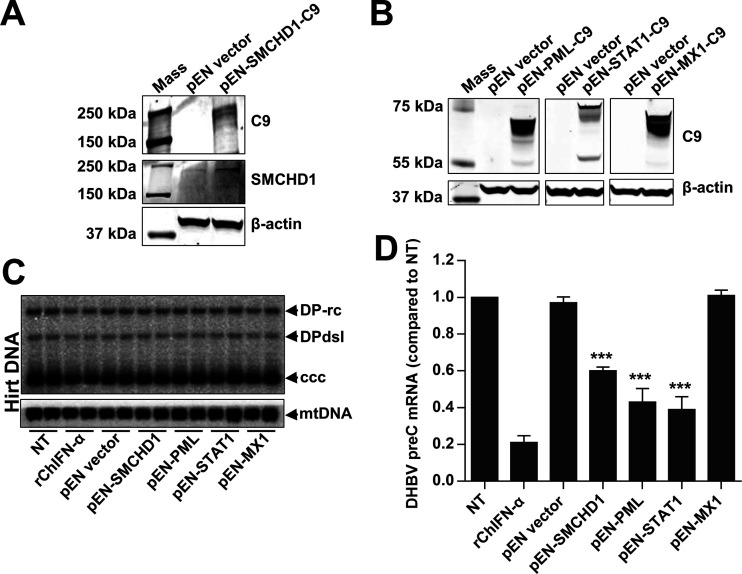
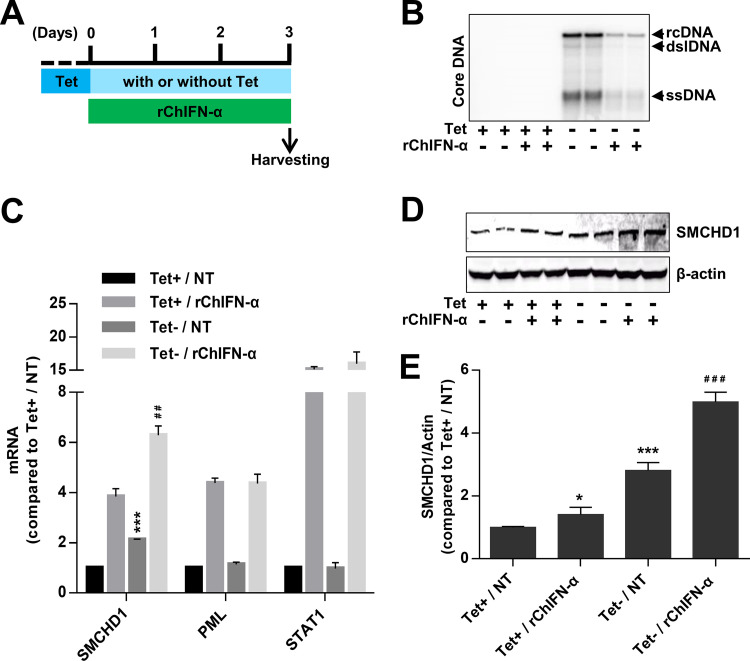
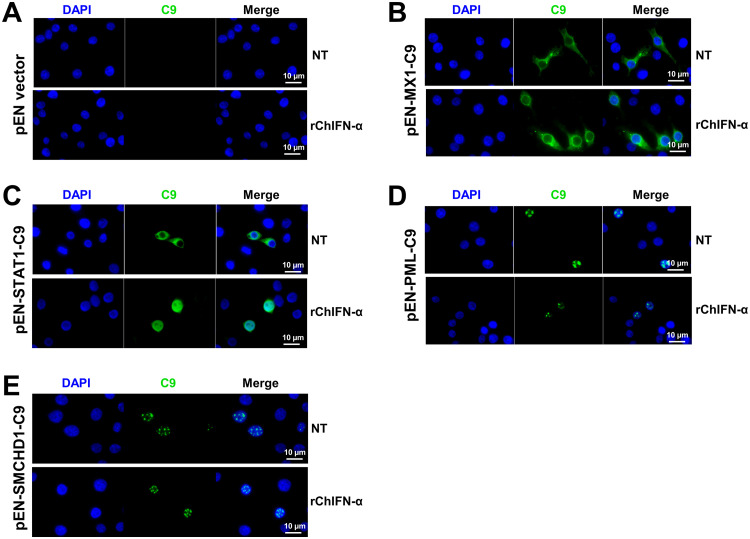
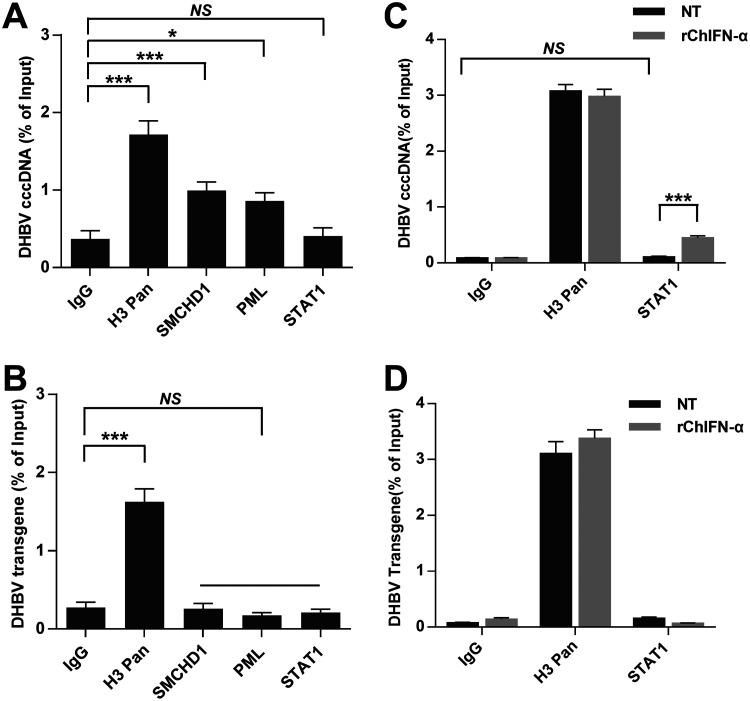
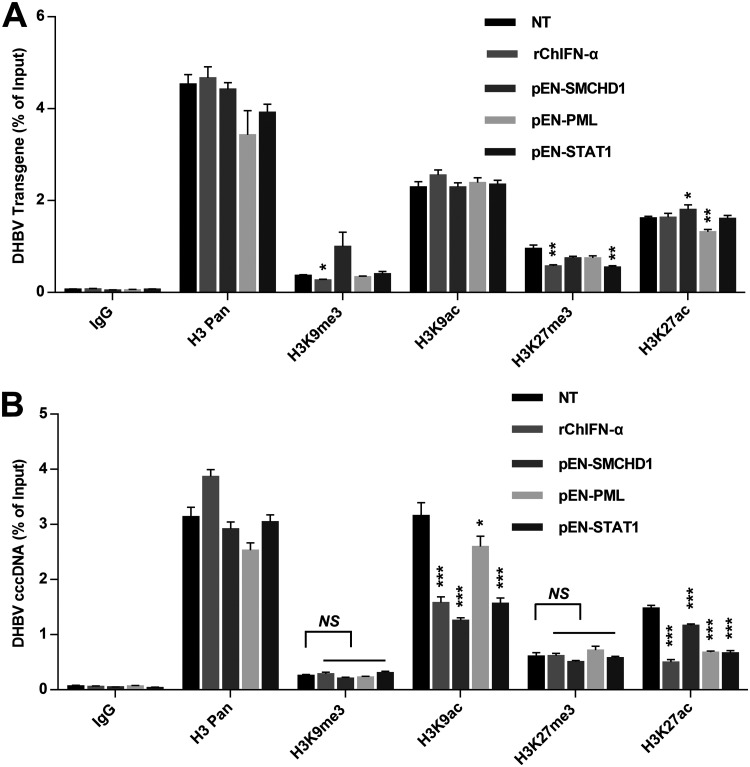
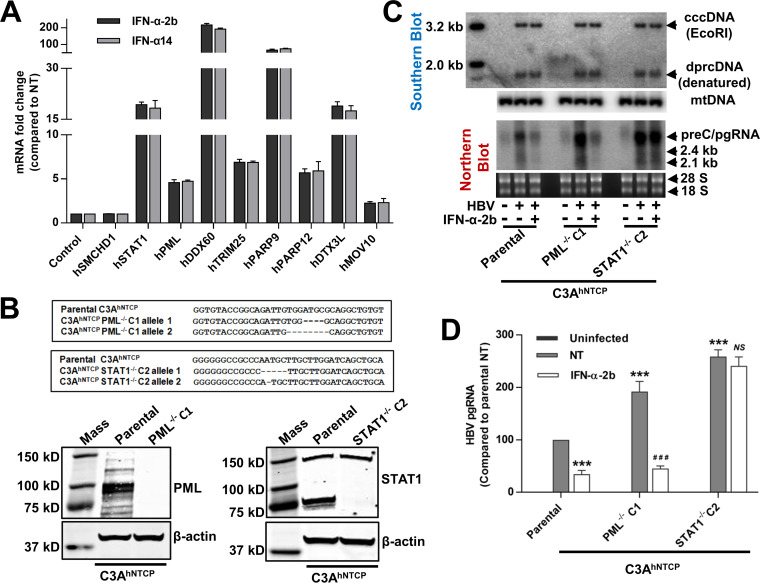
Covalently closed circular DNA (cccDNA) of hepadnaviruses exists as an episomal minichromosome in the nucleus of an infected hepatocyte and serves as the template for the transcription of viral mRNAs. It had been demonstrated by others and us that interferon alpha (IFN-α) treatment of hepatocytes induced a prolonged suppression of human and duck hepatitis B virus cccDNA transcription, which is associated with the reduction of cccDNA-associated histone modifications specifying active transcription (H3K9ac or H3K27ac), but not the histone modifications marking constitutive (H3K9me3) or facultative (H3K27me3) heterochromatin formation. In our efforts to identify IFN-induced cellular proteins that mediate the suppression of cccDNA transcription by the cytokine, we found that downregulating the expression of signal transducer and activator of transcription 1 (STAT1), structural maintenance of chromosomes flexible hinge domain containing 1 (SMCHD1), or promyelocytic leukemia (PML) protein increased basal level of cccDNA transcription activity and partially attenuated IFN-α suppression of cccDNA transcription. In contrast, ectopic expression of STAT1, SMCHD1, or PML significantly reduced cccDNA transcription activity. SMCHD1 is a noncanonical SMC family protein and implicated in epigenetic silencing of gene expression. PML is a component of nuclear domain 10 (ND10) and is involved in suppressing the replication of many DNA viruses. Mechanistic analyses demonstrated that STAT1, SMCHD1, and PML were recruited to cccDNA minichromosomes and phenocopied the IFN-α-induced posttranslational modifications of cccDNA-associated histones. We thus conclude that STAT1, SMCHD1, and PML may partly mediate the suppressive effect of IFN-α on hepadnaviral cccDNA transcription.IMPORTANCE Pegylated IFN-α is the only therapeutic regimen that can induce a functional cure of chronic hepatitis B in a small, but significant, fraction of treated patients. Understanding the mechanisms underlying the antiviral functions of IFN-α in hepadnaviral infection may reveal molecular targets for development of novel antiviral agents to improve the therapeutic efficacy of IFN-α. By a loss-of-function genetic screening of individual IFN-stimulated genes (ISGs) on hepadnaviral mRNAs transcribed from cccDNA, we found that downregulating the expression of STAT1, SMCHD1, or PML significantly increased the level of viral RNAs without altering the level of cccDNA. Mechanistic analyses indicated that those cellular proteins are recruited to cccDNA minichromosomes and induce the posttranslational modifications of cccDNA-associated histones similar to those induced by IFN-α treatment. We have thus identified three IFN-α-induced cellular proteins that suppress cccDNA transcription and may partly mediate IFN-α silencing of hepadnaviral cccDNA transcription.

Keywords: cccDNA; hepatitis B virus; interferons; transcription.


Figures

FIG 1
FIG 1
Recombinant chicken IFN-α inhibits DHBV cccDNA transcription in a dose-dependent manner. (A) A schematic presentation of experimental schedule. Briefly, dstet5 cells were cultured in the absence of tetracycline (tet) for 3 days and tet (1 μg/ml) was then added back into culture medium to stop pgRNA transcription from the transgene. The cells were cultured for more than 2 weeks to generate the cells in which viral DNA replication was solely supported by cccDNA; these cells were designated dstet5-CCC cells. To investigate the effects and mechanism of IFN-α on cccDNA transcription, dstet5-CCC cells were treated with 0, 0.3, 0.6, 1.25, 2.5, 5, and 10 ng/ml of recombinant chicken interferon-alpha (rChIFN-α) for 2 days and then harvested for analyses of DHBV cccDNA, mRNAs, and preC mRNA. (B) Hirt DNA was extracted and resolved by agarose gel electrophoresis. DHBV DNA was determined by Southern blot hybridization with an [α-32P]UTP-labeled full-length positive-sense RNA probe. mtDNA served as a loading control. The intensities of cccDNA and mtDNA bands in different treatment conditions were quantified by ImageJ. The amounts of cccDNA were normalized to mtDNA and are presented as relative amount in comparison with that in the mock-treated (NT) cells (lower portion). (C) Hirt DNA without prior treatment or restricted with EcoRI after denaturalization at 88°C for 8 min was resolved by agarose gel electrophoresis. DHBV DNA was determined by Southern blot hybridization with an [α-32P]UTP-labeled full-length positive-sense RNA probe. Dp-rc, deproteinized relaxed circular DNA; DP-dsl, deproteinized double-stranded linear DNA; cccDNA, covalently closed circular DNA; mtDNA, mitochondrial DNA. (D) DHBV RNAs were determined by Northern blot hybridization with an [α-32P]UTP-labeled full-length negative-sense RNA probe. rRNAs served as loading controls (upper portion). The intensities of DHBV RNA bands under different treatment conditions were quantified by ImageJ and normalized to rRNAs and are presented as relative amount in comparison with that in the mock-treated cells (lower portion). preC/pgRNA specifying both preC mRNA and pgRNA and 2.1- and 2.4-kb mRNA specifying small and large envelope protein are indicated. 28S and 18S rRNAs served as loading controls. (E) DHBV preC mRNA was determined by qRT-PCR assay. The level of preC mRNA was normalized to β-actin mRNA and is expressed as a fraction of that in the mock-treated cells. Means ± standard deviations are presented (n = 6 from three independent experiments).
FIG 2
FIG 2
qRT-PCR and RNA-seq results consistently demonstrated the induction of selected ISGs by rChIFN-α. dstet5 cells were mock treated or treated with 10 ng/ml of rChIFN-α for 6 h. Total intracellular RNAs were then extracted for RNA-seq and qRT-PCR assays. The levels of ISG mRNA determined by qRT-PCR assay were normalized to β-actin mRNA and are expressed as the fold over that of the mock-treated control. The fold induction of ISGs by IFN-α obtained from RNA-seq and qRT-PCR assays is plotted.
FIG 3
FIG 3
Identification of eight ISGs that may mediate IFN-α-induced reduction of DHBV RNA. dstet5-CCC cells were transfected with scramble siRNA or siRNAs targeting a desired ISG mRNA. At 24 h posttransfection, the cells were mock treated or treated with 10 ng/ml of rChIFN-α for an additional 48 h and total intracellular RNAs were extracted. The levels of ISG mRNA (A) and DHBV preC mRNA (B) were quantified by qRT-PCR and normalized to β-actin mRNA. The amounts of ISG and preC mRNA were expressed as the fold over that in mock-treated cells transfected with scramble siRNA. Means ± standard deviations are presented (n= 3 for panel A, from one representative experiment; n = 4 for panel B, from two independent experiments). *, P < 0.05; **, P < 0.01; ***, P < 0.001 versus si-scramble/NT. #, P < 0.05; ##, P < 0.01; ###, P < 0.001 versus si-scramble/rChIFN-α.
FIG 4
FIG 4
Silencing of SMCHD1, PML, or STAT1, but not MX1, increases the levels of DHBV RNAs. (A to C) dstet5-CCC cells were transfected with scramble siRNA or siRNAs targeting SMCHD1, PML, or STAT1. After 24 h of transfection, the cells were mock treated or treated with 10 ng/ml of rChIFN-α for an additional 48 h. SMCHD1 (A), PML (B), and STAT1 (C) mRNAs were quantified by qRT-PCR and normalized to β-actin mRNA. The levels of ISG mRNA are expressed as the fold over that in the mock-treated cells transfected with scramble siRNA. Means ± standard deviations are presented (n = 3, from one representative experiment). *, P < 0.05; **, P < 0.01; ***, P < 0.001 versus si-scramble/NT. #, P < 0.05; ##, P < 0.01; ###, P < 0.001 versus si-scramble/rChIFN-α. (D) dstet5 cells were transfected with scramble siRNA or siRNA targeting SMCHD1 or MX1 for 48 h. Total cellular proteins were resolved by SDS-PAGE and transferred onto a PVDF membrane. SMCHD1 was detected by a Western blot assay with an antibody against human SMCHD1. β-Actin served as a loading control. (E to G) dstet5-CCC cells were transfected with scramble siRNA or siRNAs targeting MX1, SMCHD1, PML, or STAT1. At 24 h posttransfection, the cells were mock treated or treated with 10 ng/ml of rChIFN-α for an additional 48 h. (E) Hirt DNA was extracted and DHBV DNA was determined by Southern blot hybridization with an [α-32P]UTP-labeled full-length positive-sense RNA probe. mtDNA served as a loading control. (F) DHBV RNAs were detected by Northern blot hybridization with an [α-32P]UTP-labeled full-length negative-sense RNA probe. rRNAs served as loading controls. (G) DHBV preC mRNA was quantified by qRT-PCR assay and normalized to β-actin mRNA. The level of preC mRNA is expressed as the fold over that in mock-treated cells transfected with scramble siRNA. Means ± standard deviations are presented (n = 3, from three independent experiments). ***, P < 0.001 versus si-scramble/NT. ###, P < 0.001 versus si-scramble/rChIFN-α.
FIG 5
FIG 5
Ectopic expression of SMCHD1, PML, or STAT1, but not MX1, suppresses DHBV cccDNA transcription. dstet5-CCC cells were mock transfected or transfected with a vector plasmid (pEntry) or a plasmid expressing SMCHD1 (pEN-SMCHD1-C9), PML (pEN-PML-C9), STAT1 (pEN-STAT1-C9), or MX1 (pEN-MX1-C9). At 24 h posttransfection, the transfected cells were mock treated or treated with 10 ng/ml of rChIFN-α. The cells were harvested at 72 h posttransfection. (A and B) Ectopic expression of SMCHD1 (A) and PML, STAT1, and MX1 (B) in the transfected cells was determined by Western blot assays with an antibody against human rhodopsin (C9 tag) or SMCHD1-specific antibody. β-Actin served as a loading control. (C) Hirt DNA was extracted and DHBV DNA was determined by Southern blot hybridization. mtDNA served as a loading control. (D) DHBV preC mRNA was quantified by qRT-PCR assay and normalized to β-actin mRNA. The level of preC mRNA is expressed as the fold over that in mock-treated cells. Means ± standard deviations are presented (n = 3, from three independent experiments). ***, P < 0.001 versus that in cells transfected with pEN vector.
FIG 6
FIG 6
DHBV replication induces the expression of SMCHD1. (A) A schematic presentation of the experimental schedule. Briefly, dstet5 cells were mock treated or treated with 10 ng/ml of rChIFN-α for 3 days in the presence or absence of 1 μg/ml of tet. Cells were then harvested for analyses. (B) DHBV core DNA was detected by Southern blot hybridization. RC, relaxed circular DNA; DSL, double-stranded linear DNA; SS, single-stranded DNA. (C) Expression of SMCHD1, PML, STAT1, or MX1 mRNA was quantified by qRT-PCR assays. The levels of ISG mRNA were normalized to β-actin mRNA and are expressed as the fold of that in mock-treated cells cultured in the presence of tet. Means ± standard deviations are presented (n = 4, from two independent experiments). ***, P < 0.001 versus tet +/NT. ##, P < 0.01 versus tet +/rChIFN-α. (D) SMCHD1 protein was detected by Western blot assay with antibody against human SMCHD1. β-Actin served as a loading control. (E) The intensity of SMCHD1 bands was quantified by ImageJ and the amounts of SMCHD1 protein under the different treatment conditions were normalized by β-actin and are expressed as the fold of that in mock-treated cells cultured in the presence of tet. Means ± standard deviations are presented (n = 4, from four independent experiments). *, P < 0.05; ***, P < 0.001 versus tet +/NT. ###, P < 0.001 versus tet +/rChIFN-α.
FIG 7
FIG 7
Nuclear localization of STAT1, but not SMCHD1 and PML, is IFN-α treatment dependent. dstet5 cells were transfected with a vector plasmid (pEntry) (A) or a plasmid expressing MX1 (pEN-MX1-C9) (B), STAT1 (pEN-STAT1-C9) (C), PML (pEN-PML-C9) (D), or SMCHD1 (pEN-SMCHD1-C9) (E). At 48 h posttransfection, the cells were mock treated or treated with 10 ng/ml of rChIFN-α for 1.5 h. The subcellular localizations of SMCHD1, PML, STAT1, and MX1 were determined by immunofluorescence staining with an antibody against human rhodopsin (C9 tag) (green). Nuclei were stained with DAPI (blue).
FIG 8
FIG 8
Recruitment of STAT1, but not SMCHD1 and PML, to the cccDNA minichromosomes is IFN-α treatment dependent. (A and B) dstet5-CCC cells were transfected with a vector plasmid (pEntry) or a plasmid expressing SMCHD1 (pEN-SMCHD1-C9), PML (pEN-PML-C9), or STAT1 (pEN-STAT1-C9). At 48 h posttransfection, the cells were harvested. ChIP assay was performed using antibodies against normal IgG or histone H3-pan from cells transfected with pEntry vector or using C9 tag antibody from cells transfected with the indicated ISG-expressing plasmid. DHBV cccDNA (A) and transgene (B) in the immune complex were quantified by qPCR assays and are expressed as the percentage of input amounts of cccDNA and DHBV transgene, respectively. Means ± standard deviations are presented (n = 3, from three independent experiments). *, P < 0.05; ***, P < 0.001 versus IgG. NS, no significance versus IgG. (C and D) dstet5-CCC cells were transfected with a vector plasmid (pEntry) or a plasmid expressing STAT1 (pEN-STAT1-C9). At 42 h posttransfection, cells were mock treated or treated with 10 ng/ml of rChIFN-α for 6 h and then harvested for ChIP assay using antibodies against normal IgG, histone H3-pan, or C9 tag as described above for panels A and B. DHBV cccDNA (C) and transgene (D) in the immune complexes were quantified by qPCR and are expressed as the percentage of input amounts of cccDNA and DHBV transgene, respectively. Means ± standard deviations are presented (n = 3, from three independent experiments). ***, P < 0.001 versus NT.
FIG 9
FIG 9
Overexpression of STAT1, SMCHD1, or PML significantly reduces the cccDNA-associated histone H3K9ac or H3K27ac but does not alter H3K9me3 or H3K27me3. dstet5-CCC cells were mock treated, treated with 10 ng/ml of rChIFN-α, or transfected with plasmid expressing SMCHD1 (pEN-SMCHD1-C9), PML (pEN-PML-C9), or STAT1 (pEN-STAT1-C9). At 48 h of treatment or transfection, the cells were harvested and subjected for ChIP assay using antibodies against normal IgG, histone H3-pan, H3K9me3, H3K9ac, H3K27me3, or H3K27ac. DHBV transgene (A) and cccDNA (B) in the immune complexes were quantified by qPCR and are expressed as the percentage of input amounts of DHBV transgene and cccDNA, respectively. Means ± standard deviations are presented (n = 3, from three independent experiments). *, P < 0.05; ***, P < 0.001 versus NT. NS, no significance versus NT.
FIG 10
FIG 10
Depletion of STAT1 or PML increases de novo HBV cccDNA transcription in C3AhNTCP cells. (A) Induction of selected ISGs in C3AhNTCP cells by IFN-α-2b and IFN-α14. C3AhNTCP cells were mock treated or treated with 1,000 IU/ml of IFN-α-2b or 100 IU/ml of IFN-α14 for 6 h. Total intracellular RNA were extracted and ISG mRNAs were quantified by qRT-PCR assays. The levels of ISG mRNAs were normalized to β-actin mRNA and are expressed as the fold of that in mock-treated cells. Means ± standard deviations are presented (n = 3). (B) Genetic validation of knockout. The wild-type sequence is shown at the top and deletions are shown as dashed lines. Expression of PML (left) or STAT1 (right) in parental C3AhNTCP and PML−/− or STAT−/− C3AhNTCP cell lines were determined by Western blot assays. β-Actin served as a loading control. (C and D) Parental, PML−/−, or STAT1−/− C3AhNTCP cells pretreated with 2% DMSO for 18 h were inoculated with HBV at an MOI of 250 genome equivalents for 24 h. Starting from infection, the cells were mock treated or treated with 500 IU/ml of IFN-α-2b. On day 8 postinfection, the cells were harvested for extraction of Hirt DNA and total intracellular RNA. Hirt DNA was resolved by 1.5% native agarose gel electrophoresis after denaturalization at 88°C for 8 min and digestion with EcoRI to linearize cccDNA, and HBV DNA was detected by Southern blot hybridization with an [α-32P]UTP-labeled full-length positive-sense HBV RNA probe. mtDNA served as a loading control (C, upper portion). HBV RNAs were detected by Northern blot hybridization with an [α-32P]UTP-labeled full-length negative-sense HBV RNA probe. rRNAs served as loading controls (C, lower portion). (D) HBV pgRNA was quantified by qRT-PCR and normalized to β-actin mRNA. Means ± standard deviations are presented (n = 3, from three independent experiments). ***, P < 0.001 versus parental/NT. ###, P < 0.001 versus PML−/− C1/NT. NS, no significance versus STAT1−/− C1/NT.

Similar articles

Cited by

References

    1. Block TM, Guo H, Guo JT. 2007. Molecular virology of hepatitis B virus for clinicians. Clin Liver Dis 11:685–706, vii. doi:10.1016/j.cld.2007.08.002. - DOI - PMC - PubMed
    1. Dienstag JL. 2009. Benefits and risks of nucleoside analog therapy for hepatitis B. Hepatology 49:S112–S121. doi:10.1002/hep.22920. - DOI - PubMed
    1. Perrillo R. 2009. Benefits and risks of interferon therapy for hepatitis B. Hepatology 49:S103–111. doi:10.1002/hep.22956. - DOI - PubMed
    1. Block TM, Gish R, Guo H, Mehta A, Cuconati A, Thomas London W, Guo JT. 2013. Chronic hepatitis B: what should be the goal for new therapies? Antiviral Res 98:27–34. doi:10.1016/j.antiviral.2013.01.006. - DOI - PMC - PubMed
    1. Alter H, Block T, Brown N, Brownstein A, Brosgart C, Chang KM, Chen PJ, Chisari FV, Cohen C, El-Serag H, Feld J, Gish R, Glenn J, Greten T, Guo H, Guo JT, Hoshida Y, Hu J, Kowdley KV, Li W, Liang J, Locarnini S, Lok AS, Mason W, McMahon B, Mehta A, Perrillo R, Revill P, Rice CM, Rinaudo J, Schinazi R, Seeger C, Shetty K, Tavis J, Zoulim F. 2018. A research agenda for curing chronic hepatitis B virus infection. Hepatology 67:1127–1131. doi:10.1002/hep.29509. - DOI - PMC - PubMed

Publication types

MeSH terms