

Mass measurements during lymphocytic leukemia cell polyploidization decouple cell cycle- and cell size-dependent growth
- PMID: 32581119
- PMCID: PMC7355023
- DOI: 10.1073/pnas.1922197117
Mass measurements during lymphocytic leukemia cell polyploidization decouple cell cycle- and cell size-dependent growth
Abstract
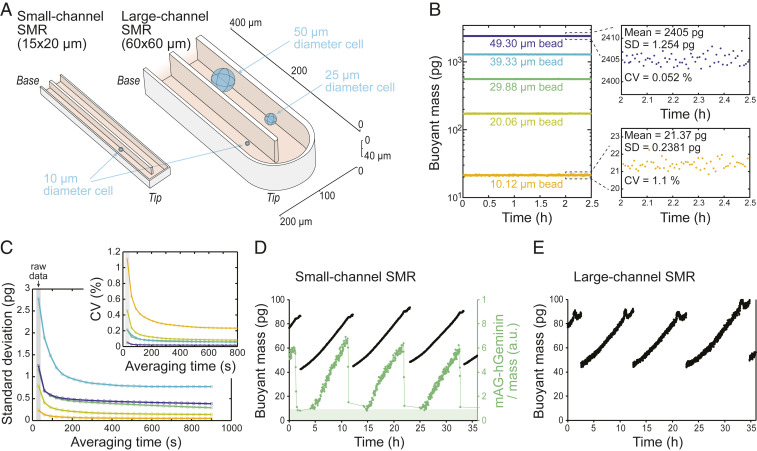
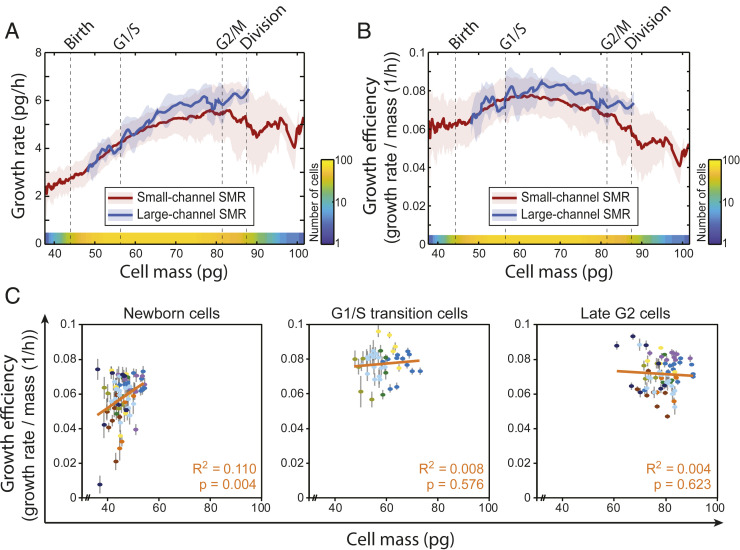
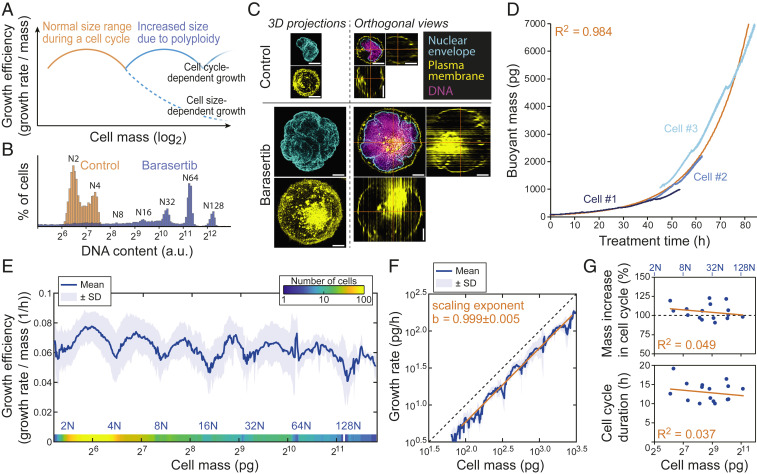
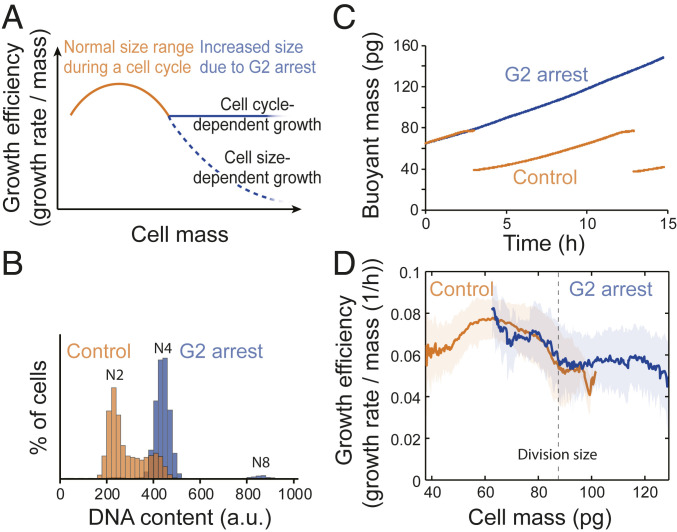
Cell size is believed to influence cell growth and metabolism. Consistently, several studies have revealed that large cells have lower mass accumulation rates per unit mass (i.e., growth efficiency) than intermediate-sized cells in the same population. Size-dependent growth is commonly attributed to transport limitations, such as increased diffusion timescales and decreased surface-to-volume ratio. However, separating cell size- and cell cycle-dependent growth is challenging. To address this, we monitored growth efficiency of pseudodiploid mouse lymphocytic leukemia cells during normal proliferation and polyploidization. This was enabled by the development of large-channel suspended microchannel resonators that allow us to monitor buoyant mass of single cells ranging from 40 pg (small pseudodiploid cell) to over 4,000 pg, with a resolution ranging from ∼1% to ∼0.05%. We find that cell growth efficiency increases, plateaus, and then decreases as cell cycle proceeds. This growth behavior repeats with every endomitotic cycle as cells grow into polyploidy. Overall, growth efficiency changes 33% throughout the cell cycle. In contrast, increasing cell mass by over 100-fold during polyploidization did not change growth efficiency, indicating exponential growth. Consistently, growth efficiency remained constant when cell cycle was arrested in G2 Thus, cell cycle is a primary determinant of growth efficiency. As growth remains exponential over large size scales, our work finds no evidence for transport limitations that would decrease growth efficiency.
Keywords: cell cycle; cell growth; cell size; mass measurement; transport limitation.
Copyright © 2020 the Author(s). Published by PNAS.
Conflict of interest statement
Competing interest statement: S.R.M. is a co-founder of Travera and Affinity Biosensors, which develop technologies that are relevant to the work presented here. S.O. and R.J.K. are also co-founders of Travera. Other authors declare no competing interests.
Figures
Similar articles
-
Probing Mammalian Cell Size Homeostasis by Channel-Assisted Cell Reshaping.Cell Rep. 2017 Jul 11;20(2):397-410. doi: 10.1016/j.celrep.2017.06.057. Cell Rep. 2017. PMID: 28700941
-
Using buoyant mass to measure the growth of single cells.Nat Methods. 2010 May;7(5):387-90. doi: 10.1038/nmeth.1452. Epub 2010 Apr 11. Nat Methods. 2010. PMID: 20383132 Free PMC article.
-
Simultaneous analysis of cell cycle kinetics at two different DNA ploidy levels based on DNA content and cyclin B measurements.Cancer Res. 1993 Nov 1;53(21):5096-9. Cancer Res. 1993. PMID: 8221643
-
On the Molecular Mechanisms Regulating Animal Cell Size Homeostasis.Trends Genet. 2020 May;36(5):360-372. doi: 10.1016/j.tig.2020.01.011. Epub 2020 Feb 20. Trends Genet. 2020. PMID: 32294416 Free PMC article. Review.
-
Genesis of clone size heterogeneity in megakaryocytic and other hemopoietic colonies: the stochastic model revisited.Exp Hematol. 2001 Nov;29(11):1256-69. doi: 10.1016/s0301-472x(01)00728-7. Exp Hematol. 2001. PMID: 11698121 Review.
Cited by
-
Coupling of cell growth modulation to asymmetric division and cell cycle regulation in Caulobacter crescentus.Proc Natl Acad Sci U S A. 2024 Oct 8;121(41):e2406397121. doi: 10.1073/pnas.2406397121. Epub 2024 Oct 3. Proc Natl Acad Sci U S A. 2024. PMID: 39361646 Free PMC article.
-
Gene expression in growing cells: A biophysical primer.ArXiv [Preprint]. 2023 Nov 20:arXiv:2311.12143v1. ArXiv. 2023. PMID: 38045483 Free PMC article. Preprint.
-
Multiparametric quantitative phase imaging for real-time, single cell, drug screening in breast cancer.Commun Biol. 2022 Aug 8;5(1):794. doi: 10.1038/s42003-022-03759-1. Commun Biol. 2022. PMID: 35941353 Free PMC article.
-
Antigen-specific and cross-reactive T cells in protection and disease.Immunol Rev. 2023 Jul;316(1):120-135. doi: 10.1111/imr.13217. Epub 2023 May 20. Immunol Rev. 2023. PMID: 37209375 Free PMC article. Review.
-
Mechanical phenotyping reveals unique biomechanical responses in retinoic acid-resistant acute promyelocytic leukemia.iScience. 2022 Jan 15;25(2):103772. doi: 10.1016/j.isci.2022.103772. eCollection 2022 Feb 18. iScience. 2022. PMID: 35141508 Free PMC article.
References
-
- Cadart C., Venkova L., Recho P., Lagomarsino M. C., Piel M., The physics of cell-size regulation across timescales. Nat. Phys. 15, 993–1004 (2019).
-
- Björklund M., Cell size homeostasis: Metabolic control of growth and cell division. Biochim. Biophys. Acta Mol. Cell Res. 1866, 409–417 (2019). - PubMed
Publication types
MeSH terms
Grants and funding
LinkOut - more resources
Full Text Sources
Other Literature Sources
Medical
Research Materials
