. 2020 Jun 14:26:e924576.
doi: 10.12659/MSM.924576.

Identification of Target Genes and Transcription Factors in Mice with LMNA-Related Dilated Cardiomyopathy by Integrated Bioinformatic Analyses

Affiliations

Identification of Target Genes and Transcription Factors in Mice with LMNA-Related Dilated Cardiomyopathy by Integrated Bioinformatic Analyses

Honghua Zhou et al. Med Sci Monit. .

Abstract

BACKGROUND Dilated cardiomyopathy (DCM), which is characterized by enlarged ventricular dimensions and systolic dysfunction, is the most common type of cardiomyopathy. Mutations in the LMNA gene are reported in approximately 10% of familial DCM cases. However, the mechanism of LMNA mutations in human DCM remains unclear. MATERIAL AND METHODS We used the GSE36502 and GSE123916 datasets to obtain gene expression profiles from LMNA-related DCM mice and to identify differentially expressed genes (DEGs). Crucial function and pathway enrichment analyses of DEGs were performed. Protein-protein interaction (PPI) network analysis was carried out to identify the top 10 hub genes, which were validated using reverse transcription-polymerase chain reaction (RT-PCR) to find target genes. Weighted gene co-expression network analysis (WGCNA) was used to explore the module relevant to external traits of LMNA-related DCM mice. Transcription factors (TFs) for the selected genes were analyzed using NetworkAnalyst. RESULTS A total of 156 common DEGs (co-DEGs) were identified, including 80 up-regulated and 76 down-regulated genes. The enriched biological functions and pathways were oxidative stress, regulation of apoptosis, regulation of fibrosis, and MAPK pathways. Five target genes (Timp1, Hmox1, Spp1, Atf3, and Adipoq) were verified after RT-PCR. Most co-DEGs were discovered to be related to the development of external traits. Three TFs (ELF1, ETS1, and NRF1) showed close interactions with the hub genes. CONCLUSIONS Our study used integrated bioinformatic analyses and revealed some important genes in mice with LMNA-related DCM, which could provide novel insights into the mechanism underlying human LMNA-related DCM.


Conflict of interest statement

Conflict of interest

None.

Figures

Figure 1
Figure 1
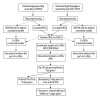
Workflow of data preparation, processing, analysis, and validation.
Figure 2
Figure 2
Venn diagram of common differentially expressed genes (co-DEGs). (A) Venn diagram of up-regulated co-DEGs. (B) Venn diagram of down-regulated co-DEGs.
Figure 3
Figure 3
Functional and pathway enrichment analysis of common differentially expressed genes (co-DEGs). (A) Gene Ontology (GO) analysis results of co-DEGs in biological process (BP), cellular component (CC), and molecular function (MF). (B) Kyoto Encyclopedia of Genes and Genomes (KEGG) pathways analysis results of co-DEGs.
Figure 4
Figure 4
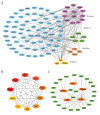
Protein–protein interaction (PPI) network and module analysis among common differentially expressed genes (co-DEGs), and transcriptional factor (TF) regulatory network analysis among key genes. (A) PPI network construction and module analysis of co-DEGs. (B) The top 10 hub nodes (10 “key genes”) in the PPI network of co-DEGs. (C) TF regulatory network analysis of key genes. Genes are depicted as ellipses and TF as rectangles. Disconnected nodes in the network are hidden in (A, C).
Figure 5
Figure 5
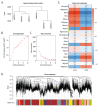
Weighted co-expression network analysis (WGCNA) construction and key module identification of GSE36502. (A) Sample clustering dendrogram. (B, C) Determination of soft-thresholding power in the WGCNA. Analysis of the scale-free fit index for various soft-thresholding powers (B). Analysis of the mean connectivity for various soft-thresholding powers (C). (D) Dendrogram of all DEGs clustered. (E) Heatmap of the association between module genes and traits of LMNA-related DCM mice.
Figure 6
Figure 6
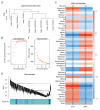
Weighted co-expression network analysis (WGCNA) construction and key module identification of GSE123916. (A) Sample clustering dendrogram. (B, C) Determination of soft-thresholding power in the WGCNA. Analysis of the scale-free fit index for various soft-thresholding powers (B). Analysis of the mean connectivity for various soft-thresholding powers (C). (D) Dendrogram of all clustered DEGs. (E) Heatmap of the association between module genes and traits of LMNA-related DCM mice.
Figure 7
Figure 7
Protein–protein interaction (PPI) network and module analysis in the selected modules with common differentially expressed genes (co-DEGs). (A) Venn diagram of co-DEGs and genes in blue module of GSE36502. (B) The PPI network of overlapped 79 co-DEGs in blue module of GSE36502. The new top 10 nodes are shown in hexagonal shape. Two “key genes” are displayed in orange. (C) Venn diagram of co-DEGs and hub genes in turquoise module of GSE123916. (D) The PPI network of overlapped 143 co-DEGs in turquoise module of GSE123916. The new top 10 nodes are shown in hexagonal shape. Nine key genes are displayed in orange color. Disconnected nodes in the network are hidden in (B, D).
Figure 8
Figure 8
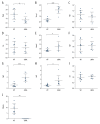
RT-PCR results of 10 key genes. (A) The relative expression of Ptgs2 (WT 1.439±0.529 vs. LMNA 0.819±0.342, p=0.017). (B) The relative expression of Timp1 (WT 0.671±0.156 vs. LMNA 1.553±0.296, p<0.001). (C) The relative expression of Myc (WT 1.050±0.155 vs. LMNA 0.970±0.178, p=0.367). (D) The relative expression of Fos (WT 1.176±0.619 vs. LMNA 1.102±0.610, p=0.812). (E) The relative expression of Hmox1 (WT 0.842±0.143 vs. LMNA 1.281±0.512, p=0.035). (F) The relative expression of Ctgf (WT 1.071±0.513 vs. LMNA 1.099±0.361, p=0.902). (G) The relative expression of Spp1 (WT 0.584±0.338 vs. LMNA 1.876±0.665, p<0.001). (H) The relative expression of Atf3 (WT 0.689±0.233 vs. LMNA 1.721±1.083, p=0.031). (I) The relative expression of Lox (WT 1.006±0.258 vs. LMNA 1.037±0.157, p=0.786). (J) The relative expression of Adipoq (WT 8.873±4.298 vs. LMNA 0.104±0.052, p=0.001). n=7 to 8 mice per group. Mean±standard deviation. 0.01≤ p<0.05 (*), 0.001≤ p<0.01 (**), and p<0.001 (***).

Similar articles

Cited by

References

    1. Hershberger RE, Morales A. LMNA-related dilated cardiomyopathy. In: Adam MP, Ardinger HH, Pagon RA, et al., editors. GeneReviews®. Seattle (WA): University of Washington, Seattle; 1993. - PubMed
    1. Weintraub RG, Semsarian C, Macdonald P. Dilated cardiomyopathy. Lancet. 2017;390:400–14. - PubMed
    1. Arbustini E, Pilotto A, Repetto A, et al. Autosomal dominant dilated cardiomyopathy with atrioventricular block: A lamin A/C defect-related disease. J Am Coll Cardiol. 2002;39:981–90. - PubMed
    1. Xiong Z, Lu Y, Xue J, et al. Hutchinson-Gilford progeria syndrome accompanied by severe skeletal abnormalities in two Chinese siblings: two case reports. J Med Case Rep. 2013;7:63. - PMC - PubMed
    1. Gonzalo S, Kreienkamp R, Askjaer P. Hutchinson-Gilford progeria syndrome: A premature aging disease caused by LMNA gene mutations. Ageing Res Rev. 2017;33:18–29. - PMC - PubMed

MeSH terms

Supplementary concepts