. 2020 Jun 24;11(1):3193.
doi: 10.1038/s41467-020-16890-6.

Chronic circadian disruption modulates breast cancer stemness and immune microenvironment to drive metastasis in mice

Affiliations

Chronic circadian disruption modulates breast cancer stemness and immune microenvironment to drive metastasis in mice

Eva Hadadi et al. Nat Commun. .

Abstract

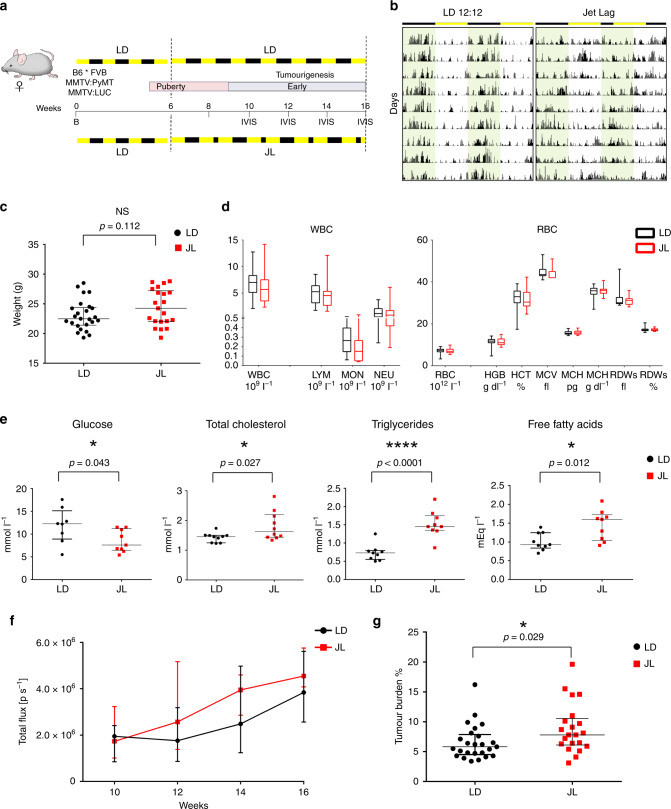
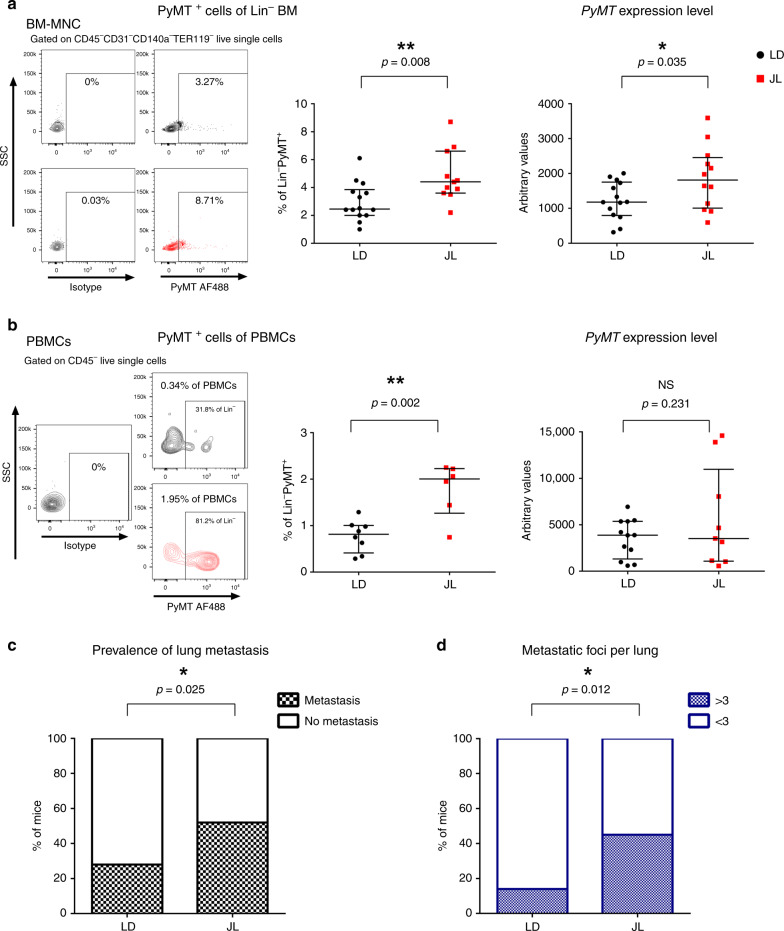
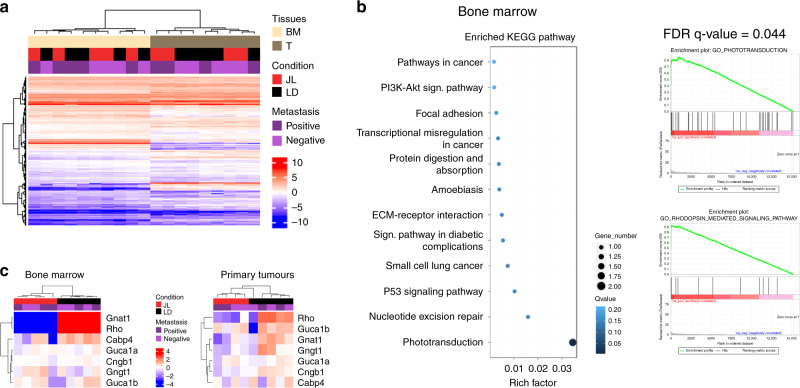
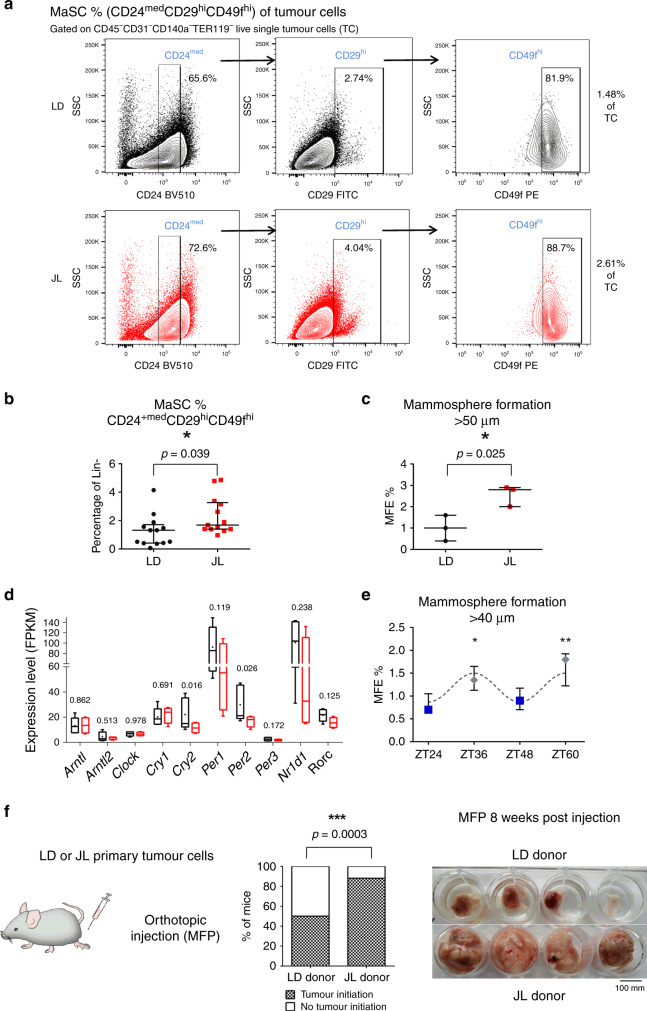
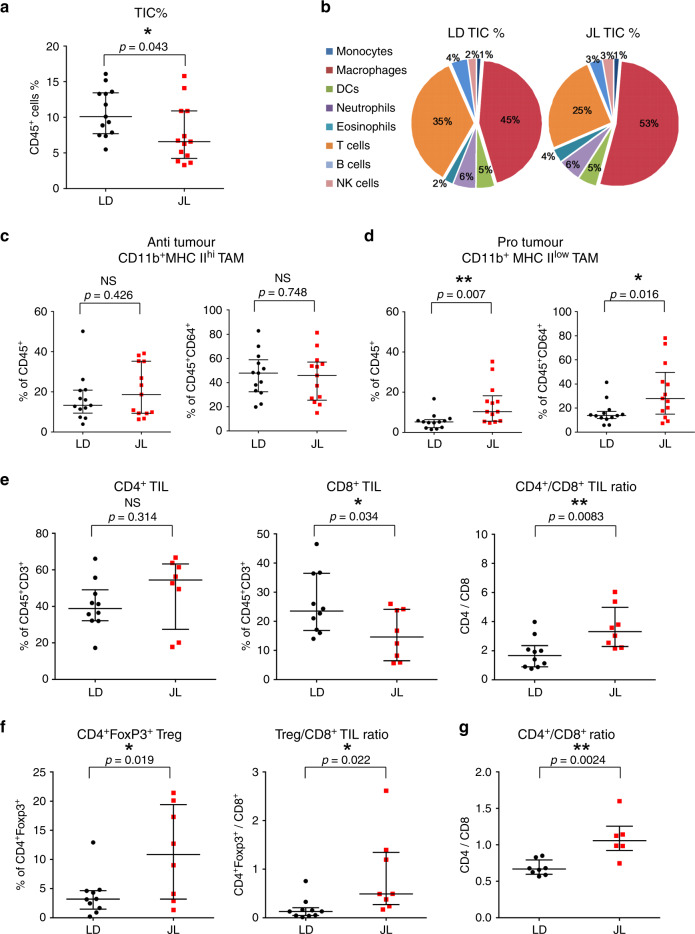
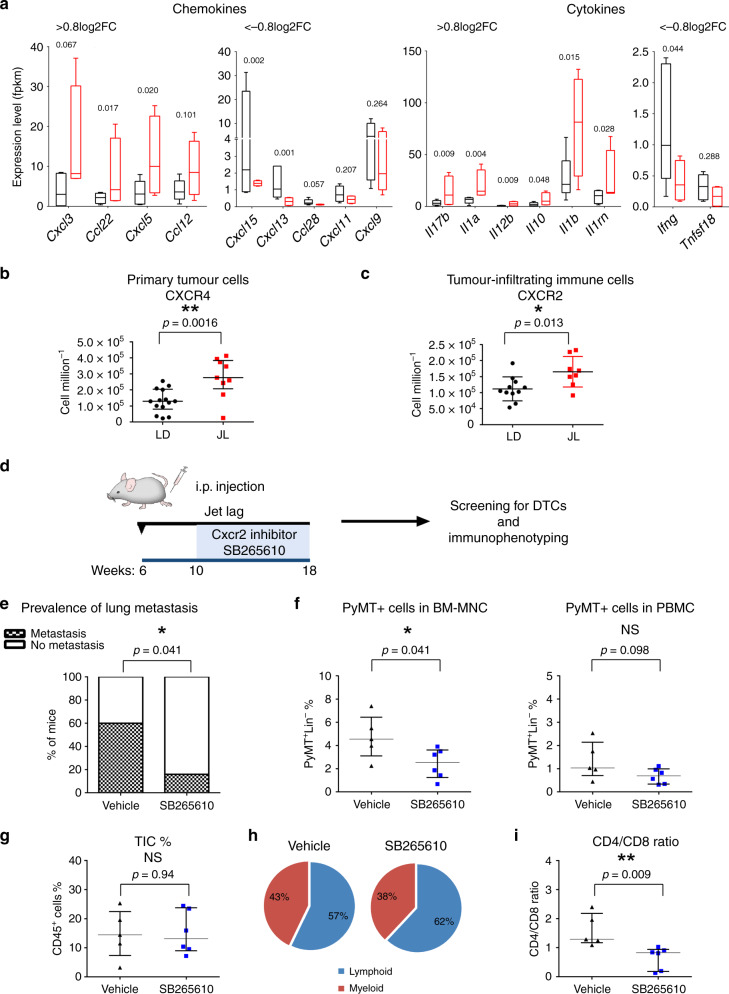
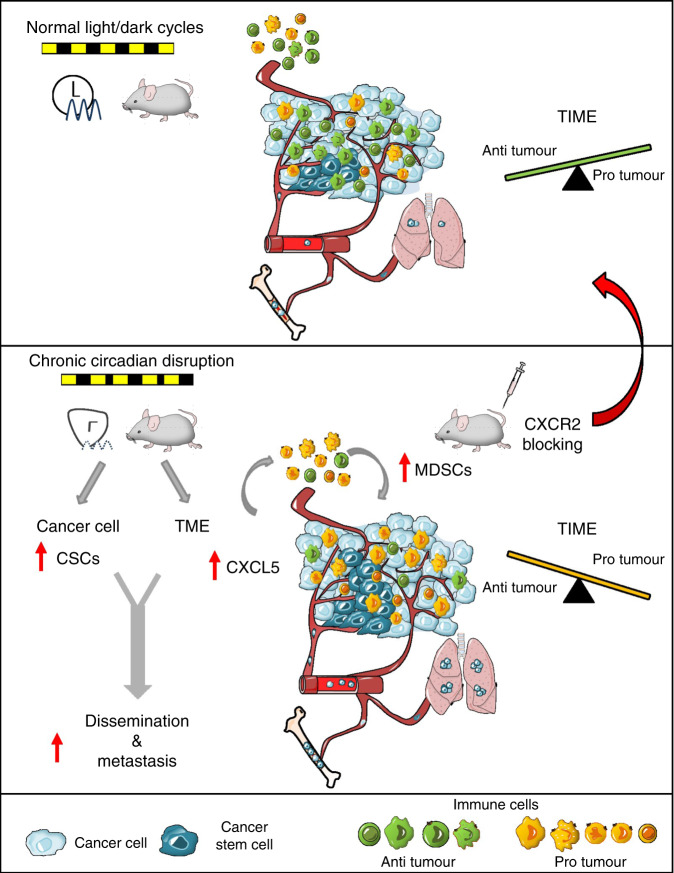
Breast cancer is the most common type of cancer worldwide and one of the major causes of cancer death in women. Epidemiological studies have established a link between night-shift work and increased cancer risk, suggesting that circadian disruption may play a role in carcinogenesis. Here, we aim to shed light on the effect of chronic jetlag (JL) on mammary tumour development. To do this, we use a mouse model of spontaneous mammary tumourigenesis and subject it to chronic circadian disruption. We observe that circadian disruption significantly increases cancer-cell dissemination and lung metastasis. It also enhances the stemness and tumour-initiating potential of tumour cells and creates an immunosuppressive shift in the tumour microenvironment. Finally, our results suggest that the use of a CXCR2 inhibitor could correct the effect of JL on cancer-cell dissemination and metastasis. Altogether, our data provide a conceptual framework to better understand and manage the effects of chronic circadian disruption on breast cancer progression.


Conflict of interest statement

The authors declare no competing interests.

Figures

Fig. 1
Fig. 1. Chronic circadian disruption slightly enhances tumour burden.
a Experimental timeline for evaluation of the effect of chronic jet lag on spontaneous mammary tumourigenesis in B6*FVB PyMT mice. B: birth; IVIS: tumour growth monitoring using bioluminescence. Dashed lines highlight the start and end points of the experiment. b Representative actograms of LD and JL mice. LD: 12-h light and 12-h dark; JL: jet lag, represented by a shortening of the dark period by 8 h every second day. c Weight at sacrifice of mice in LD (n = 25) and JL (n = 21) conditions. Data are presented as a scatter dot plot with lines indicating the median with interquartile range (error bars). P-value calculated from an unpaired two-sided t-test. d Blood cell counts: total numbers of white blood cells (WBC) and red blood cells (RBC) in LD (n = 16) and JL (n = 17) mice. LYM lymphocytes, MON monocytes, NEU neutrophils, HGB haemoglobin, HCT haematocrit, MCV mean corpuscular volume, MCH mean corpuscular haemoglobin, RDW red cell distribution width. Data presented as box-and-whisker plots. Variability is shown using medians (line in the box), 25th and 75th percentiles (box), and min to max (whiskers). e Glucose (n = 8 LD and n = 9 JL), total cholesterol (n = 10 LD and n = 10 JL), triglyceride (n = 9 LD and n = 9 JL, p = 5.04882e−5), and free fatty acid (n = 9 LD and n = 9 JL) profiles of LD and JL mice. Data are presented as scatter dot plots with lines indicating the median with interquartile range (error bars). P-value calculated from an unpaired two-sided t-test. f Timelines of tumour growth in total flux [p s−1] measured by in vivo bioluminescence imaging in LD (n = 6) or JL (n = 5) groups. Data are presented as a dot plot with dots indicating the median with interquartile range (error bars). g Tumour burden (tumour to body weight ratio) as % in LD (n = 25) or JL (n = 21) conditions. Data are presented as a scatter dot plot with lines indicating the median with interquartile range (error bars). P-value calculated from an unpaired two-sided t-test. Indicated (n) represent number of independent experiments as biological replicates.
Fig. 2
Fig. 2. Chronic circadian disruption increases cancer-cell dissemination and metastasis.
a Disseminated tumour cells detected in LD and JL mice at 16 weeks of age by flow cytometry (left, LD n = 14 and JL n = 11) and real-time PCR (right, LD n = 14 and JL n = 12) of bone marrow mononucleated cells (BM-MNC). Representative flow cytometry plots showing intracellular PyMT staining of CD45CD31CD140aTer119 live BM-MNC cells. Data are presented as scatter dot plots with lines indicating the median with interquartile range (error bars). P-values are calculated from an unpaired two-sided t-test. b Circulating tumour cells in peripheral blood mononuclear cells (PBMCs) detected by flow cytometry (left; LD: n = 8 and JL: n = 6) and real-time qPCR (right; LD: n = 12 and JL: n = 9) in mice at 16 weeks of age. Representative flow cytometry plots showing intracellular PyMT staining of CD45 live PBMCs (SSC: side scatter). Data are presented as scatter dot plots with lines indicating the median with interquartile range (error bars). P-values are calculated from an unpaired two-sided t-test. c Prevalence of lung metastasis in LD (n = 25) and JL (n = 21) cohorts at 16 weeks of age. Data represent the percentage of mice with metastasis in both conditions, P-value obtained from a binomial two-sided test. d Number of metastatic foci per lung in LD (n = 25) and JL (n = 21) mice at 16 weeks of age. Data represent the percentage of mice with >3 or <3 metastatic foci in both conditions. P-value obtained from a binomial two-sided test. Indicated (n) represents the number of independent experiments as biological replicates.
Fig. 3
Fig. 3. Chronic circadian disruption does not profoundly alter gene expression profiles in primary tumours or bone marrow mononucleated cells, with the exception of genes linked with phototransduction and light perception.
a RNA-seq sample heatmap and hierarchical clustering based on the expression (FPKM) of 12,556 genes across the two tissues. Gene expression matrix was centered, reduced, and log2 transformed. Samples appear as columns and genes as rows; samples are labelled by their tissue of origin (BM: bone marrow (n = 10, salmon) and T: primary tumour (n = 9, grey)), experimental conditions (JL (n = 9) in red and LD (n = 10) in black) and the presence (n = 9)/absence (n = 10) of metastasis (dark and light violet). Hierarchical clustering was performed using Euclidean distance and the Ward.D2 criterion for agglomeration. The colour scale represents expression levels, red for high expression and blue for low expression. b Enriched KEGG Pathway and Gene Set enrichment analysis for bone marrow. GSEA plots are shown for the Gene Ontology (GO) terms: Phototransduction and Rhodopsin_mediated_signaling_pathway. c Heatmap based on the expression (FPKM) of differentially expressed genes linked with phototransduction and photoperception in bone marrow (n = 10) and primary tumours (n = 9). Gene expression matrix was centered, reduced, and log2 transformed. Samples appear as columns and genes as rows; samples are labelled by the experimental conditions (JL in red and LD in black) and the presence/absence of metastasis. Hierarchical clustering was performed using Euclidean distance and the Ward.D2 criterion for agglomeration. The colour scale represents expression levels, red for high expression and blue for low expression. Indicated (n) represents the number of independent experiments as biological replicates.
Fig. 4
Fig. 4. Chronic circadian disruption increases cancer-cell stemness in primary tumours.
a Representative gating strategies for CD24medCD29hiCD49fhi mammmary stem cells (MaSC) with contour plots shown for LD (black) and JL (red) tumours (SSC: side scatter). b Frequency of CD24medCD29hiCD49fhi mammary stem cells (MaSC) in LD and JL tumours (n = 13). Data are shown as a scatter dot plot with lines indicating the median with interquartile range (error bars). P-value obtained from an unpaired two-sided t-test. c Mammosphere-formation efficiency (MFE%) of LD and JL tumour cells (n = 3). Data are shown as a scatter dot plot with lines indicating the median with interquartile range (error bars). P-value obtained from an unpaired two-sided t-test. d Circadian clock genes mRNA expressions (FPKM: Fragments Per Kilobase Million) in cancer cells from LD (n = 5) and JL (n = 4) primary tumours. Data presented as box-and-whisker plots. Variability is shown using medians (line in the box), 25th and 75th percentiles (box), and min to max (whiskers). P-values were calculated using DESeq2 and the Wald test based on the negative binomial distribution. Respective log2FoldChange (log2FC) are listed in Supplementary Data 3. e Mammosphere-formation efficiency (MFE%) of MCF12A normal human mammary cells in different circadian phases (n = 3). Blue squares and grey diamonds represent peaks of BMAL1HIGH/PER2LOW and BMAL1LOW/PER2HIGH expression, respectively. Data are presented as a dot plot with dots indicating the median with interquartile range (error bars). P-value was calculated from a one-way ANOVA/Tukey’s multiple comparisons test. f Tumour-initiation study based on orthotopic injection of primary tumour cells from LD (n = 6) and JL (n = 6) mice in the mammary fat pad (MFP) of host mice (n = 4 per each donor). Tumour-initiation potential was calculated as the percentage of host mice that formed tumours. We set a threshold based on MFP weight at 0.25 g for positivity. P-value was obtained from a binomial two-sided test. The picture illustrates the observed differences between MFP between JL and LD donors. Indicated (n) represent number of independent experiments as biological replicates.
Fig. 5
Fig. 5. Chronic circadian disruption attenuates immune infiltration and creates a pro-tumour immune microenvironment.
a Percentage of tumour-infiltrating immune cells (TIC) in LD (n = 13) and JL (n = 13) tumours. Flow cytometric analysis revealed a lower percentage of TICs in JL tumours. Data are presented as a scatter dot plot with lines indicating the median with interquartile range (error bars). P-value obtained from an unpaired two-sided t-test. b Relative distribution of main immune cell types in TICs from LD and JL tumours. Data presented as pie charts displaying the mean values of 13 mice. c, d Tumour-associated macrophage (TAM) phenotypes in LD (n = 13) and JL (n = 13) tumours. Flow cytometry of JL tumours showed a significant reduction in the anti-tumour CD11b+MHC IIhi phenotype, with a significant increase in pro-tumour CD11b+MHC IIlow TAMs. e Tumour-infiltrating lymphocytes (TIL) in LD (n = 10) and JL (n = 8) tumours. TILs are presented as percentage of CD3+ immune cells. The proportion of CD8+ TILs was significantly lower in JL tumours, resulting in an increase in the CD4/CD8 ratio. f Tumour-infiltrating CD4+FoxP3+ T cells in LD (n = 10) and JL (n = 8) mice. Flow cytometry revealed a significant increase of Treg and Treg/CD8+ ratio in primary tumours of JL mice. g CD4/CD8 ratio in the peripheral blood of LD (n = 8) and JL (n = 6) mice. cg Data are presented as scatter dot plots with lines indicating the median with interquartile range (error bars). P-values obtained from unpaired two-sided t-test. Indicated (n) represent number of independent experiments as biological replicates.
Fig. 6
Fig. 6. Circadian disruption alters chemokine/cytokine regulatory networks.
a The most up- and downregulated chemokines and cytokines in LD (n = 5) and JL (n = 4) tumours, as detected by mRNA-seq. Expression data represent FPKM values and are presented as box-and-whisker plots. Variability is depicted using medians (line in the box), 25th and 75th percentiles (box), and min to max (whiskers). P-values were calculated using DESeq2 and the Wald test based on the negative binomial distribution. Respective log2FoldChange (log2FC) are listed in Supplementary Data 3. b Number of tumour cells positive for CXCR4 in LD (n = 14) and JL (n = 9) tumours. Data are shown as a scatter dot plot with lines indicating the median with interquartile range (error bars). P-values obtained from unpaired two-sided t-test. c Number of tumour-infiltrating immune cells positive for CXCR2 in LD (n = 11) and JL (n = 8) samples. Data are shown as a scatter dot plot with lines indicating the median with interquartile range (error bars). P-values obtained from unpaired two-sided t-test. di Effects of CXCR2 inhibition on tumour development in JL mice. d Scheme illustrating the experimental plan. MMTV:PyMT mice were subjected to chronic jet lag from the age of 6 weeks, and from 10 to 18 weeks of age were intraperitoneally (i.p.) injected once a day (5 days injection + 2 days resting) with the CXCR2 antagonist SB265610 (2 mg kg−1 in 5% DMSO–8% Tween80 0.9% NaCl). Mice were sacrificed at 18 weeks of age. e Prevalence of lung metastasis in mice injected with vehicle (n = 5) or SB265610 (n = 6). P-value obtained from a binomial two-sided test. f The percentage of disseminated tumour cells in BM and peripheral blood in mice injected with vehicle (n = 5) and SB265610 (n = 6). g Percentage of tumour-infiltrating immune cells (TIC) in mice injected with vehicle (n = 5) and SB265610 (n = 6). h Relative distribution of lymphoid and myeloid TICs in both cohorts. Data are presented as pie charts displaying the mean values of mice. i CD4/CD8 ratio in tumours from vehicle (n = 5) and SB265640 (n = 6) groups. Data (f, g, i) are presented as scatter dot plots with lines indicating the median with interquartile range (error bars). P-values were calculated from an unpaired two-sided t-test. Indicated (n) represent number of independent experiments as biological replicates.
Fig. 7
Fig. 7. Conceptual schema.
Chronic circadian disruption (CRD) alters two key aspects of tumour biology. It increases the proportion of cancer stem cells (CSCs, in dark blue) and modifies the tumour microenvironment (TME) through the recruitment of myeloid-derived suppressor cells (MDSCs, in yellow), resulting in a suppressive tumour immune microenvironment (TIME). At least one mechanism that could drive this process is an enhanced CXCL5-CXCR2 axis in the TIME. Collectively, these effects result in increased dissemination and metastasis in bone marrow and lungs. Inhibition of the CXCR2 axis is able to alleviate the effect of CRD and recover anti-tumour activity.

Similar articles

Cited by

References

    1. Bray F, et al. Global cancer statistics 2018: GLOBOCAN estimates of incidence and mortality worldwide for 36 cancers in 185 countries. Ca. Cancer J. Clin. 2018;68:394–424. - PubMed
    1. Tagliabue G, et al. Atmospheric fine particulate matter and breast cancer mortality: a population-based cohort study. BMJ Open. 2016;6:e012580. - PMC - PubMed
    1. Schernhammer ES, et al. Rotating night shifts and risk of breast cancer in women participating in the nurses’ health study. JNCI J. Natl Cancer Inst. 2001;93:1563–1568. - PubMed
    1. Hansen J. Night shift work and risk of breast cancer. Curr. Environ. Health Rep. 2017;4:325–339. - PubMed
    1. Samuelsson LB, Bovbjerg DH, Roecklein KA, Hall MH. Sleep and circadian disruption and incident breast cancer risk: An evidence-based and theoretical review. Neurosci. Biobehav. Rev. 2018;84:35–48. - PMC - PubMed

Publication types

MeSH terms