. 2020 Jul;583(7816):431-436.
doi: 10.1038/s41586-020-2432-4. Epub 2020 Jun 24.

Single-molecule imaging of transcription dynamics in somatic stem cells

Affiliations

Single-molecule imaging of transcription dynamics in somatic stem cells

Justin C Wheat et al. Nature. 2020 Jul.

Abstract

Molecular noise is a natural phenomenon that is inherent to all biological systems1,2. How stochastic processes give rise to the robust outcomes that support tissue homeostasis remains unclear. Here we use single-molecule RNA fluorescent in situ hybridization (smFISH) on mouse stem cells derived from haematopoietic tissue to measure the transcription dynamics of three key genes that encode transcription factors: PU.1 (also known as Spi1), Gata1 and Gata2. We find that infrequent, stochastic bursts of transcription result in the co-expression of these antagonistic transcription factors in the majority of haematopoietic stem and progenitor cells. Moreover, by pairing smFISH with time-lapse microscopy and the analysis of pedigrees, we find that although individual stem-cell clones produce descendants that are in transcriptionally related states-akin to a transcriptional priming phenomenon-the underlying transition dynamics between states are best captured by stochastic and reversible models. As such, a stochastic process can produce cellular behaviours that may be incorrectly inferred to have arisen from deterministic dynamics. We propose a model whereby the intrinsic stochasticity of gene expression facilitates, rather than impedes, the concomitant maintenance of transcriptional plasticity and stem cell robustness.


Conflict of interest statement

Competing interests. The authors declare no competing interests.

Figures

Extended Data Fig. 1|
Extended Data Fig. 1|. Transcriptional dynamics of genes conditional on PU.1 state.
a-b, Among all spots that passed intensity and 3D-PSF fit thresholding in FISH-QUANT, (a) Cumulative Distribution Function (CDF) of spot intensity and (b) histogram of signal to noise in spot intensity to local background intensity. c, Probability densities for fluorescence/mRNA molecule in HPC-7 cells for Cy3, AlexaFluor 594, and Cy5 labeled readout probes. Insets are XY and XZ average PSFs for each fluorophore. Overlaid line is fit to Gaussian distribution. >10,000 spots per fluorophore. d, Representative three color smFISH for PU.1 (Cy5, red), Gata2 (Cy3, white) and Gata1 (AF594, green) in HPC-7 cells. Scale bar = 5um. e, Bivariate distributions of Gata1-Gata2 (left), Gata2-PU.1 (middle), and PU.1-Gata1 (right) in two independent experiments (n>400 cells/experiment) with HPC7 cells. f, Representative images of multiplexed smFISH between PU.1 and 8 other hematopoietic genes in Kit+Lineage- bone marrow from wildtype mice (n=258–2488 cells for each gene; derived from single experiment; scale bar 5um). g, Probability distribution for PU.1 mRNA/cell in KL cells from wildtype BM. Overlaid are the high (red) and low (blue) components of the two-component negative binomial distribution fitted to the data. h, Comparison of PU.1 bursting kinetics between high and low states. (Left) Representative imaging of PU.1 smFISH with a single, large transcription site in the nucleus. (Middle) frequency of cells with indicated number of active PU.1 transcription sites. (Right) Frequency distribution of summed nascent mRNA/cell in each PU.1 state. i, Schematic demonstrating a hypothetical transcriptional phase portrait. j, Phase portraits for each gene based on the cell’s PU.1 state.
Extended Data Fig. 2|
Extended Data Fig. 2|. Comparative Analysis of smFISH and scRNAseq.
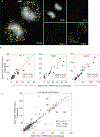
a, CDF plots of mRNA/cell for 5 scRNAseq datasets and smFISH. Data is normalized to the max count for each gene in each data set. b, Calculated Gini index for 7 TF mRNAs in each scRNAseq data set (white through black) and smFISH (red). c, CDF plots of Gini index for all 5 scRNAseq datasets (See Supplemental Table 2 for gene list). d, Schematic of Hierarchical Clustering followed by Random Forest classifier to identify important variables for cluster assignment. e, Gini coefficient versus variable importance for 4 scRNAseq datasets. Bottom and right panels are marginal distributions of Gini and VI, respectively. f, Plot of average mutual information (MI, top) or average absolute value of the Pearson’s correlation coefficient (PCC, bottom) versus normalized abundance of n=200 randomly selected genes against all other genes in the dataset. R values listed are the correlation coefficients between abundance and MI or PCC. See Supplemental Discussion for further details on the analyses performed.
Extended Data Fig. 3|
Extended Data Fig. 3|. Summary statistics of mRNA copy number for primary KL.
a, Representative images of CMP, GMP, and MEP cells stained by smFISH for PU.1/Gata1/Gata2. Scale bars= 5μm. Arrows point to CMP co-expressing all three mRNAs. b, Boxplots for mRNA count/cell with overlaid single cell mRNA values (dots). Gray box is 95 percent confidence interval, red line is mean expression, pink box is +/−SEM. c, Table of summary statistics for each gene. Data for (a-c) derived from two experiments (CMP and MEP) or a single experiment (GMP). Sample size is listed in the table in (c).
Extended Data Fig. 4|
Extended Data Fig. 4|. Spot detection in FISH-QUANT and spot calling in T-lymphocytes.
a-b, Comparison of raw (a) and filtered (b) smFISH image from CMP (representative of >2 experiments in CMP; spot quality consistent with all reported experiments in this manuscript). Insets are line intensity plots (indicated on cell in white). Scale bar is 10μm. c, Average point spread function (PSF) in XY (left columns) and XZ (right columns) for each gene from all detected spots from CMP dataset. d-e, Empiric (left) versus theoretical (middle) PSF and residuals (right) in the XY (d) and XZ (e) planes. f, Cumulative distribution functions for all spots passing the initial intensity thresholding for filtered intensity (top row), squared residuals (2nd row), and width of spots in X, Y, and Z in nanometers (3rd-5th row, respectively). Spots are separated based on those coming from cells with >5 copies of mRNA/cell, between 2–5 copies/cell, and 1 copy/cell. Discarded spots failing 3D fitting are shown in orange. g, mRNA detection in primary CD4+/CD8+ thymocytes (n= 136 for Gata1, n = 154 for PU.1).
Extended Data Fig. 5|
Extended Data Fig. 5|. Gating strategy to assign CMP to states.
a, Representative images of CMP in different states. Scale bar = 10μm. b, Gating scheme for assigning CMP to transcriptional states. See Supplementary Discussion for details on the gating strategy. tSNE plot demonstrates the proximity of states to one another and to immunophenotypic GMP and MEP. Images and analyses derived from experimental datasets reported in Fig. 1 and Extended Data Fig. 2. c, Frequency distribution of transcriptional bursting for each gene in each transcriptional state. x-axis is the number of active alleles. d, (top) Schematic of “states” being the consequence of simple transcriptional noise of the LES state (right) versus truly separate transcriptional states (right) that require transition events (edges). (bottom) Time dependent behavior of simulated cells in a noise only (gray) or state transition system (red) shown as a bivariate plot of PU.1 copy number versus Gata1+Gata2 copy number. T indicates the amount of elapsed simulation time as a fraction of the final time. (e-f), Gillespie simulations of state transitions, modulating half-life alone. If a transition to another state occurs by noise alone, the cell only changes the mRNA half-life of the mRNA defining that state. e, Endpoint states reached in the simulations (n=10,000) and f, 1000 representative simulation trajectories, color coded on the final endpoint state. Each panel is a different factor change in the mRNA half-life, with the left-most panel as the reference (i.e. the half-lives used in Fig. 2), 2X (second panel from left), 3X (second from right), and 4X (right-most).
Extended Data Fig. 6|
Extended Data Fig. 6|. 72-hour progeny of HSC.
a, Representative images of HSC progeny. PU.1 in red, Gata2 in cyan, Gata1 in yellow. Transcription sites are demarcated with boxes. Arrows are triple positive cells. Arrow head is a megakaryocyte. Representative of two separate experiments. b, CDFs for mRNA counts/HSC progeny. Number of cells with > 1 mRNA/cell is indicated. 2 separate experiments, (Exp1, n = 529; Exp 2, n = 1061). c, Bivariate distributions of PU.1 versus Gata1 and PU.1 versus Gata2.
Extended Data Fig. 7|
Extended Data Fig. 7|. State Assignments for HSC progeny.
a, Gating strategy. (left) Removal of megakaryocytes occurs first. (middle), Cells with >10 copies of Gata1 are assigned to G1/2H. while cells with >200 copies of PU.1 are assigned to P1H. b, Probability density distributions for PU.1 and Gata2 with overlaid fits for a two-component negative binomial distribution amongst cells after removing Meg-, G1/2H, and P1H with PU.1>200copies. c, Bivariate distribution of same cells. Contrary to the case in CMP, the population of Gata2High/PU.1High HSC progeny all had morphological characteristics similar to macrophage-like cells seen in GMP datasets, which also were Gata2High/PU.1High (see Extended Data Fig. 2). As such, all cells with PU.1>75 were assigned to P1H. d, Probability distribution for Gata2 in remaining cells, fit with a two-component negative binomial. Such a distribution cannot be definitively separated into high and low components due to overlap in the distributions; therefore, cells are assigned probabilistically during KCA to the G2H or LES state in order to correct for false transitions arising from uncertainty in the assignment (e). See Supplemental Discussion for more details on the rationale and implementation of probabilistic gating.
Extended Data Fig. 8|
Extended Data Fig. 8|. HSC colony data.
Endpoint cells are the leaves on each pedigree. Note that edge lengths are not scaled on time between divisions, and all endpoint cells are 96 hours from the start of the experiment. Cells are color coded consistent with the color scheme used throughout the manuscript. Megakaryocytes are labeled in orange. Nodes (cells) observed upstream of the endpoint (i.e. no transcriptional data is available) are colored black. b, Histogram of number of progeny from a single HSC c-e, Proliferation phenotypes of cells based on end point state identity (P1H n=137; LES n=1571; G1/2H n = 81; G2H n =166). Cell lifetimes in (e) are time interval between cell birth (last division) and the next cell division or cell death. Violin plots are normalized to area with center box-and-whisker showing the mean, standard deviation and 95% confidence interval. Box-and-whiskers in (e) are mean, standard deviation and 95% confidence interval, with single dots representing outliers in 99th percentile.
Extended Data Fig. 9|
Extended Data Fig. 9|. Robustness of Inferred Transition Matrix to mRNA threshold.
a, Normalized deviation in the inferred transition matrices for each indicated threshold (n=200 bootstrapping iterations) of Gata1 mRNA/cell relative to the reference matrix reported in this manuscript (cutoff = 10 mRNA/cell). Boxed matrix is the reference matrix. For any given transition (i.e. matrix entry), the initial states are the columns, final states are rows. Color code is same as used elsewhere in the manuscript. b, Same as in (a) except for PU.1 (cutoff in manuscript = 75 mRNA/cell). c, Frobenius distance (FD, ij(Ti,jref-Ti,jtest)2) between each matrix versus the reference transition matrix. Solid black line indicates the background FD derived from statistical uncertainty in the reference transition matrix, derived by bootstrapping through the analysis n = 1000 times and picking random transition rates from a Gaussian distribution defined by inferred mean and standard deviation of the transition matrix. FD values above this line significantly differ from the matrix reported in the manuscript.
Extended Data Fig. 10|
Extended Data Fig. 10|. Analysis of mRNA partitioning errors.
a, Representative image of a CMP in late anaphase. b, mRNA copy number in each sister cell in CMP (n=52) and HSC (n=46). Pearson’s correlation coefficient for sister cell mRNA copy number. Red dashed line is y=x. c, Correlation in mRNA levels between HSC that divided within the last 1 hour (n=171). Pearson’s correlation coefficients for each gene are listed.
Fig. 1|
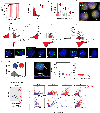
Fig. 1|. Stochastic Bursting of mRNAs Drives Co-expression of Antagonistic TF in HSPC.
a, Schematic of hematopoietic hierarchy. b, Description of smFISH using two-step hybridization method. Bottom panel are line plots of signal above background. c, Quantification of PU.1 molecules per bone marrow mononuclear cell using 1-step or 2-step smFISH reaction. d, Filtered images of CMP, GMP, and MEP cells stained by smFISH for PU.1 (Cy5, Red pseudocolor), Gata1 (AlexaFluor 594, cyan pseudocolor), and Gata2 (Cy3, yellow pseudocolor). Scale bars= 10μm, DNA in gray pseudocolor. e, Violin plots (Area normalized) of the natural log normalized (mRNA+1/cell) distribution for each gene. Overlaid numbers are the mean copy number/cell (CMP n=3174, GMP n=364, MEP n=1113). f, Burst frequency for each gene in each HSPC subpopulation. g, Frequency of cells co-expressing PU.1/Gata1/2. h, Comparison of observed co-bursting frequencies versus theoretical frequencies derived from statistical independence. Color indicates which combination of bursting patterns is being tested, e.g. (1,2) in the top panel means the frequency of cells with 1 active PU.1 site and 2 active Gata1 sites. Dashed line is y=x. Data in (d-h) are derived from 2 independent experiments for CMP and MEP and 1 experiment for GMP.
Fig. 2|
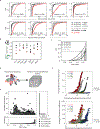
Fig. 2|. Inferred Dynamics of the PU.1/Gata1/Gata2 Network in CMP.
a, Diffusion pseudo-time mapping of CMP cells, colored according to transcriptional state. b, Transcription site bursting frequency with increasing pseudotime along each branch. c, Single trajectories of three-gene stochastic simulation. d, Stability of transcriptional states using inferred parameters e, Average cumulant nascent mRNA produced during the simulation. Line indicates mean among simulations; shaded regions are +/− standard deviation. n = 10,000. f-g, Time dependent behavior of simulated cells in the LES parameter regime, initialized at 0 mRNAs for all three genes at t = 0. (f) Histogram and time from start of simulation to first time point of instantaneous co-expression, i.e. triple positive or “TP”. All first TP events >12 hours were pooled together. (g) Histogram of total simulation time spent in TP (mean =56.8%, std=20.6%, n=10,000). h-i, Analysis of noise-derived transitions between states and efficacy of system evolution from LES. (h) Frequency each endpoint state after 12-hours of simulation time, initialized in the LES state (n=10,000). (i) Behavior of simulation trajectories over time. Colored based on endpoint state. Right is marginal distribution of endpoints.
Fig. 3|
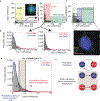
Fig. 3|. Transcription State Correlation Among Clonal Progeny of Single HSC.
a, Schematic of experimental workflow. smFISH image is stitched composite of 4 separate fields of view. Heatmap associated with the pedigree represents the ln(mRNA+1/cell). Colored spheres indicate the assigned transcriptional state of the cell. b, Representative images of cells in each endpoint state under study (number of experiments = 2). Scale bar = 10μm. c, Frequency of states within mixed colonies conditional on the presence of each state. Total represents the frequency of states in all cells analyzed at the endpoint. The empiric distribution of the 4 HSPC states at the 96-hour endpoint was 2.9% (G1/2H), 14.50% (G2H), 6.9% (P1H), and 74.8% (LES) (Experiment 1 = 33 colonies. Experiment 2 = 87 colonies). d, Frequency of state pairs at generational distances u=1 to u=6 as indicated in (a), normalized to the frequency of each state. Endpoint states are demarcated by colored circles under each bar plot.
Fig. 4|
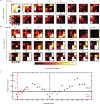
Fig. 4|. Stochastic and Reversible HSC Transcription State Dynamics.
a, Schematic of KCA. b-c, Inferred state persistence (b) and state transition (c) rates, given as probability per generation for each lineage distance. Circles with error bars are mean inferred rate with standard error derived by bootstrapping through data (n =5,000). Dotted horizontal lines in (b) are the rates at u = 1. d-e, Using three-point state frequencies to compare models. (d) Schema of tested state transition models (e) (i) Schematic of three-point state frequencies. (ii) Observed versus theoretical three-point frequencies as predicted by each model. Each circle with error bars is the mean experimental three state frequency (y axis) and inferred average three state frequency (x-axis) at a given distance. The error bars are the experimental standard error derived by bootstrapping (n=1,000). (iii) Total error between theory and observed frequencies at v =2:4 for each model. Models with irreversible edges between states have higher error, i.e. less predictive value, than those with reversible edges. f, Average +/− standard error transition probabilities per generation for the inferred Markov chain. g, Average fraction of time spent in each state for a given endpoint state, conditional on the structure of the pedigree and state distribution of progeny. h State frequencies over generational time when reversible (top) and irreversible (bottom) dynamics connect transcription states. Initialized in the LES state. Curve colors correspond to each state as in (c). i, Proposed model of reversible transcription state transitions connecting PU1-Gata states in early HSPC.

References

    1. Levsky JM & Singer RH Gene expression and the myth of the average cell. Trends Cell Biol. 13, 4–6 (2003). - PubMed
    1. Elowitz MB, Levine AJ, Siggia ED & Swain PS Stochastic gene expression in a single cell. Science 297, 1183–1186 (2002). - PubMed
    1. Raser JM & O’Shea EK Control of stochasticity in eukaryotic gene expression. Science 304, 1811–1814 (2004). - PMC - PubMed
    1. Bar-Even A et al. Noise in protein expression scales with natural protein abundance. Nature Genetics 38, 636–643 (2006). - PubMed
    1. Gandhi SJ, Zenklusen D, Lionnet T & Singer RH Transcription of functionally related constitutive genes is not coordinated. Nat Struct Mol Biol 18, 27–34 (2011). - PMC - PubMed

Publication types

MeSH terms