. 2020 Jul;583(7815):265-270.
doi: 10.1038/s41586-020-2435-1. Epub 2020 Jun 24.

Pervasive lesion segregation shapes cancer genome evolution

Collaborators, Affiliations

Pervasive lesion segregation shapes cancer genome evolution

Sarah J Aitken et al. Nature. 2020 Jul.

Abstract

Cancers arise through the acquisition of oncogenic mutations and grow by clonal expansion1,2. Here we reveal that most mutagenic DNA lesions are not resolved into a mutated DNA base pair within a single cell cycle. Instead, DNA lesions segregate, unrepaired, into daughter cells for multiple cell generations, resulting in the chromosome-scale phasing of subsequent mutations. We characterize this process in mutagen-induced mouse liver tumours and show that DNA replication across persisting lesions can produce multiple alternative alleles in successive cell divisions, thereby generating both multiallelic and combinatorial genetic diversity. The phasing of lesions enables accurate measurement of strand-biased repair processes, quantification of oncogenic selection and fine mapping of sister-chromatid-exchange events. Finally, we demonstrate that lesion segregation is a unifying property of exogenous mutagens, including UV light and chemotherapy agents in human cells and tumours, which has profound implications for the evolution and adaptation of cancer genomes.


Conflict of interest statement

Competing interests

P.F. is a member of the Scientific Advisory Boards of Fabric Genomics, Inc., and Eagle Genomics, Ltd.

Figures

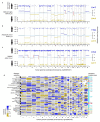
Extended Data Fig. 1
Extended Data Fig. 1. Summary mutation metrics for both C3H and CAST tumours.
a, Single nucleotide substitution rates per C3H tumour, rank ordered over x-axis (grey points, median blue line). Insertion/deletion (indel, <11 nt) rates show as black. b, Y-axis from a, expanded to show distribution of indel rates with preserved tumour order. c, Number of C3H copy number variant (CNV) segments and their total span as a percent of the haploid genome. Blue shading shows intensity of overlapping points as a percent of all tumours in the plot. d-f, Corresponding plots for CAST derived tumours, f, two extreme x-axis outliers relocated (red) and x-axis value shown. g-h, Mutation spectra deconvolved from the aggregate spectra of 371 C3H tumours, subsequently referred to as the DEN1 and DEN2 signatures. i, Oncoplot summarising mutation load, mutation spectra, and driver gene mutation complement of C3H tumours. j, Oncoplot of CAST derived tumours as i.
Extended Data Fig. 2
Extended Data Fig. 2. The frequency of sister chromatid exchanges correlates with mutation rate, and localising reference genome assembly errors.
a, The relationship between single nucleotide substitution mutation load and detected sister chromatid exchange (SCE) events in C3H tumours. Counts of SCE (y-axis) are based on down-sampling to 10,000 informative mutations per tumour to ensure equal power to detect SCE in each tumour. Tumours with <50% cellularity (pink) have high mutation load and form a sub-group with few detected sister chromatid exchange events; these are suspected to be polyclonal tumours and were excluded from the Pearson’s correlation reported. b, As for a but showing CAST derived tumours. c, Evaluation of the relationship between mutation load and ability to detect sister chromatid exchange events. Mutations from C3H tumour 94315_N8 (shown in Fig. 2) randomly down-sampled and segmentation analysis applied. Y-axis shows the percentage of sister chromatid exchange events detected (100 replicates, 95% C.I. pink). X-axis is on a log-scale: 95% of C3H and >95% of CAST tumours have mutation counts to the right of the blue vertical line. Down-sampling other tumours gave comparable results. d, The same down-sampling data as shown in panel c but the y-axis shows the percent of mutations with the correct (same as full data) mutational asymmetry assignment. e, Candidate C3H reference genome assembly errors. Genome coordinates shown on the x-axis. Immediate switches between Watson and Crick asymmetry are not expected on autosomes unless both copies of the chromosome have a SCE event at equivalent sites. However, inversions and translocations between the sequenced genomes and the reference assembly are expected to produce immediate asymmetry switches. The discordant segment coverage (DSC) count (black y-axis) shows the number of informative tumours (those with either Watson or Crick strand asymmetry at the corresponding genome position) that suggest a tumour genome to reference genome discrepancy. Consensus support (brown y-axis) plotted as triangles shows the percentage of informative tumours that support a genomic discrepancy at the indicated position (only shown for values >50% support). The two sites on chromosome 6 in C3H correspond to a previously identified C3H strain specific inversion that is known to be incorrectly oriented in the C3H reference assembly. f, As for e, but showing CAST tumours. The candidate mis-assembly on chromosome 14 in both strains at an approximately orthologous position suggesting a rearrangement shared between strains or a missassembly in the BL6 GRCm38 reference assembly against which other mouse reference genome assemblies have been scaffolded.
Extended Data Fig. 3
Extended Data Fig. 3. Locally elevated mutation load is driven by sister-chromatid exchange.
a, Double strand breaks (DSBs) and other DNA damage can trigger homologous recombination (HR) mediated DNA repair between sister chromatids. The repair intermediate resolves into separate chromatids through cleavage and ligation; grey triangles denote cleavage sites for one of the possible resolutions that would result in a large-scale sister-chromatid exchange event. Although illustrated for double-ended DNA breaks, single ended breaks from collapsed replication forks can be repaired through HR and could similarly lead to the formation of repair intermediate structures that can be resolved as SCEs. b, Enrichment analysis of sister chromatid exchanges sites (red) compared with null expectations from randomly permuting locations into the analysable fraction of the genome (grey distributions), the black boxes denote 95% of 1,000 permutations. Sister chromatid exchange events are enriched in later replicating and transcriptionally less active genomic regions (Hi-C defined compartment B), and correspondingly depleted from early replicating active regions. c, Aggregating across n=9,645 sister chromatid exchange sites, the observed mutation rate approximately doubles at the inferred site of exchange (x=0). Aggregate mutation rates (brown) were calculated in consecutive 5kb windows. Compositionally matched null expectation was generated by permuting each exchange site into 100 proxy tumours and calculating median (black) and 95% confidence intervals (grey) while preserving the total number of projected sites per proxy tumour. d, The elevated mutation count is not the result of a high mutation density in a subset of exchange sites, rather it is a subtle increase in mutations across most exchange sites. Heatmap showing mutation counts calculated in consecutive 5kb windows across each exchange site. Rows represent each exchange site, rank-ordered by total mutation count across each 400kb interval. e, The distribution of positional uncertainty in exchange site location approximately mirrors the decay profile of elevated mutation frequency. f, Divergence of mutation rate spectra is shown as cosine distance between the analysed window and the genome wide mutation rate spectrum aggregated over all C3H tumours. Despite the elevated mutation frequency, there is no detected distortion of the mutation spectrum. g, A model based on HR repair intermediate, branch migration that produces heteroduplex segments of (i) mismatch:mismatch (circles) and (ii) lesion:lesion (red triangles) strands. Subsequent strand segregation would increase the mutational diversity of a descendant cell population but not the mutation count per cell (key as per Fig. 2).
Extended Data Fig. 4
Extended Data Fig. 4. Replication of transcription coupled repair with lesion strand resolution in Mus musculus castaneus.
a, Transcription coupled repair of template strand lesions is dependent on transcription level (P15 liver, transcripts per million, TPM). Confidence intervals (99%) are shown as whiskers, where broad enough to be visible. b, Comparison of mutation rates for the 64 trinucleotide contexts: each context has one point for low and one point for high expression. c, Data as in panel b plotted on log scale; there is a line linking low and high expression for the same trinucleotide context. d, Sequence composition normalised profiles of mutation rate around transcription start sites (TSS). e, Stratifying the data plotted in d by lesion strand reveals much greater detail on the observed mutation patterns, including the pronounced influence of bidirectional transcription initiation.
Extended Data Fig. 5
Extended Data Fig. 5. Variant allele frequency distributions demonstrate high rates of non-mutagenic replication over segregating lesions.
a-f, Variant allele frequency (VAF) distributions shown as probability density functions (total area under curve=1) for example tumours, calculated taking into account observed multi-allelic variation. The VAF for identified driver mutations is indicated (brown triangle). Tumour identifiers are shown top right along with the percent of genomic segments (based on mutation asymmetry segmentation) that are multi-allelic. Skew shows Pearson’s median skewness coefficient for the VAF distributions. Panels a-c show tumours with no multi-allelic segments and exhibit a symmetric VAF distribution showing minimal sub-clonal structure; d-f tumours with all segments multi-allelic, illustrating the sub-clonal structure generated by segregating lesions. g, Tumours with a high proportion of multi-allelic segments have a left-skewed VAF distribution indicating frequent non-mutagenic replication over segregating lesions. Percent of genome segments that are multi-allelic (x-axis) plotted against VAF distribution skew for 371 C3H tumours. Tumours with low estimated cellularity indicated in pink and excluded from correlation analysis. h, As for g but showing 84 CAST tumours. i, Mutation asymmetry summary ribbon for example C3H tumour 90797_N2; genome on the x-axis. The percent of mutation sites with robust support for multi-allelic variation (y-axis) calculated in 10Mb windows (grey) and for each asymmetric segment (black). Thresholds for high (black), intermediate (grey) and zero (red) rates of multi-allelic sites shown on the right axis. j, VAF density plots for the example tumour 90797_N2 (shown in i) mutations in asymmetry segments stratified by the multi-allelic rate thresholds defined in panel i. As with whole tumour based analysis (a-h), high multi-allelic rates correspond to a leftward skew of the VAF (black, grey) whereas segments without multi-allelic variation (red) show a minimally skewed distribution.
Extended Data Fig. 6
Extended Data Fig. 6. Examples of mutation patterns generated by lesion segregation from a diverse range of clinically relevant mutagens.
a, Genome wide mutation asymmetry plot (as per Fig. 2a-c) for simulated solar radiation (SSR) exposed human iPSCs illustrating lesion segregation for ultraviolet damage. Immediately adjacent mutations (inter-mutation distance 100) indicate CC->TT dinucleotide changes. Despite a low total mutation load (1,308 nucleotide substitutions, 842 informative T→A changes), the mutational asymmetry of lesion segregation is evident for the aristolochic acid exposed clone b, and the polycyclic aromatic hydrocarbon DBADE, c that is found in tobacco smoke. d, Summary mutation asymmetry ribbons (as per Fig. 2d) for all mutagen exposed clones with rl20 >5, which illustrates the independence of asymmetry pattern between replicate clones, almost universal asymmetry on chromosome X, and approximately 50% of the autosomal genome with asymmetry over autosomal chromosomes. The dominant mutation type is indicated for each mutagen. In those clones with low mutation rates, some sister exchange sites are likely to have been missed leading to reduced asymmetry signal (e.g. on the X chromosome). Segments with <20 informative mutations are shown in white.
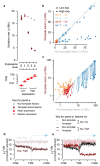
Fig.1
Fig.1. DEN-initiated tumours have a high burden of point mutations with a distinct mutation signature and driver mutations in the EGFR/RAS/RAF pathway.
a, Fifteen-day-old (P15) male C3H/HeOuJ mice received a single dose of diethylnitrosamine (DEN); tumours were isolated 25 weeks after DEN treatment (P190), histologically analysed and subjected to whole genome sequencing. b, DEN-induced tumours displayed a median mutation rate of 13 mutations per million base pairs (μ/Mb). c, Mutation spectra histogram for the aggregated mutations of 371 C3H tumours showing the distribution of nucleotide substitutions, stratified by flanking nucleotide sequence context (96 categories). Sequence context for every fourth trinucleotide context is annotated (x-axis). d, Oncoplot summarising each tumour as a column with its mutation rate (black) and the presence of driver mutations in known driver genes (brown boxes). Tumours are ordered by the driver mutations identified.
Fig. 2
Fig. 2. Chromosome-scale and strand asymmetric segregation of DNA lesions.
a-f, An example DEN-induced C3H tumour (identifier: 94315_N8) with the genome shown over the x-axis. a-c, Mutational asymmetry. Individual T→N mutations shown as points, blue (T on the Watson strand, a) and gold (T on the Crick strand, c), the y-axis representing the distance to the nearest neighbouring T→N mutation on the same strand. b, Segmentation of mutation strand asymmetry patterns. Y-axis position shows the degree of asymmetry (no bias: grey); mutational symmetry switches indicated as red lines. d, Segmentation profile summarised as ribbon showing only the asymmetric segments. e, Mutation rate in 10Mb windows, blue line shows the genome wide rate for this tumour. f, DNA copy number in 10Mb windows (grey) and for each asymmetry segment (black). g, Summary ribbon plots (as in d) for all 371 C3H tumours, ranked by chromosome X asymmetry. Purple triangle indicates tumour shown in panels a-f. Reference genome mis-assembly points marked (grey diamonds). h, Balance of Watson versus Crick asymmetry amongst tumours, showing deviations at driver genes. i, Tumours consistently show segmental mutational asymmetry across 50% of their autosomal genome. j, Model for DNA lesion segregation as a mechanism to generate mutational asymmetries. The exposure of a mutagen generates lesions (red triangles) on both strands of the DNA duplex (1). If not removed before or during replication (2) those lesions will segregate into two sister chromatids, one (blue) carrying only Watson strand lesions and subsequent templated errors, and the second (gold) only Crick strand lesions and their induced errors. Following mitosis, the daughter cells will have a non-overlapping complement of mutagen-induced lesions and resulting replication errors (3), which are resolved into full mutations in the next round of replication (4). The lesion containing strands segregate, becoming a progressively diminishing fraction of the lineage, yet continue as a template for replication. Only cell lineages containing cancer driver changes (* in step (1)) will expand into substantial clonal populations (5).
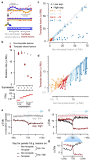
Fig.3
Fig.3. Identification of the lesion containing DNA strand allows processes such as transcription coupled repair (TCR) to be quantified with strand specificity.
a, TCR of DNA lesions is expected to reduce the mutation rate only when lesions are on the template strand of an expressed gene. b, TCR of template strand lesions is dependent on transcription level (P15 liver, transcripts per million (TPM)). Confidence intervals (99%) are shown as whiskers. c, Comparison of mutation rates for the 64 trinucleotide contexts: each context has one point for low and one point for high expression. d, Data as in panel c plotted on log scale; there is a line linking low and high expression for the same trinucleotide context. e, Sequence composition normalised profiles of mutation rate around transcription start sites (TSS). f, Stratifying the data plotted in e by lesion strand reveals much greater detail, including the pronounced net influence of bidirectional transcription initiation on the observed mutation patterns. g, TSS region detail from panel above, f.
Fig.4
Fig.4. Lesion segregation generates multi-allelic and combinatorial genetic diversity.
a, Percent of mutation sites with robust support for multi-allelic variation, one point per tumour. Grey line indicates median. Null expectation (magenta) from permutation between tumours. b, Validation rate for whole genome sequence (WGS) mutation calls in replication whole exome sequencing (WES). Null expectation from permuting tumour identity between WGS and WES. c, Sequence reads spanning proximal mutations, showing nucleotide calls per read. d, As c, showing combinatorial diversity between a pair of biallelic sites. e, Correlation between per-tumour multi-allelic rate and high combinatorial diversity mutation pairs (as in c, d), one point per tumour. f, Tree showing all possible progeny of a DEN mutagenised cell for the subsequent 10 generations. Blue and gold lines trace the simulated segregation of lesion-containing strands from a single haploid chromosome. Coloured nodes show hypothetical transformation events and their daughter lineages that would give rise to the multi-allelic patterns in tumours shown to the right. g-i, Mutation asymmetry summary ribbons for example C3H tumours that show high g, variable h, or low i rates of genetic diversity; genome on the x-axis. The percent of mutation sites with robust support for multi-allelic variation calculated in 10Mb windows (grey) and for each asymmetric segment (black). j, Histogram of the estimated cell generation post-DEN exposure from which C3H tumours developed based on the proportion of multi-allelic segments. k, Enrichment of specific driver gene mutations in earlier (generation 1) and later (generation >1) developing tumours. All tumours containing the indicated driver mutation (black); the subset of tumours with just the indicated driver and no other driver mutation (red); multi-driver denotes all tumours that contain multiple identified driver genes in the EGFR/RAS/RAF pathway.
Fig.5
Fig.5. Lesion segregation is a pervasive feature of exogenous mutagens and is evident in human cancers.
a, The runs-based rl20 metric, calculated for the simulated solar radiation (SSR) clone MSMO_56.s5 (Extended Data Fig. 6a); here, 20% of informative mutations (C→T/G→A) are in strand asymmetric runs of 22 consecutive mutations or longer (e.g. ≥22 C→T without an intervening G→A). b-d, The rl20 metric and runs tests. Solid blue lines show Bonferroni adjusted p=0.05 thresholds, p-values < 1x10-15 are rank-ordered. b, DEN-induced C3H tumours (this study). c, Mutagen exposed human cells, colour corresponds to the mutagen key in panel g. d, Cell-lines with genetically perturbed genome replication and maintenance machinery. e, All 25 mutagens identified as producing robust mutation spectra when human induced pluripotent stem cells are exposed, grouped by type of agent. See Supplementary Table 2 for the details of abbreviated mutagen exposures. The rl20 metric (x-axis) is plotted for each replicate clone, the size of each data point is scaled to the number of informative mutations. f, The rl20 metric and runs tests for human cancers from International Cancer Genome Consortium projects. g, Mutational asymmetry in an example human hepatocellular carcinoma, donor DO231953, which shows a single dominant mutation signature for aristolochic acid exposure (43.3%).

Comment in

  • Strands of evidence about cancer evolution.
    Graham TA, McClelland SE. Graham TA, et al. Nature. 2020 Jul;583(7815):207-209. doi: 10.1038/d41586-020-01815-6. Nature. 2020. PMID: 32620881 No abstract available.
  • Strands of evolution.
    Dart A. Dart A. Nat Rev Cancer. 2020 Sep;20(9):483. doi: 10.1038/s41568-020-0292-8. Nat Rev Cancer. 2020. PMID: 32669634 No abstract available.

References

    1. Martincorena I, et al. Universal Patterns of Selection in Cancer and Somatic Tissues. Cell. 2017;171:1029–1041.e21. - PMC - PubMed
    1. Turajlic S, Sottoriva A, Graham T, Swanton C. Resolving genetic heterogeneity in cancer. Nat Rev Genet. 2019;20:404–416. - PubMed
    1. Alexandrov LB, et al. The repertoire of mutational signatures in human cancer. Nature. 2020;578:94–101. - PMC - PubMed
    1. Alexandrov LB, et al. Signatures of mutational processes in human cancer. Nature. 2013;500:415–421. - PMC - PubMed
    1. Kucab JE, et al. A Compendium of Mutational Signatures of Environmental Agents. Cell. 2019;177:821–836. - PMC - PubMed

Publication types

MeSH terms