. 2020 Jun;582(7813):550-556.
doi: 10.1038/s41586-020-2388-4. Epub 2020 Jun 24.

Reversing a model of Parkinson's disease with in situ converted nigral neurons

Affiliations

Reversing a model of Parkinson's disease with in situ converted nigral neurons

Hao Qian et al. Nature. 2020 Jun.

Erratum in

Abstract

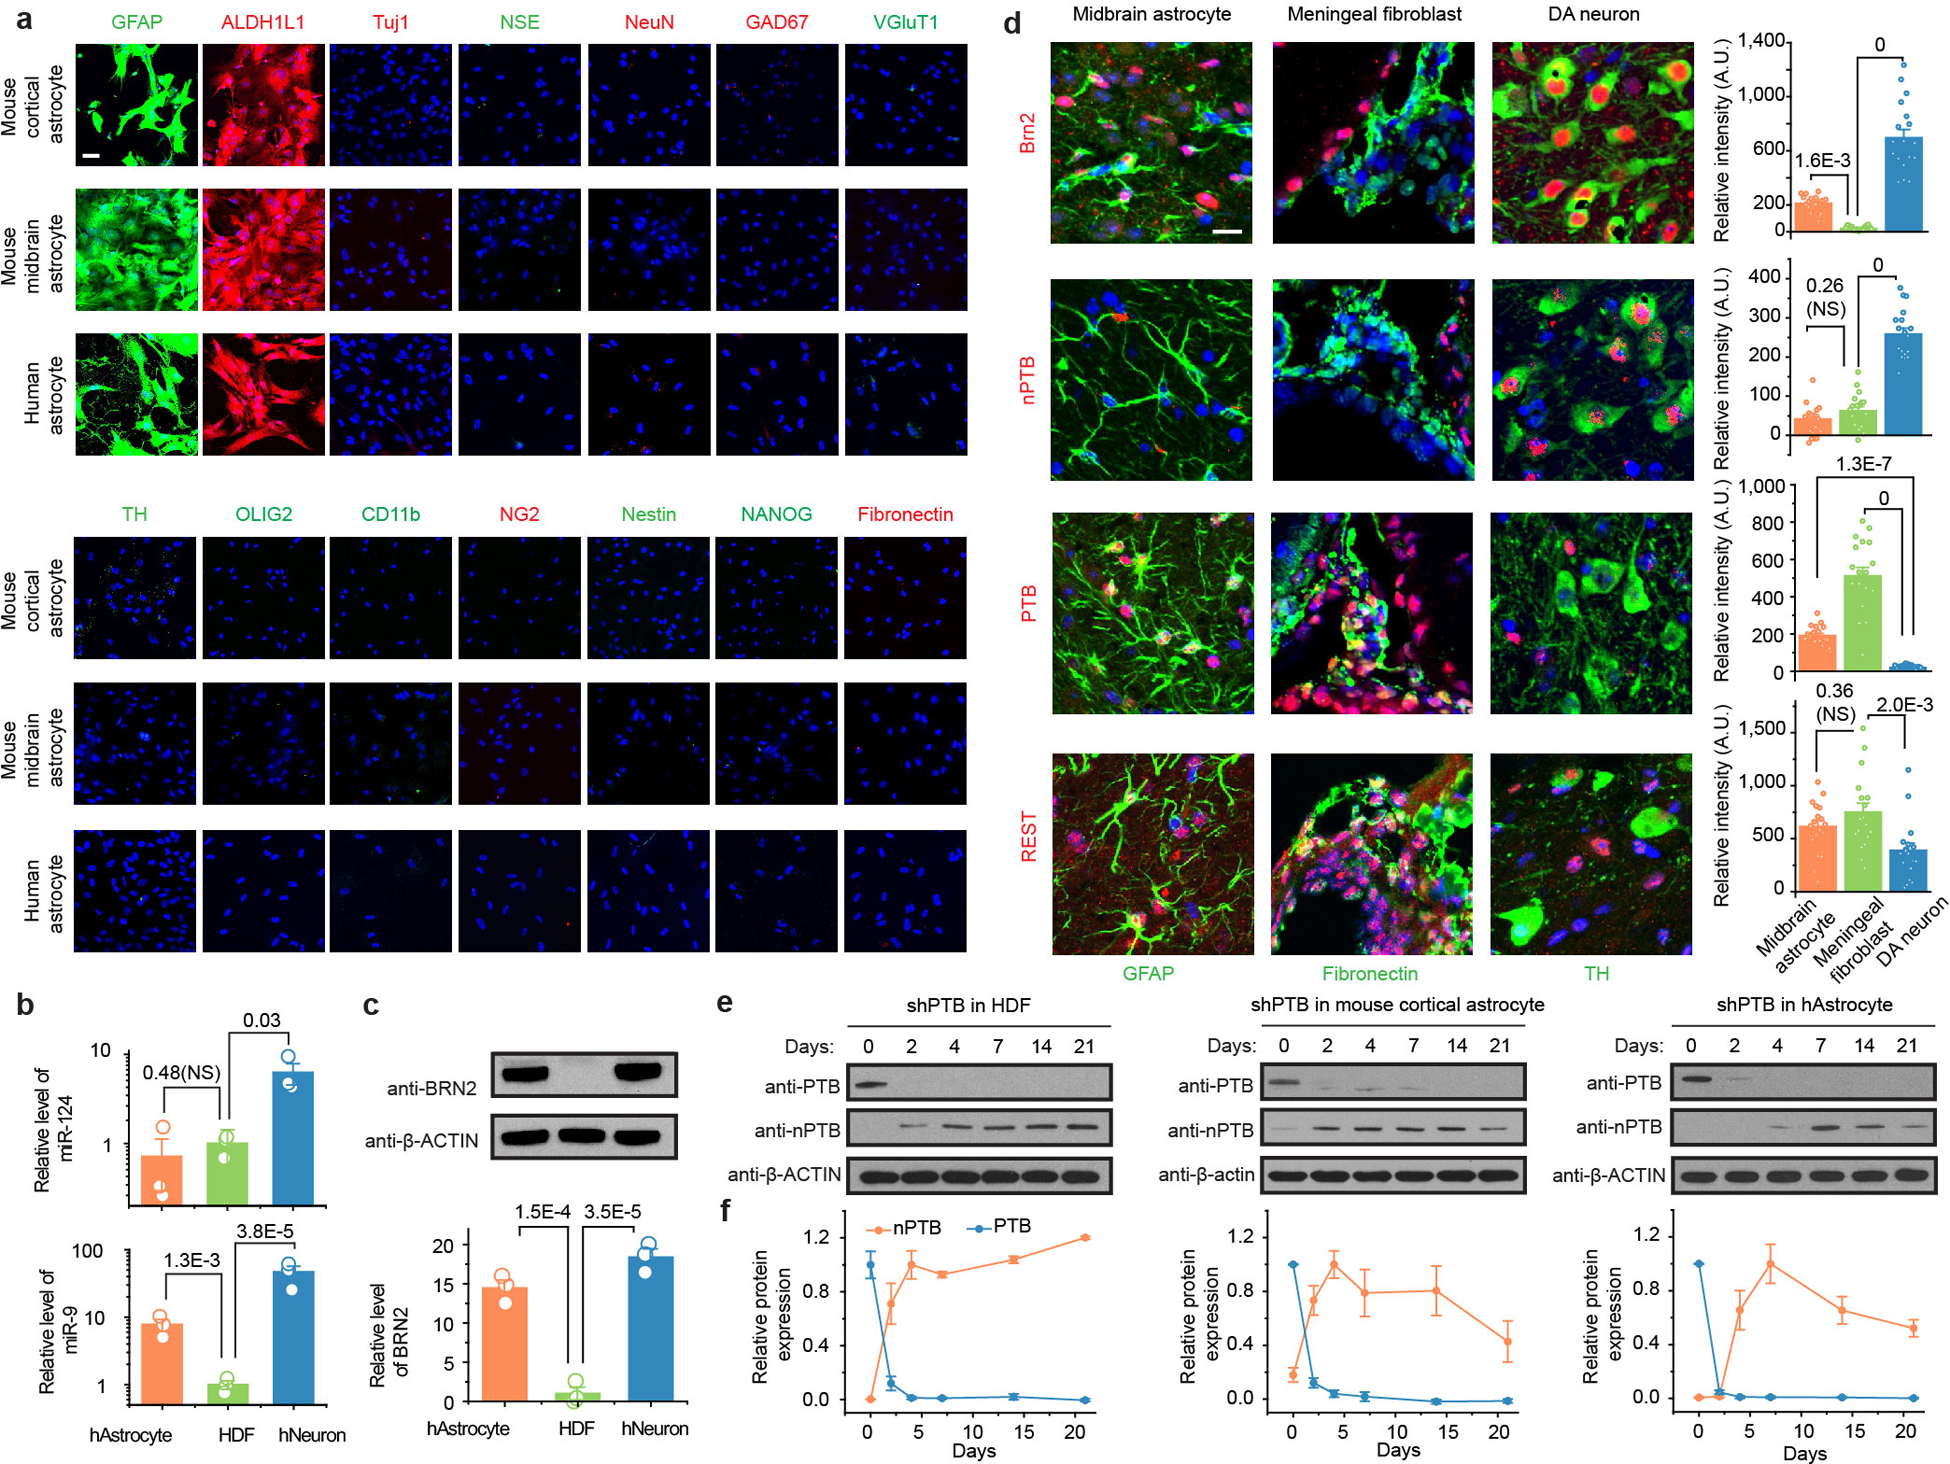
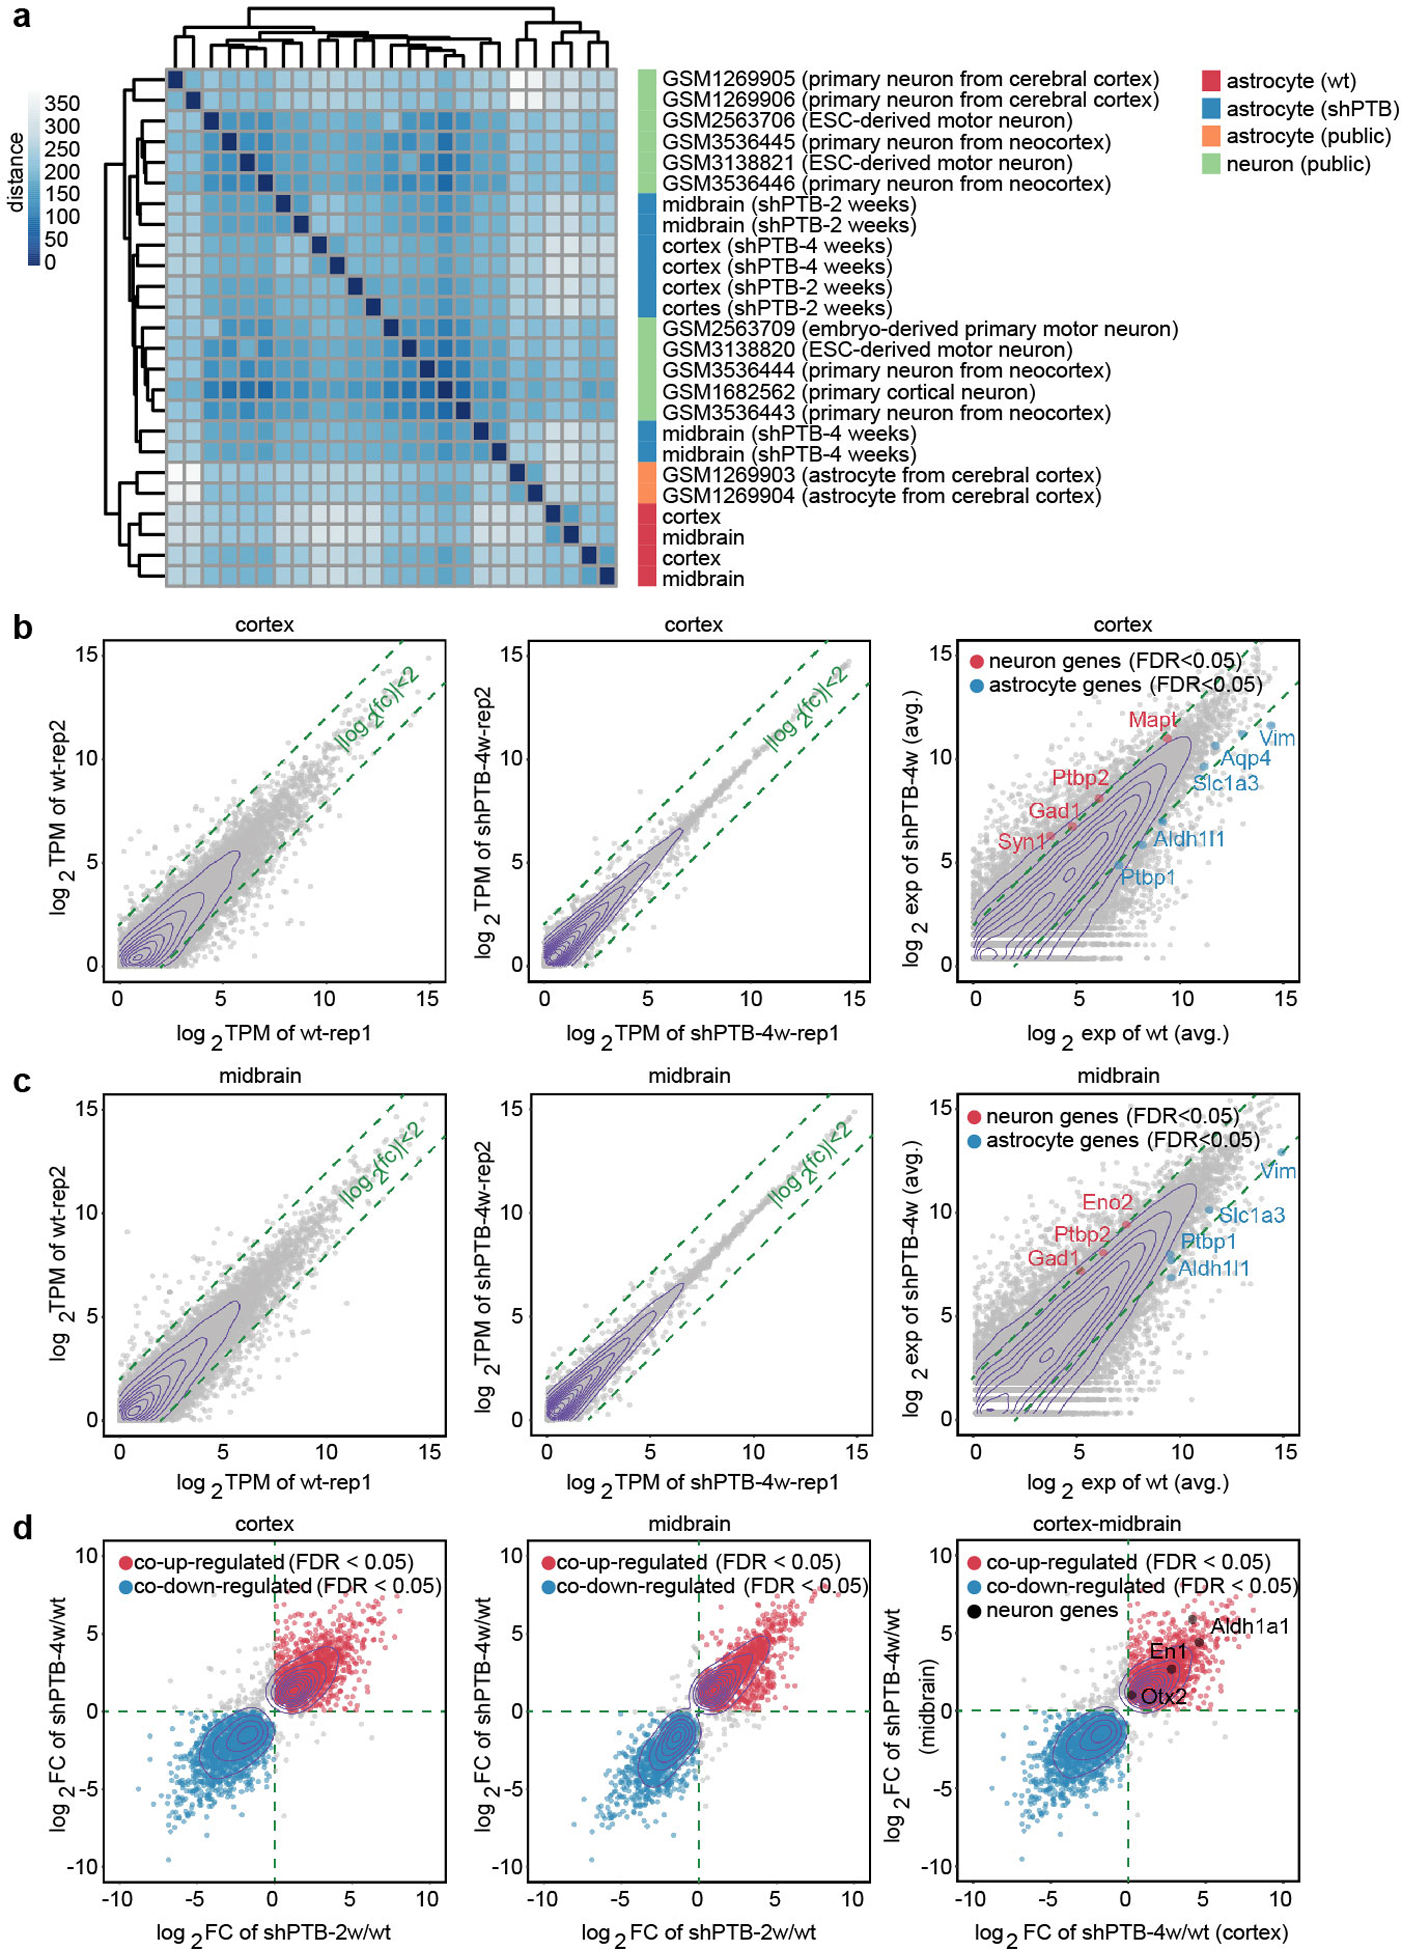
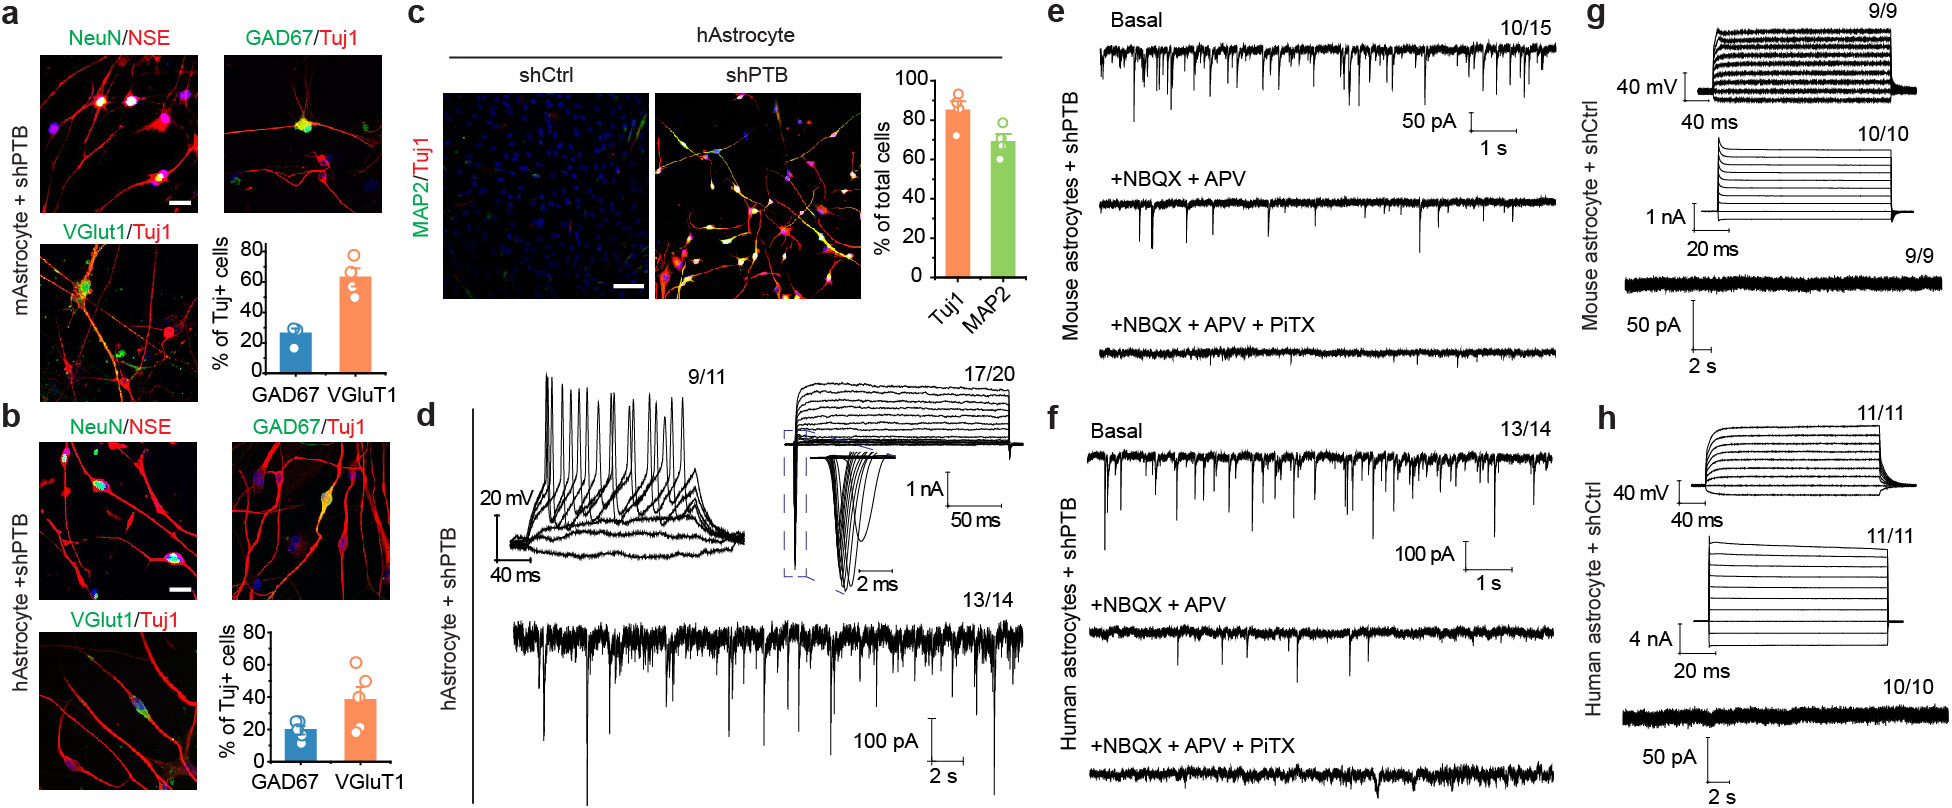
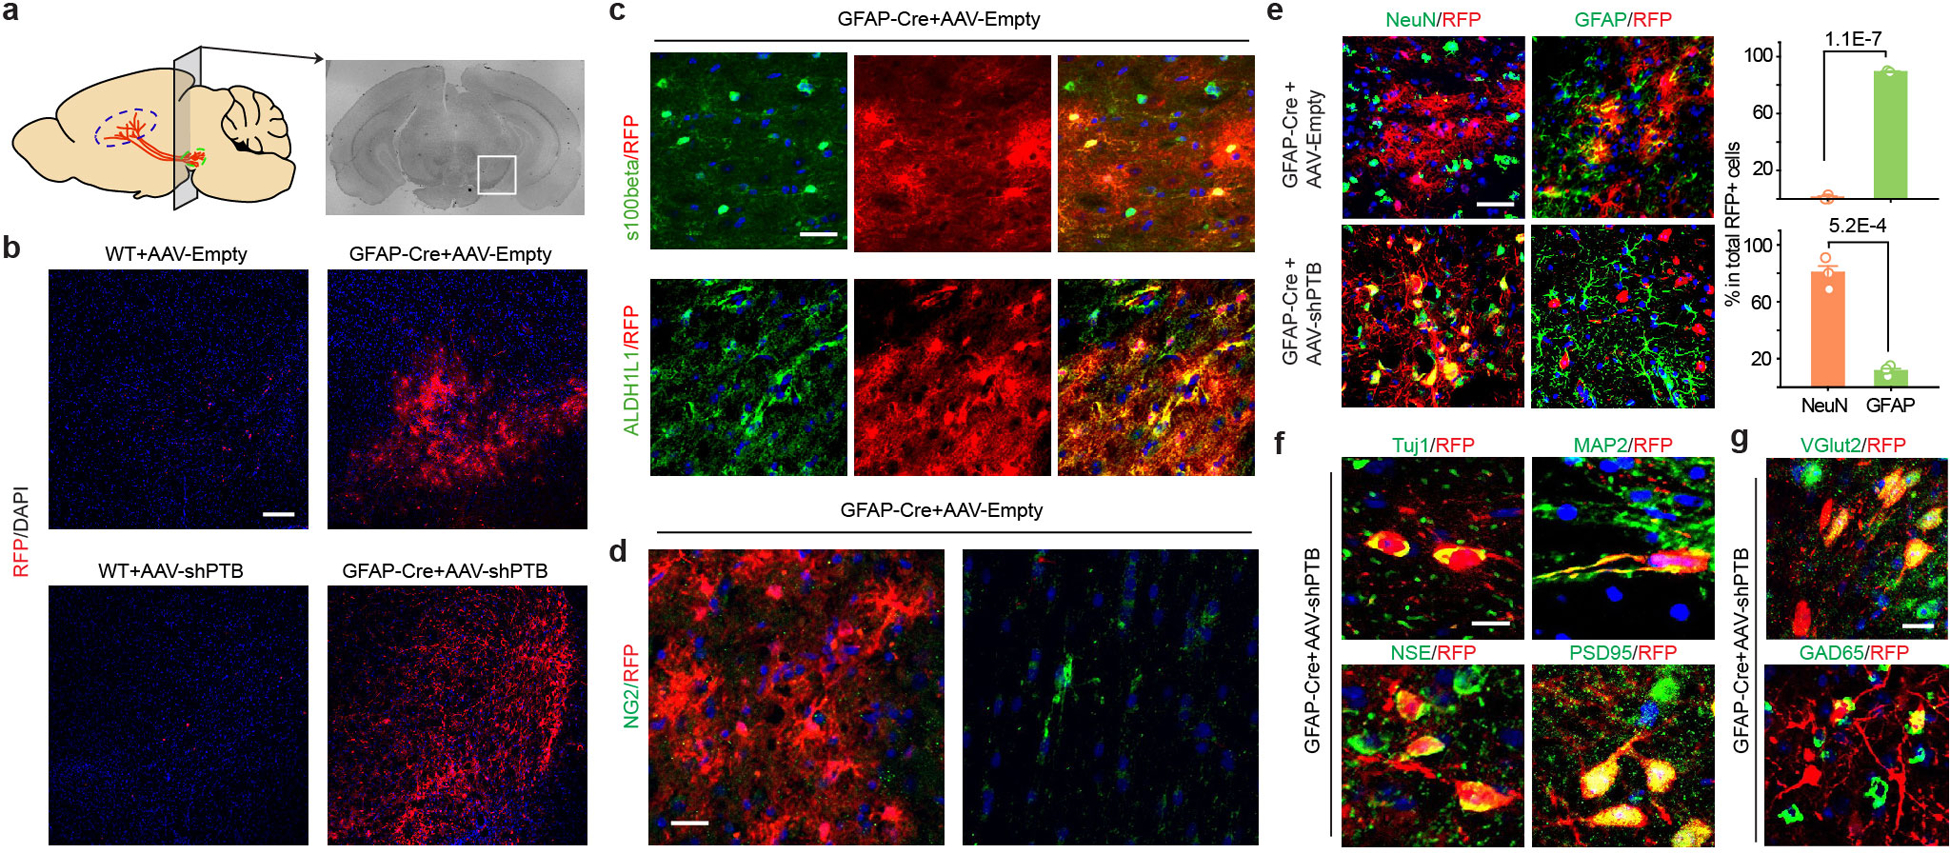
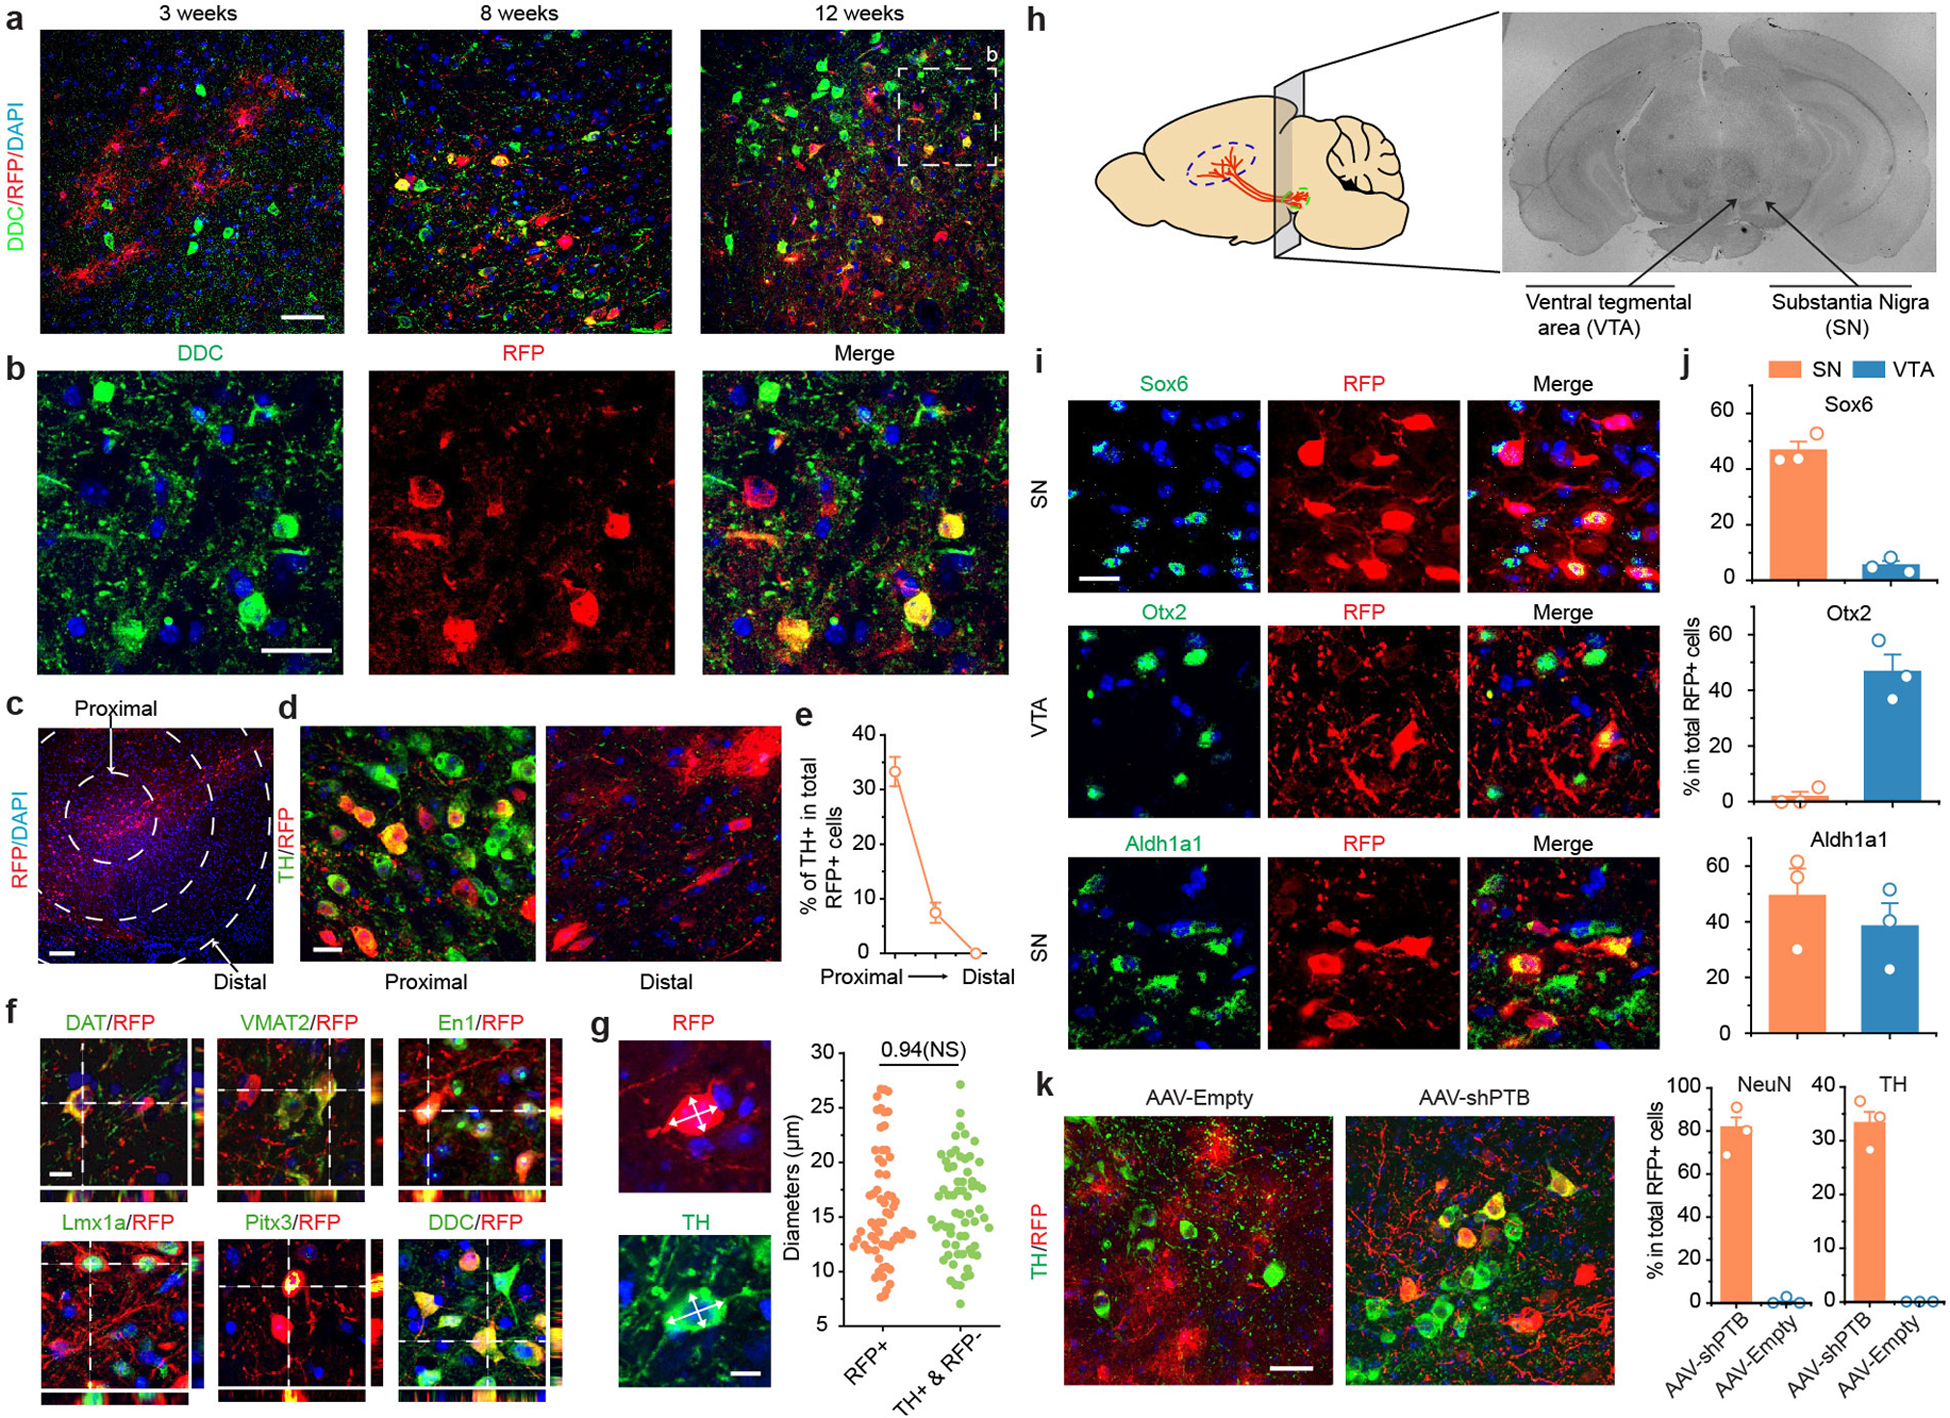
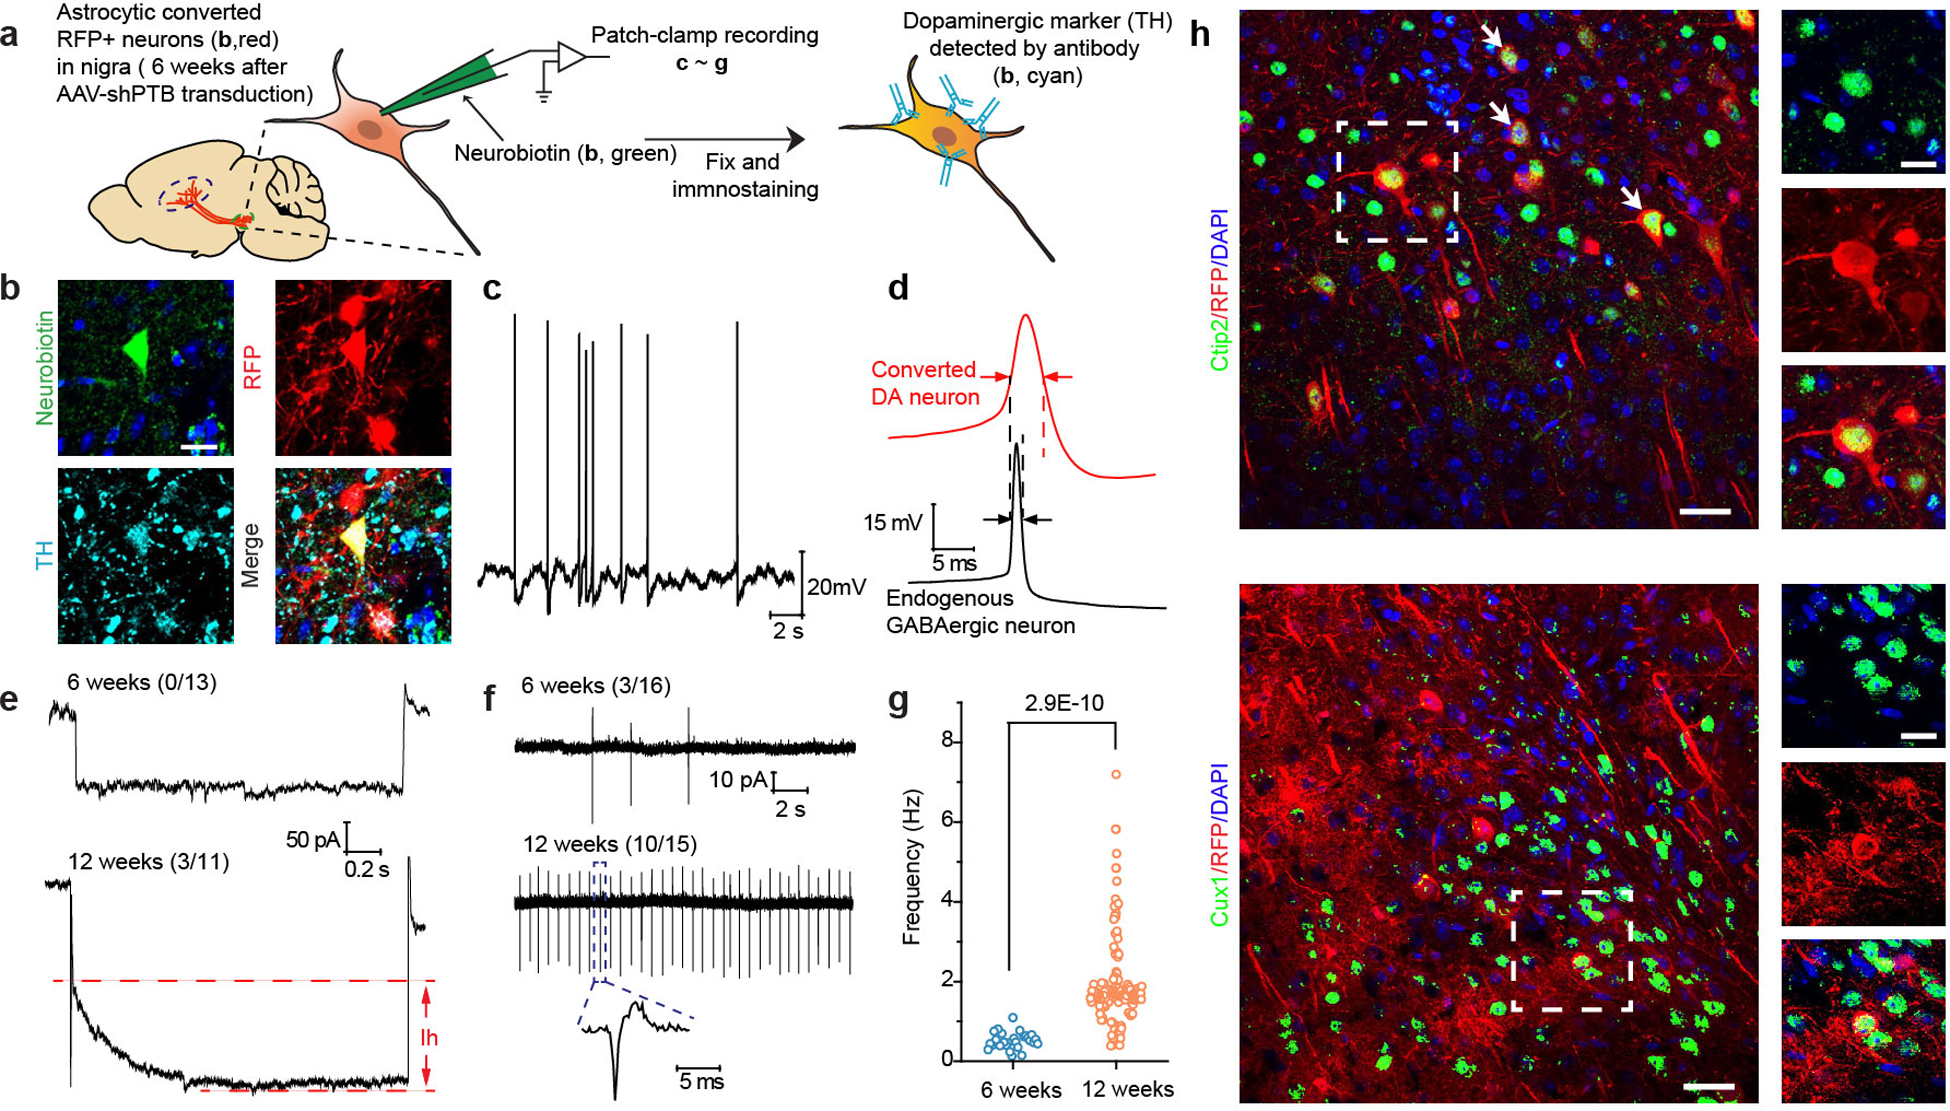
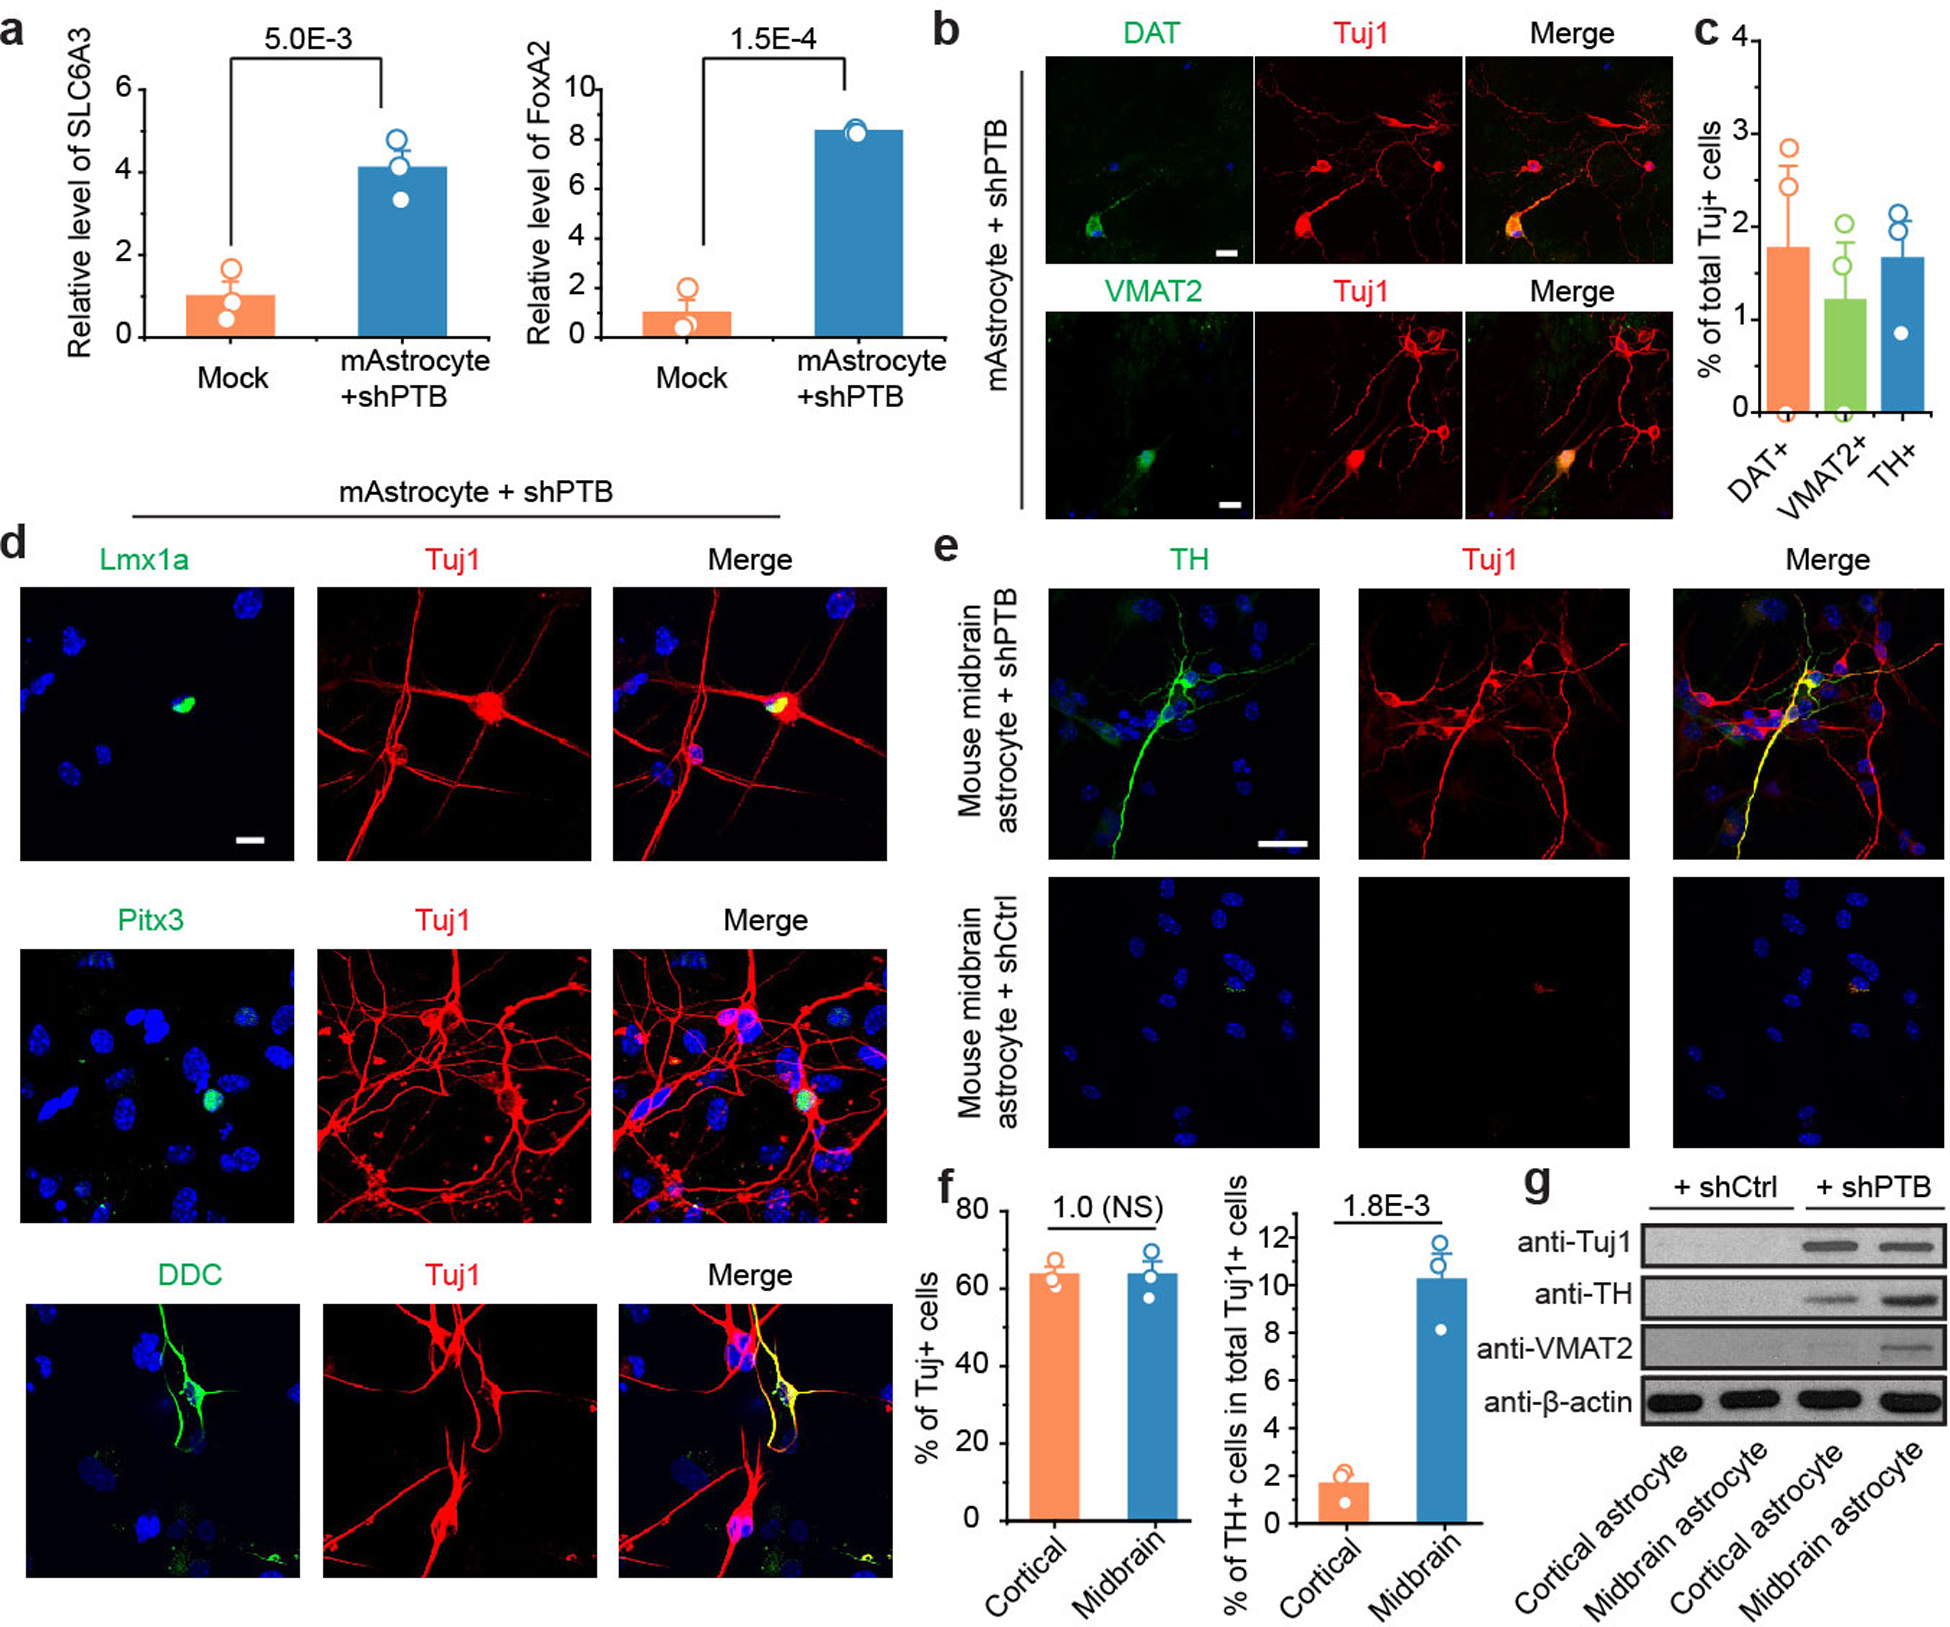
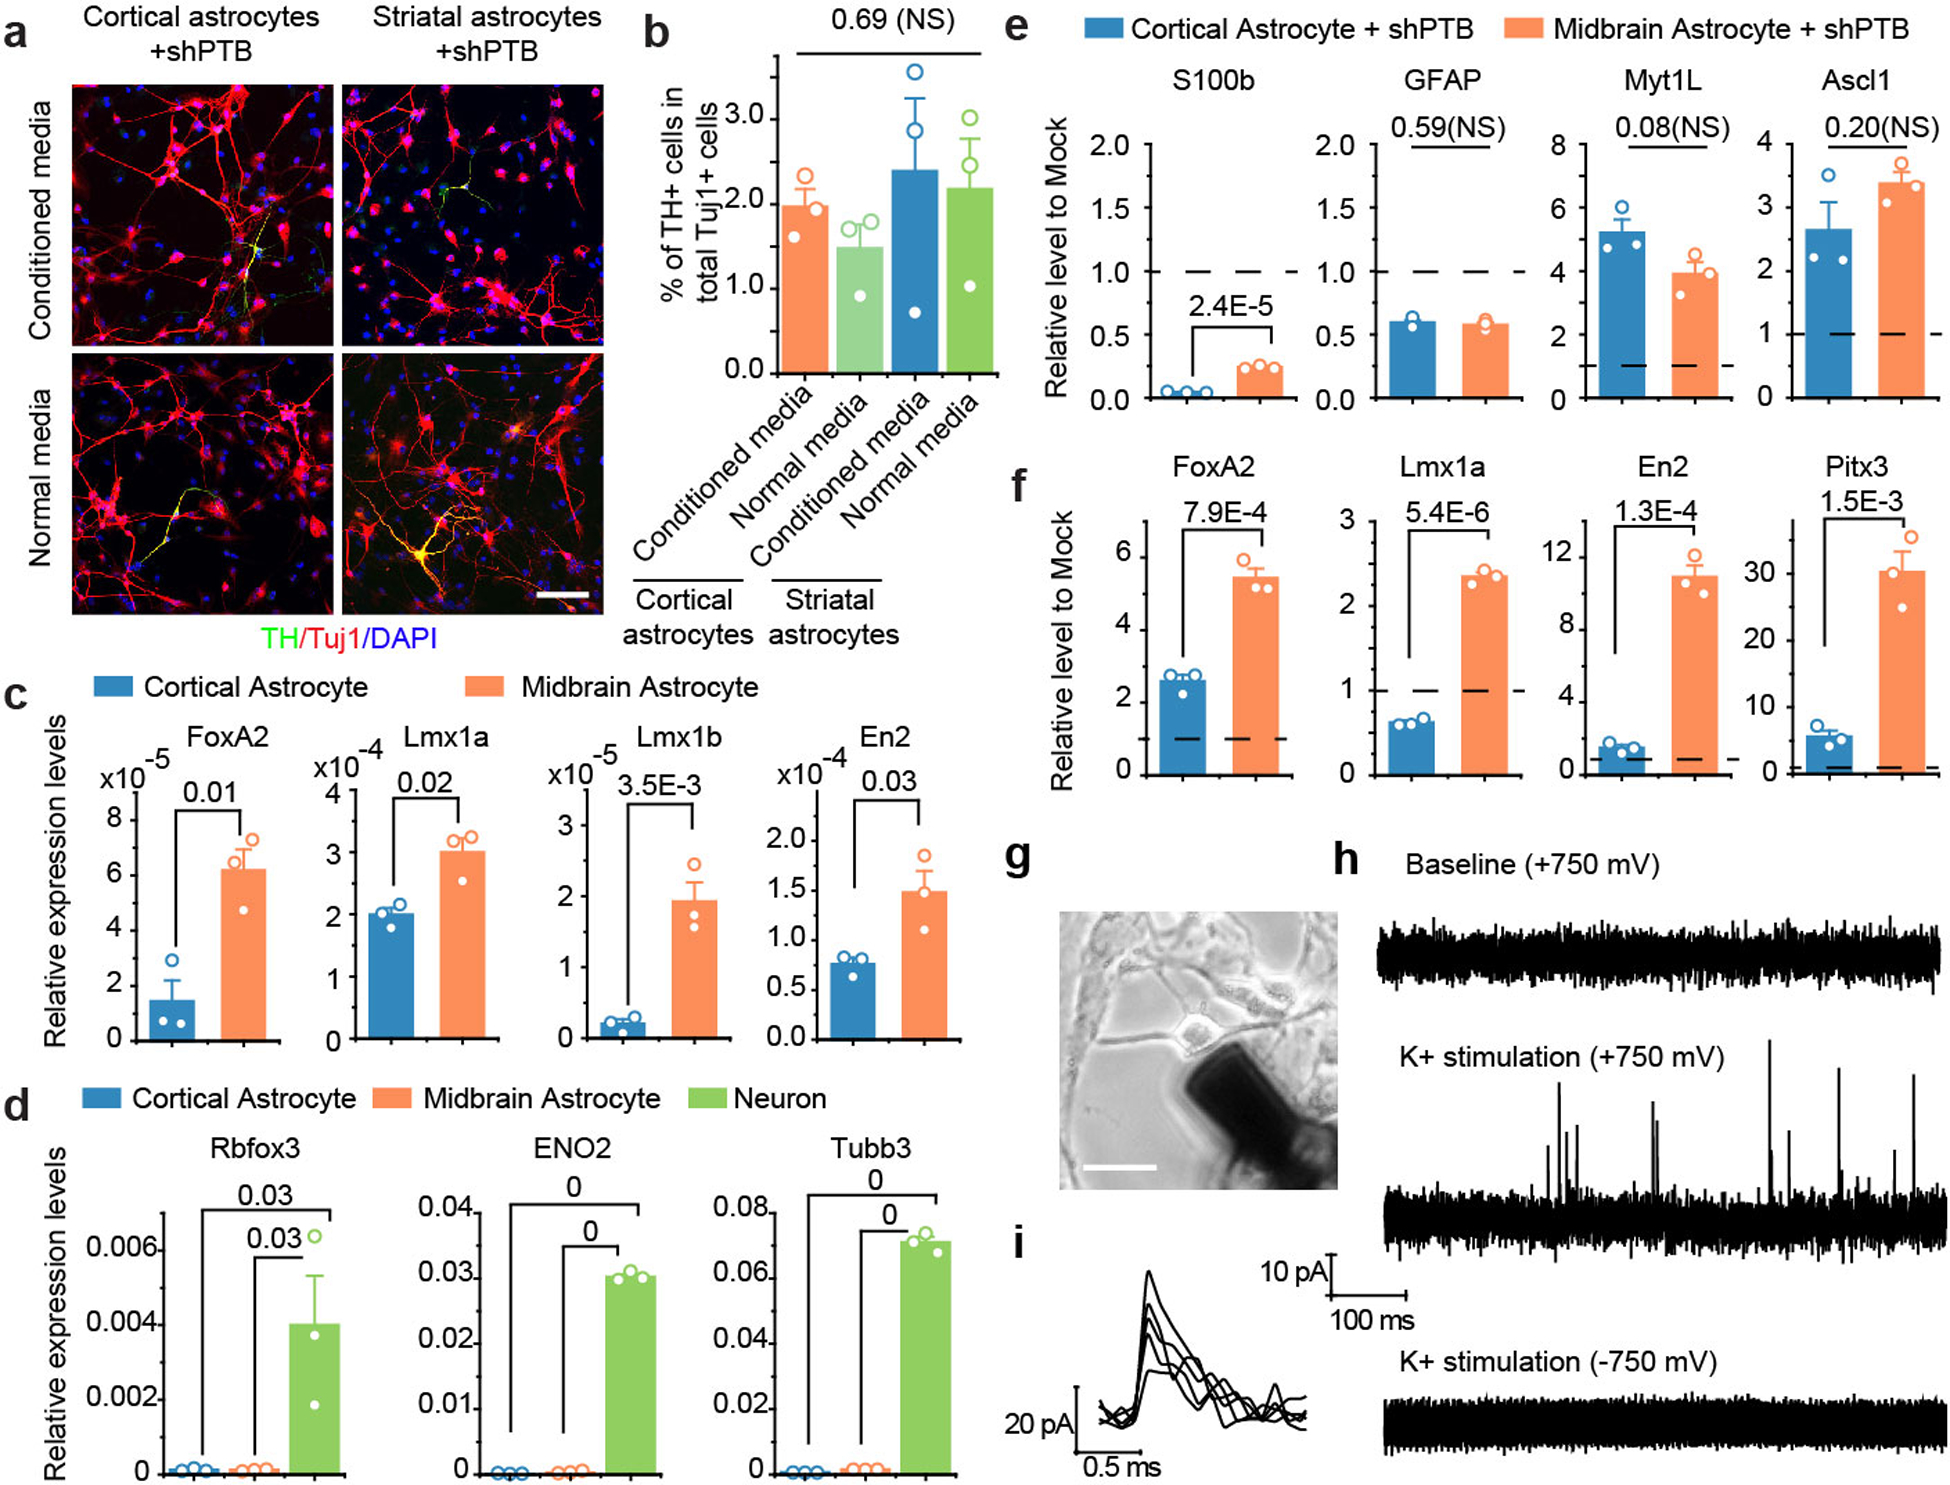
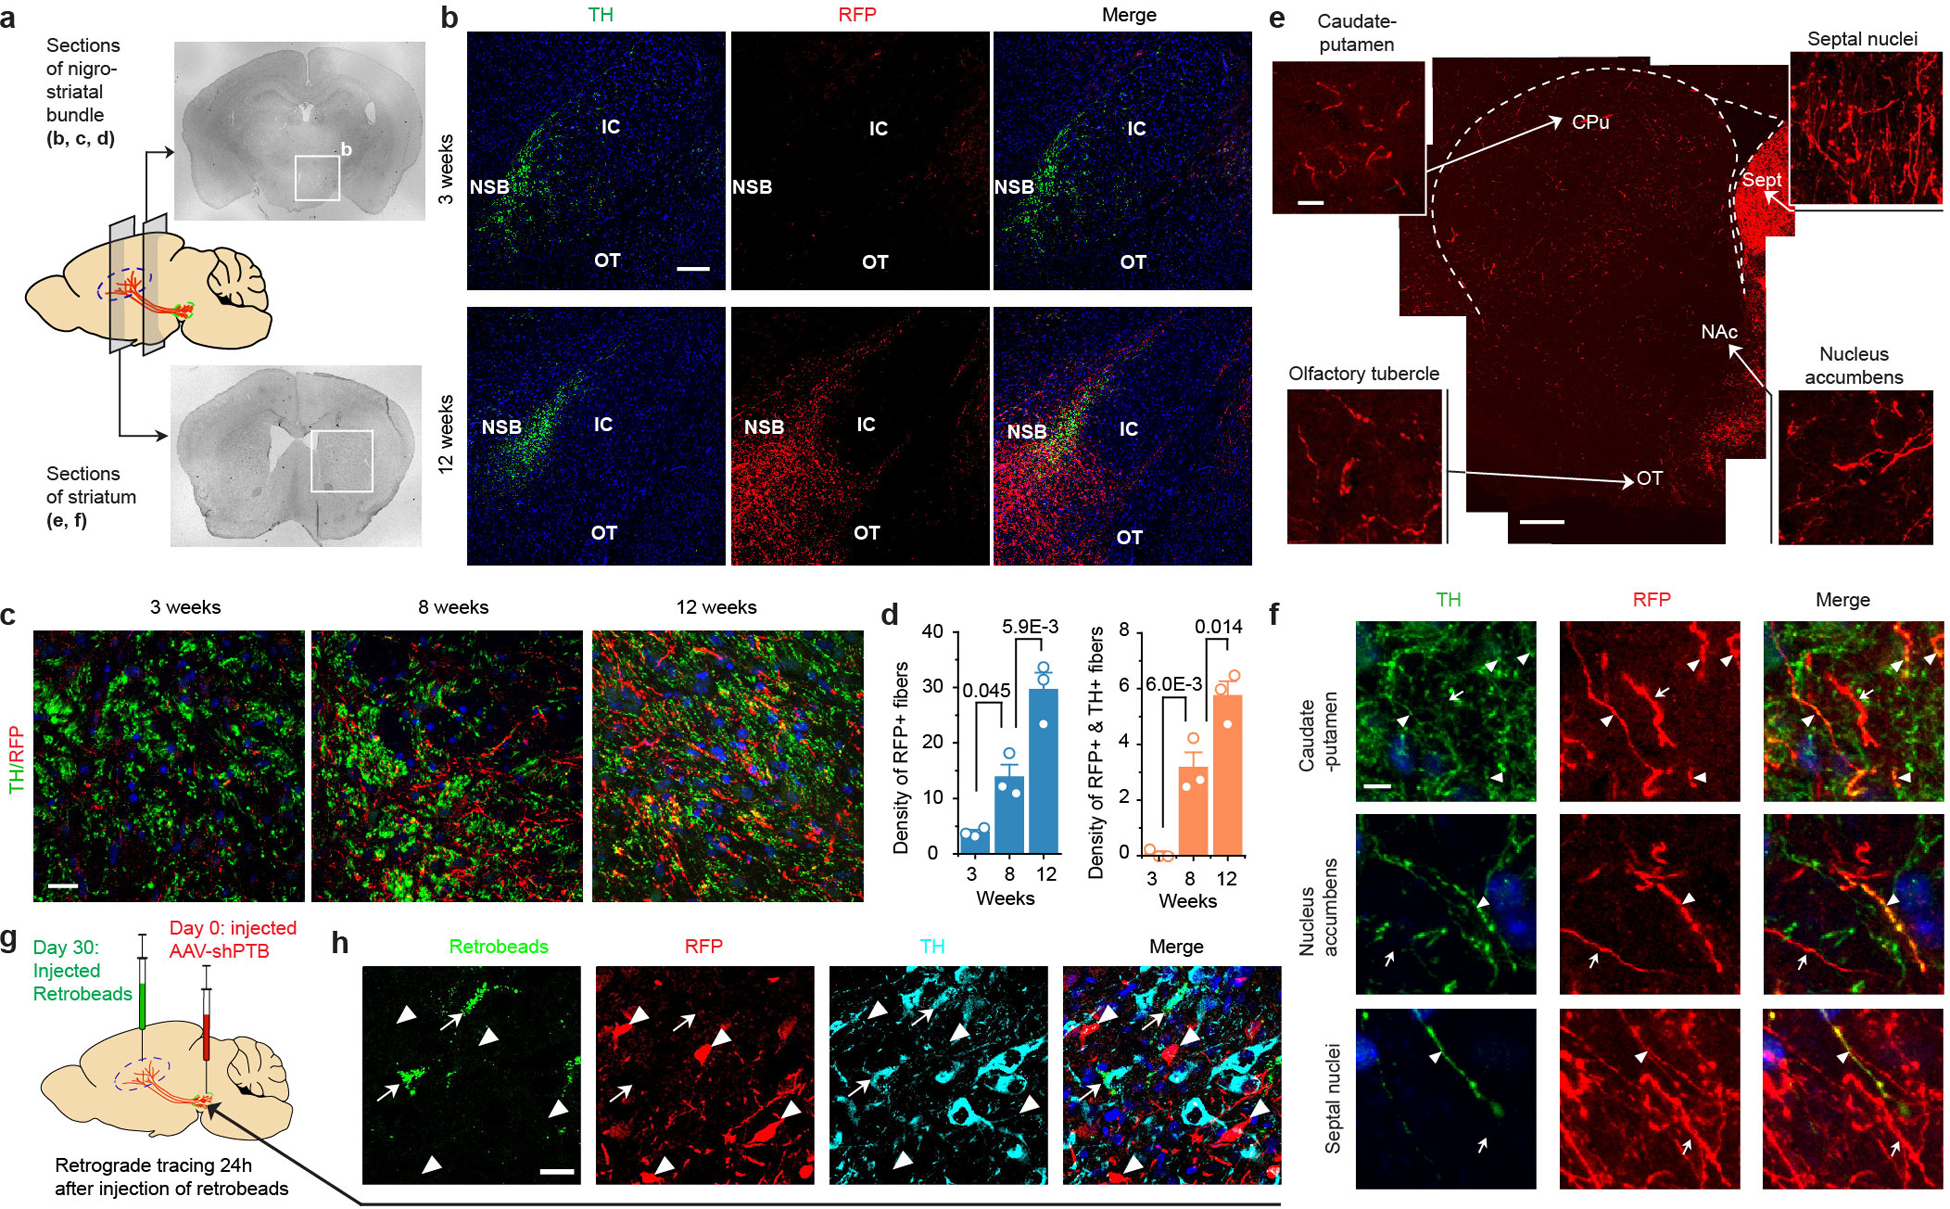
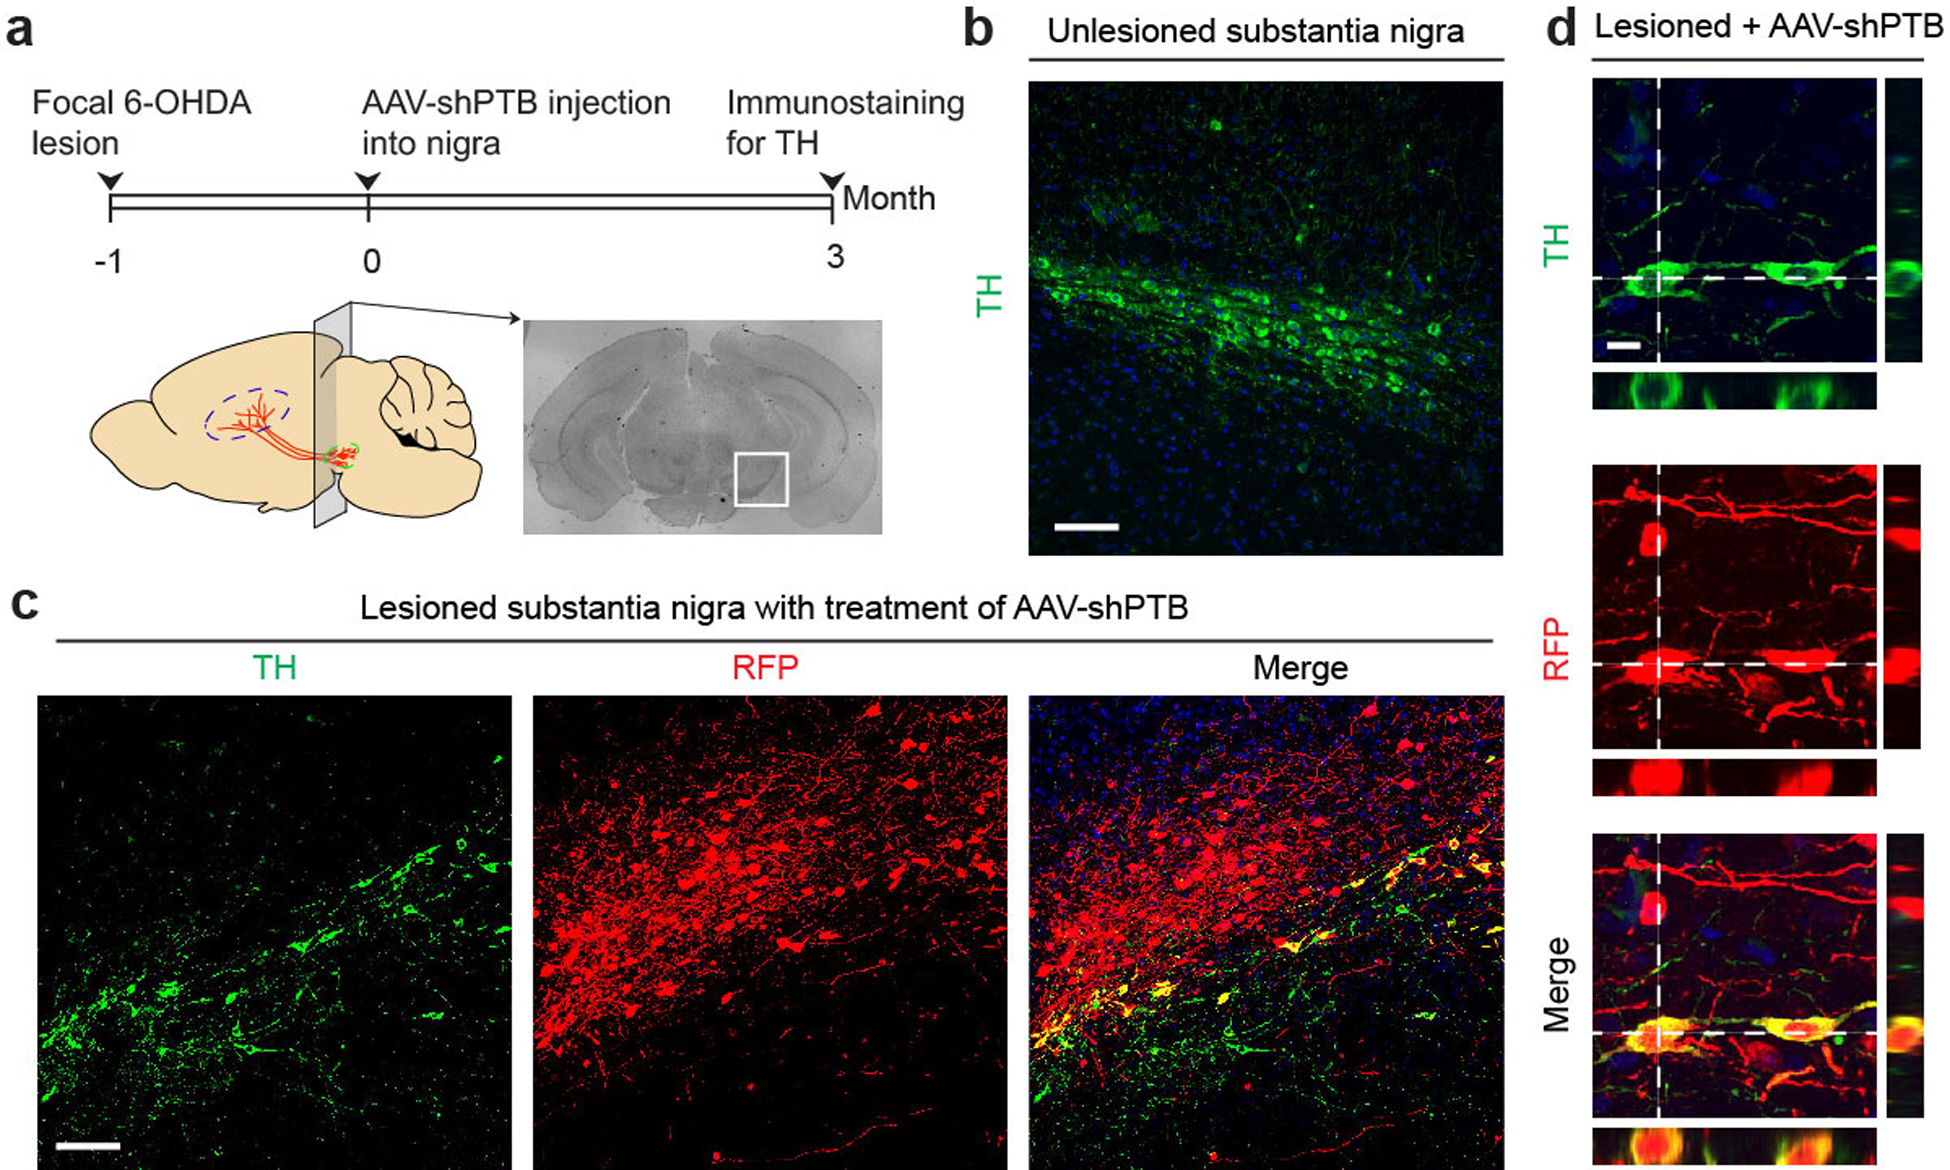
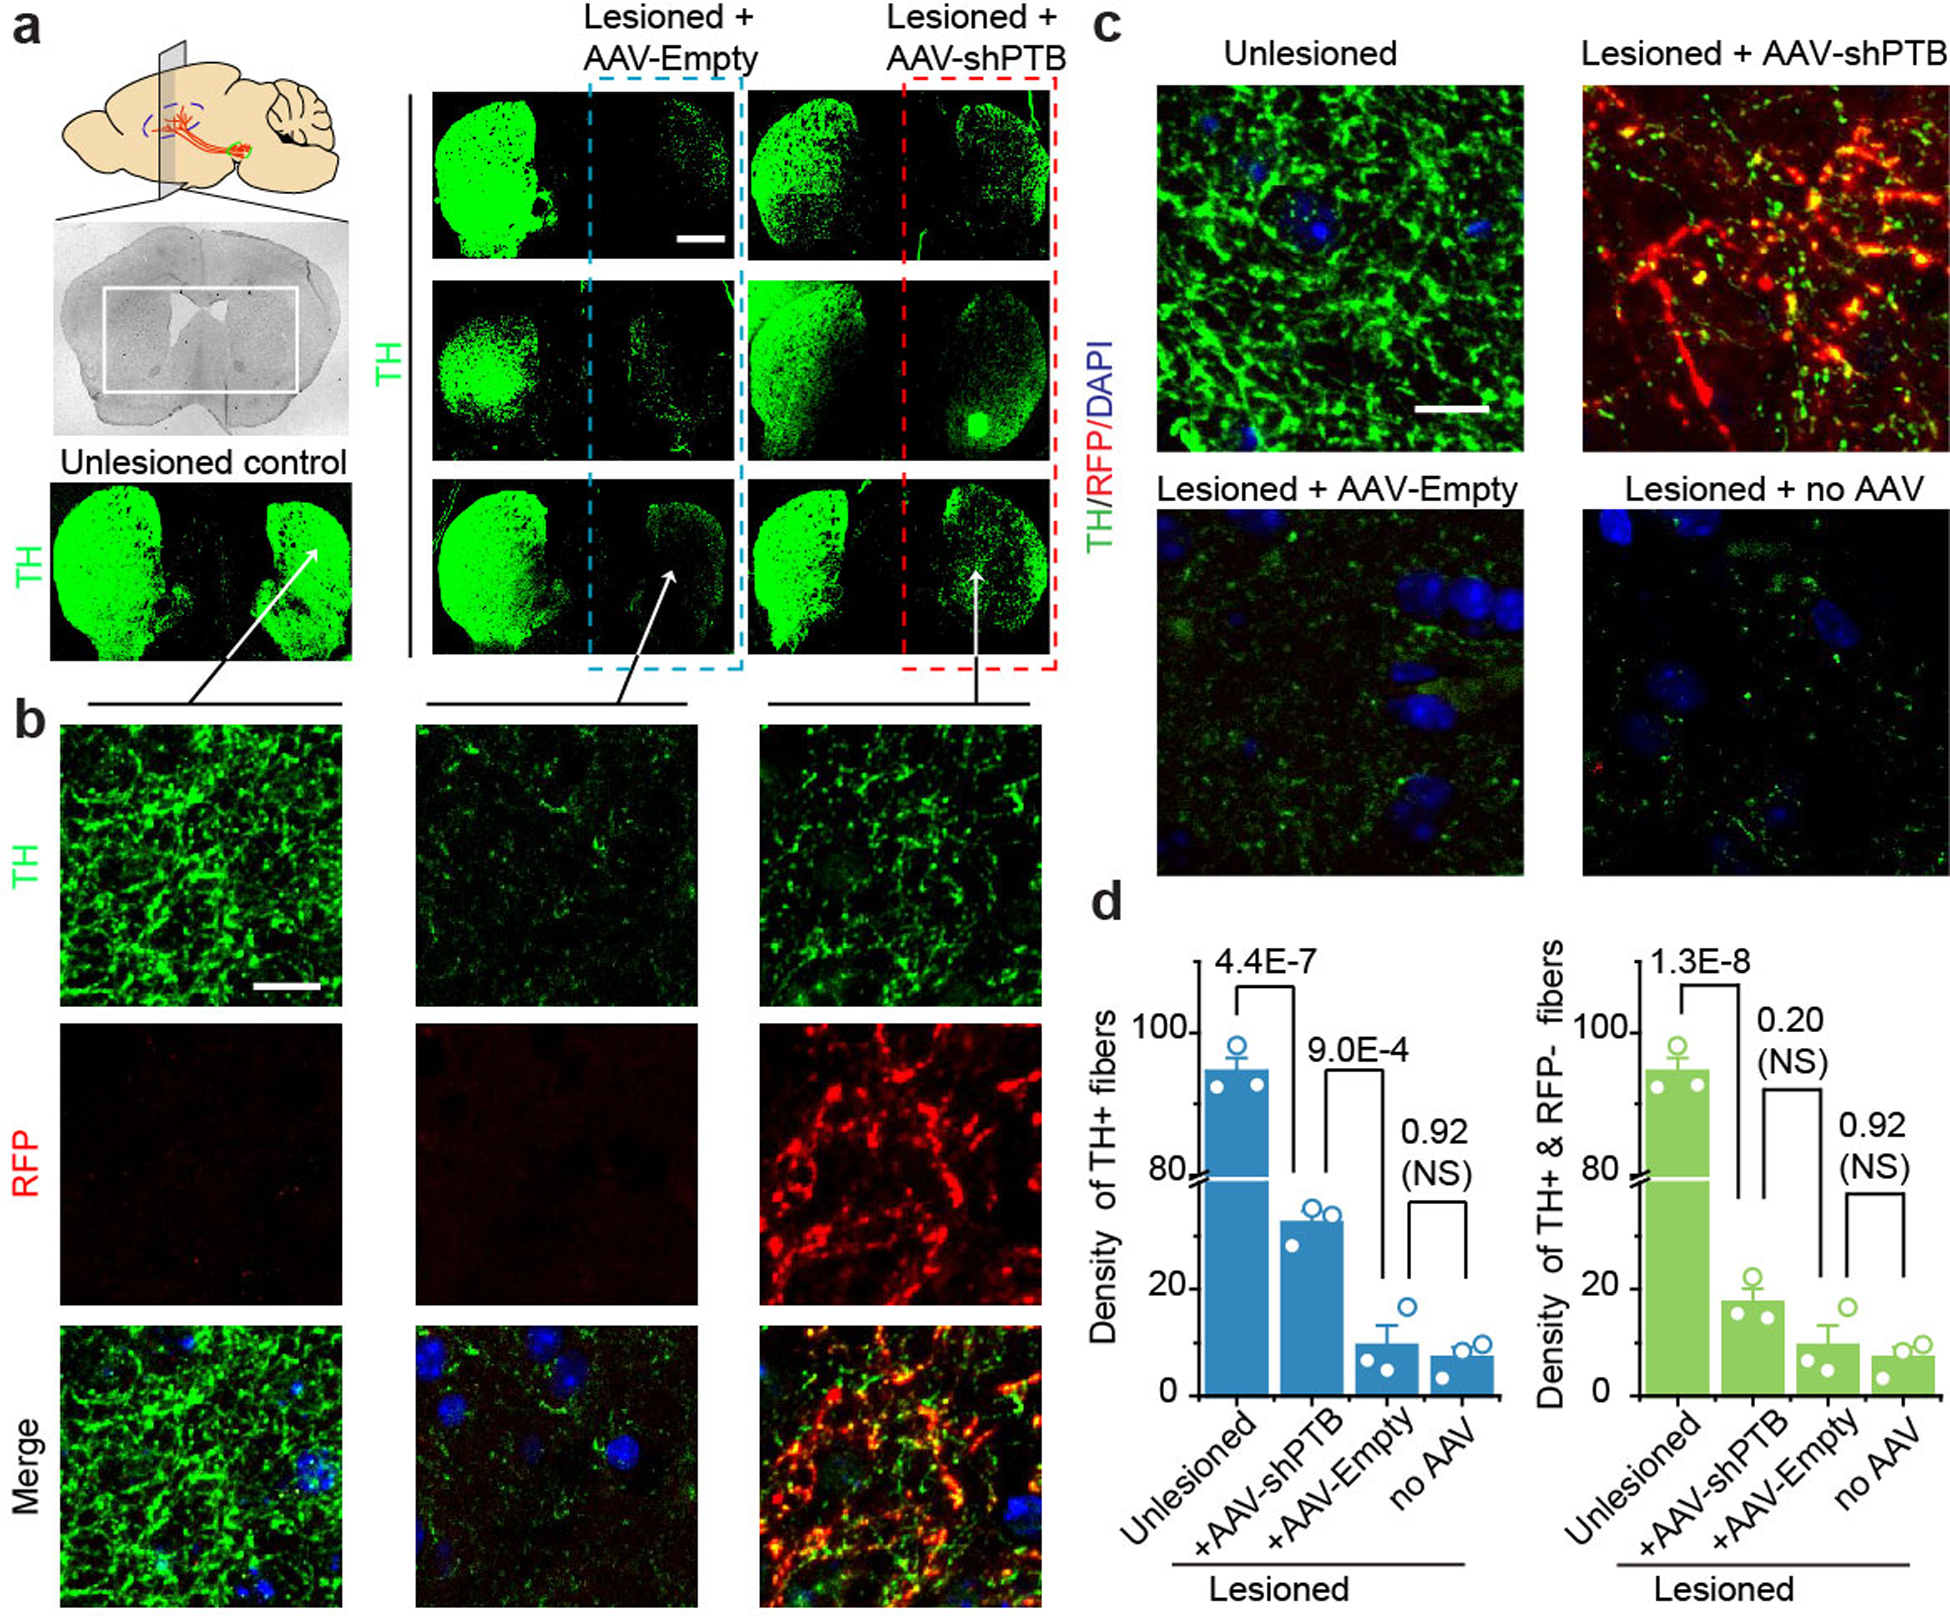
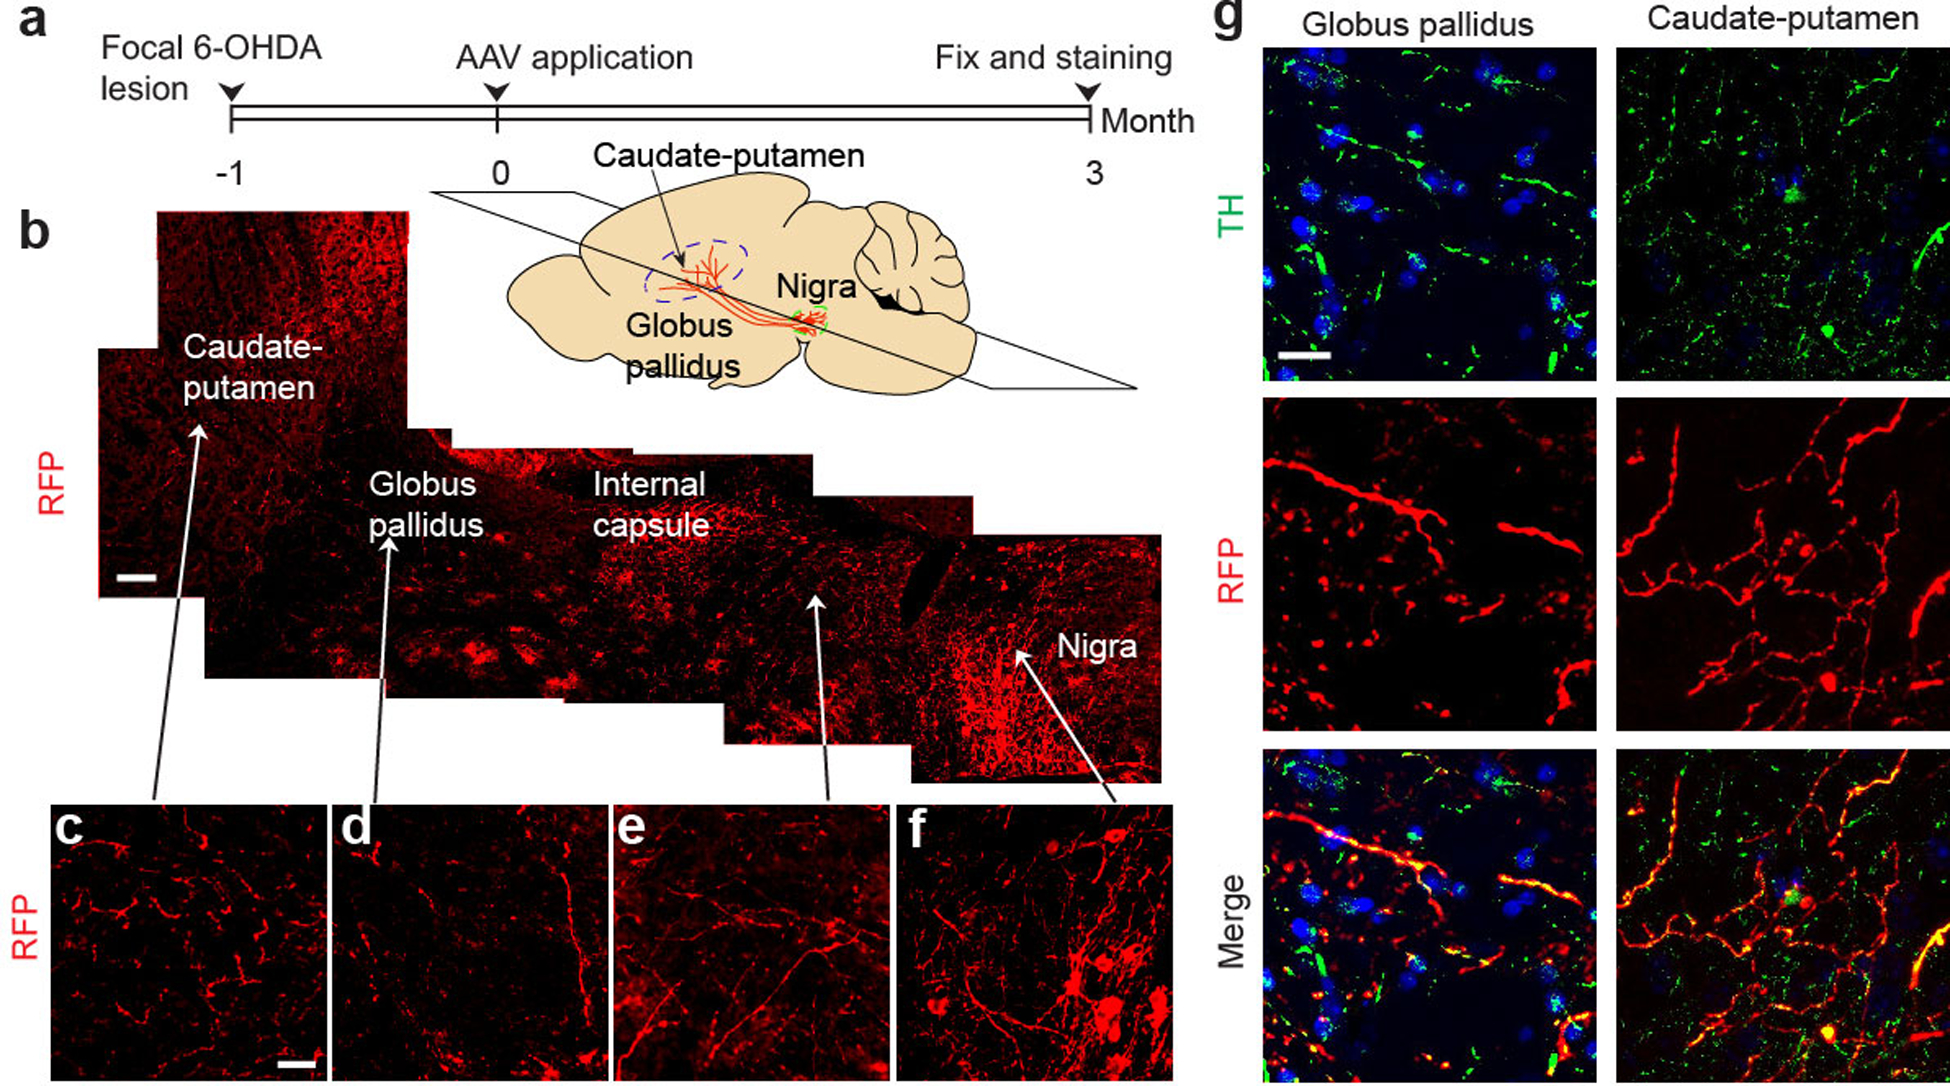
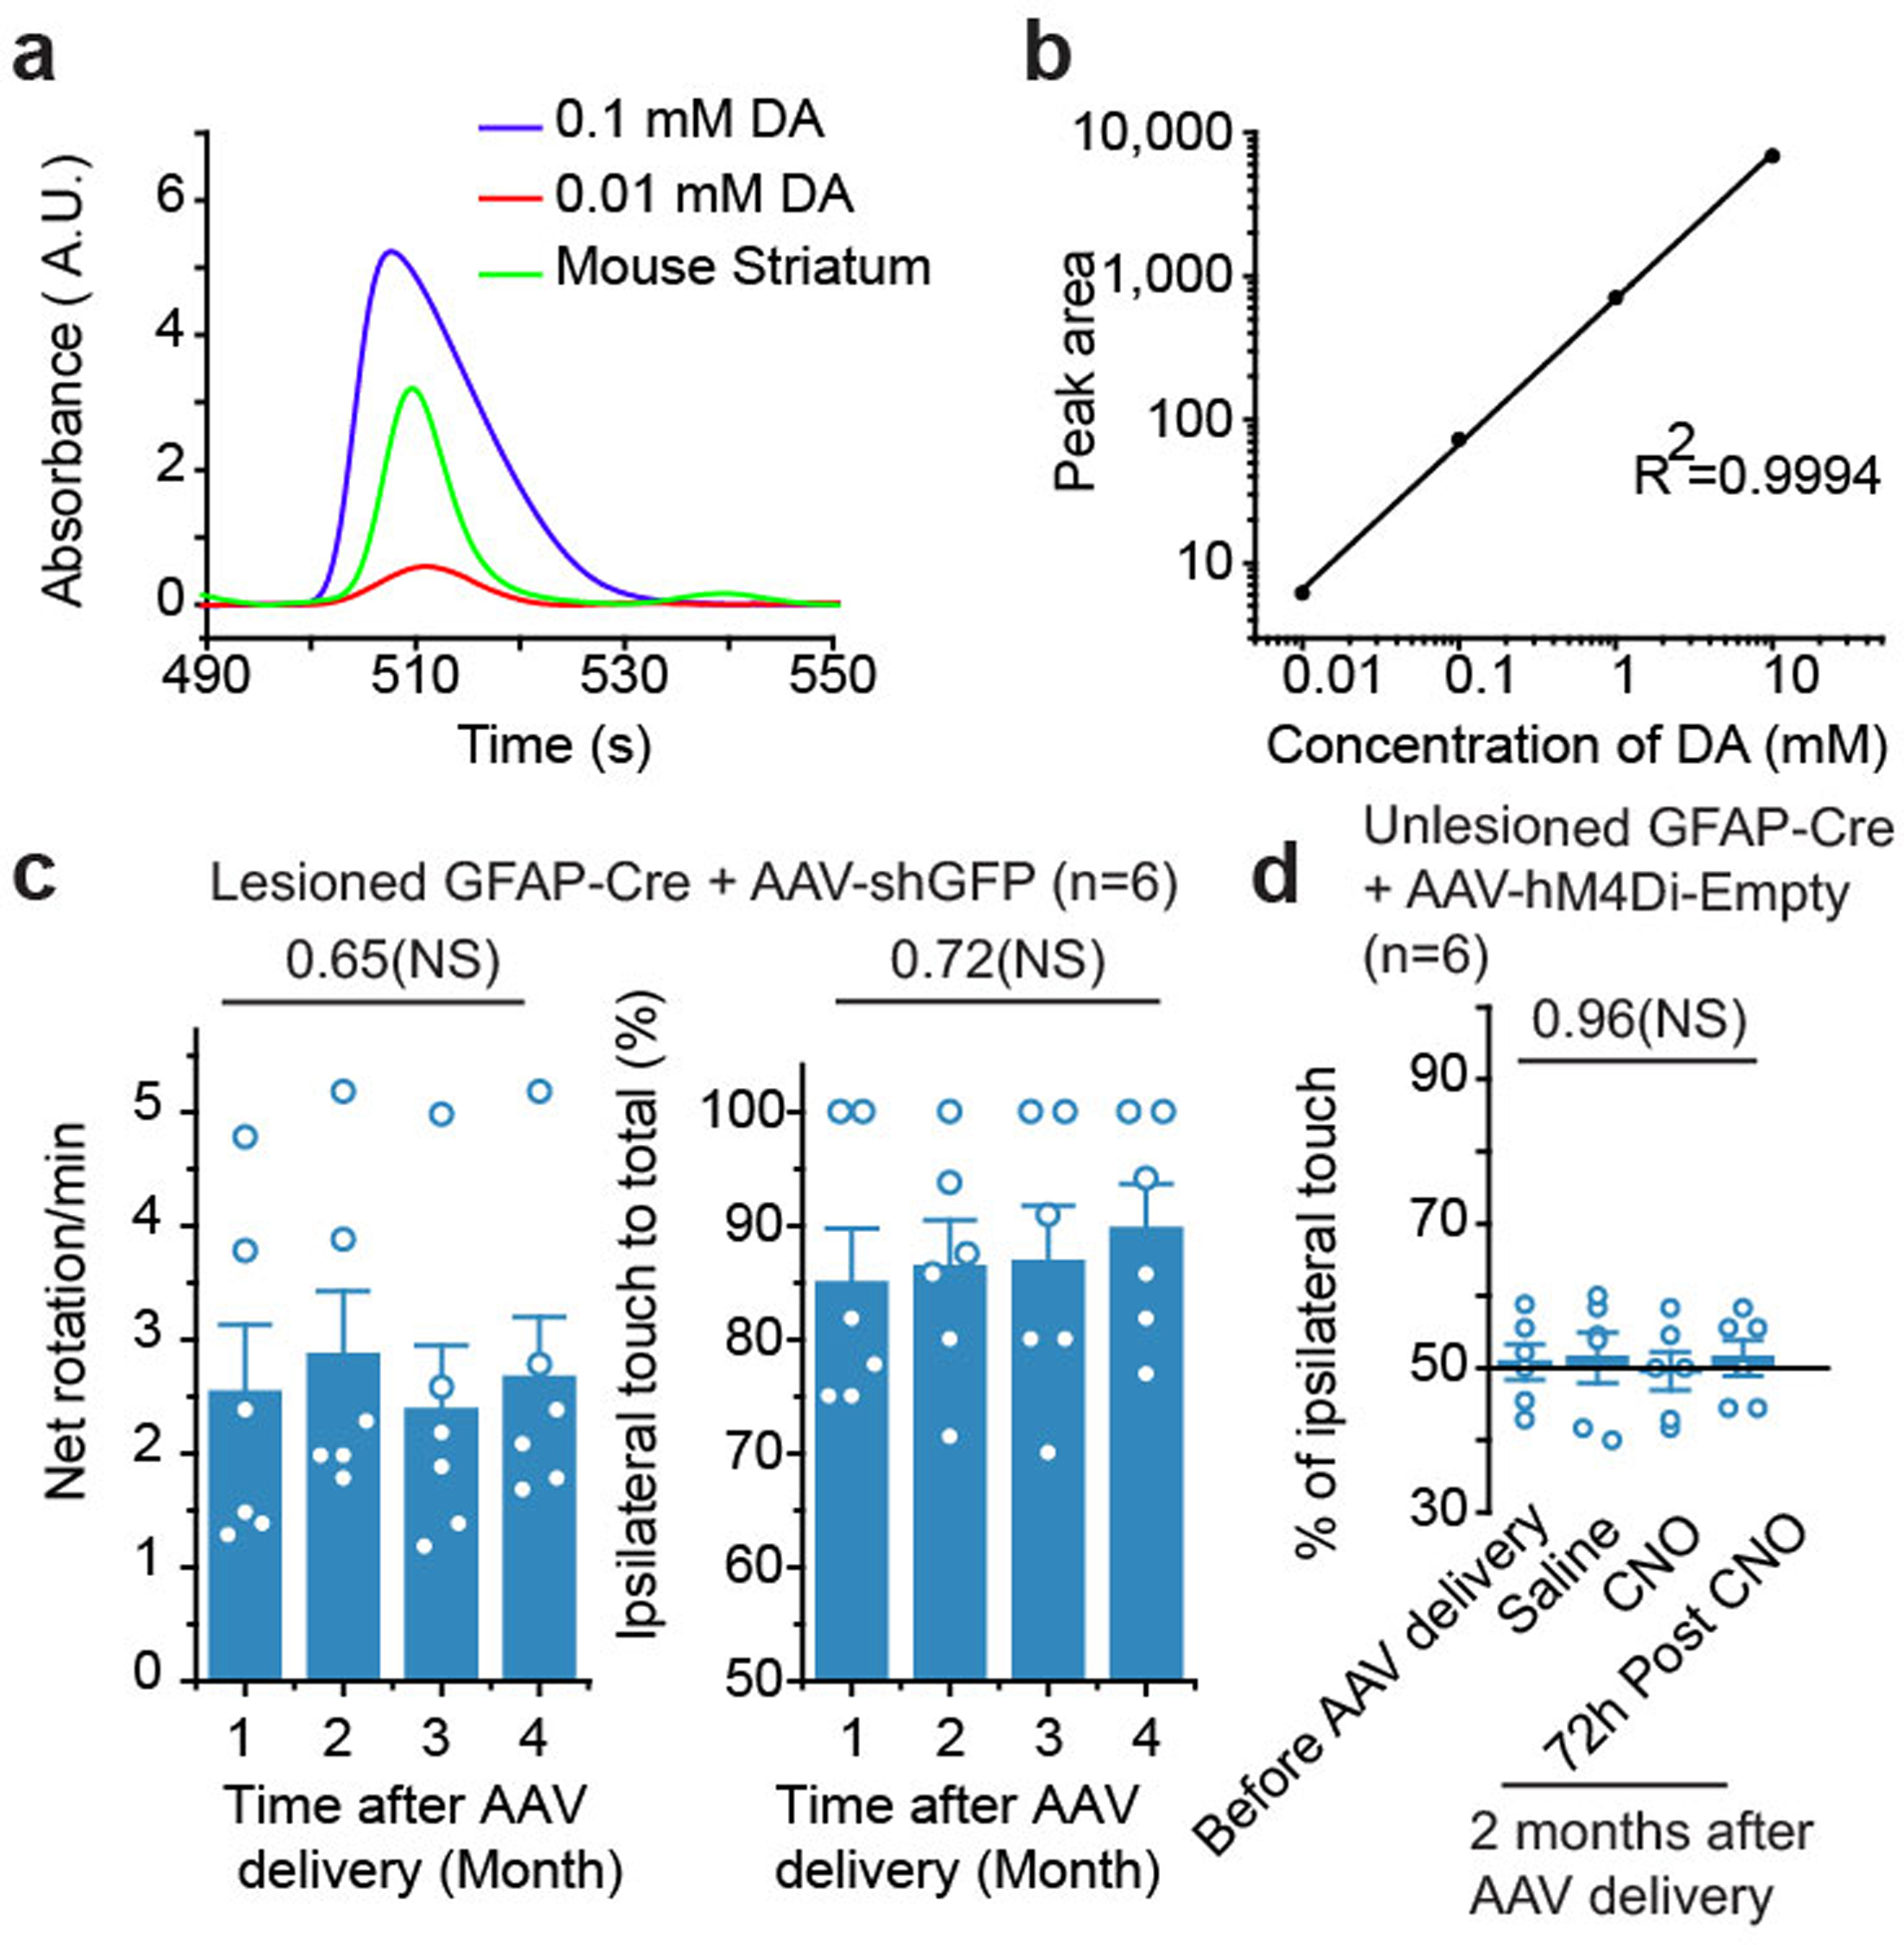
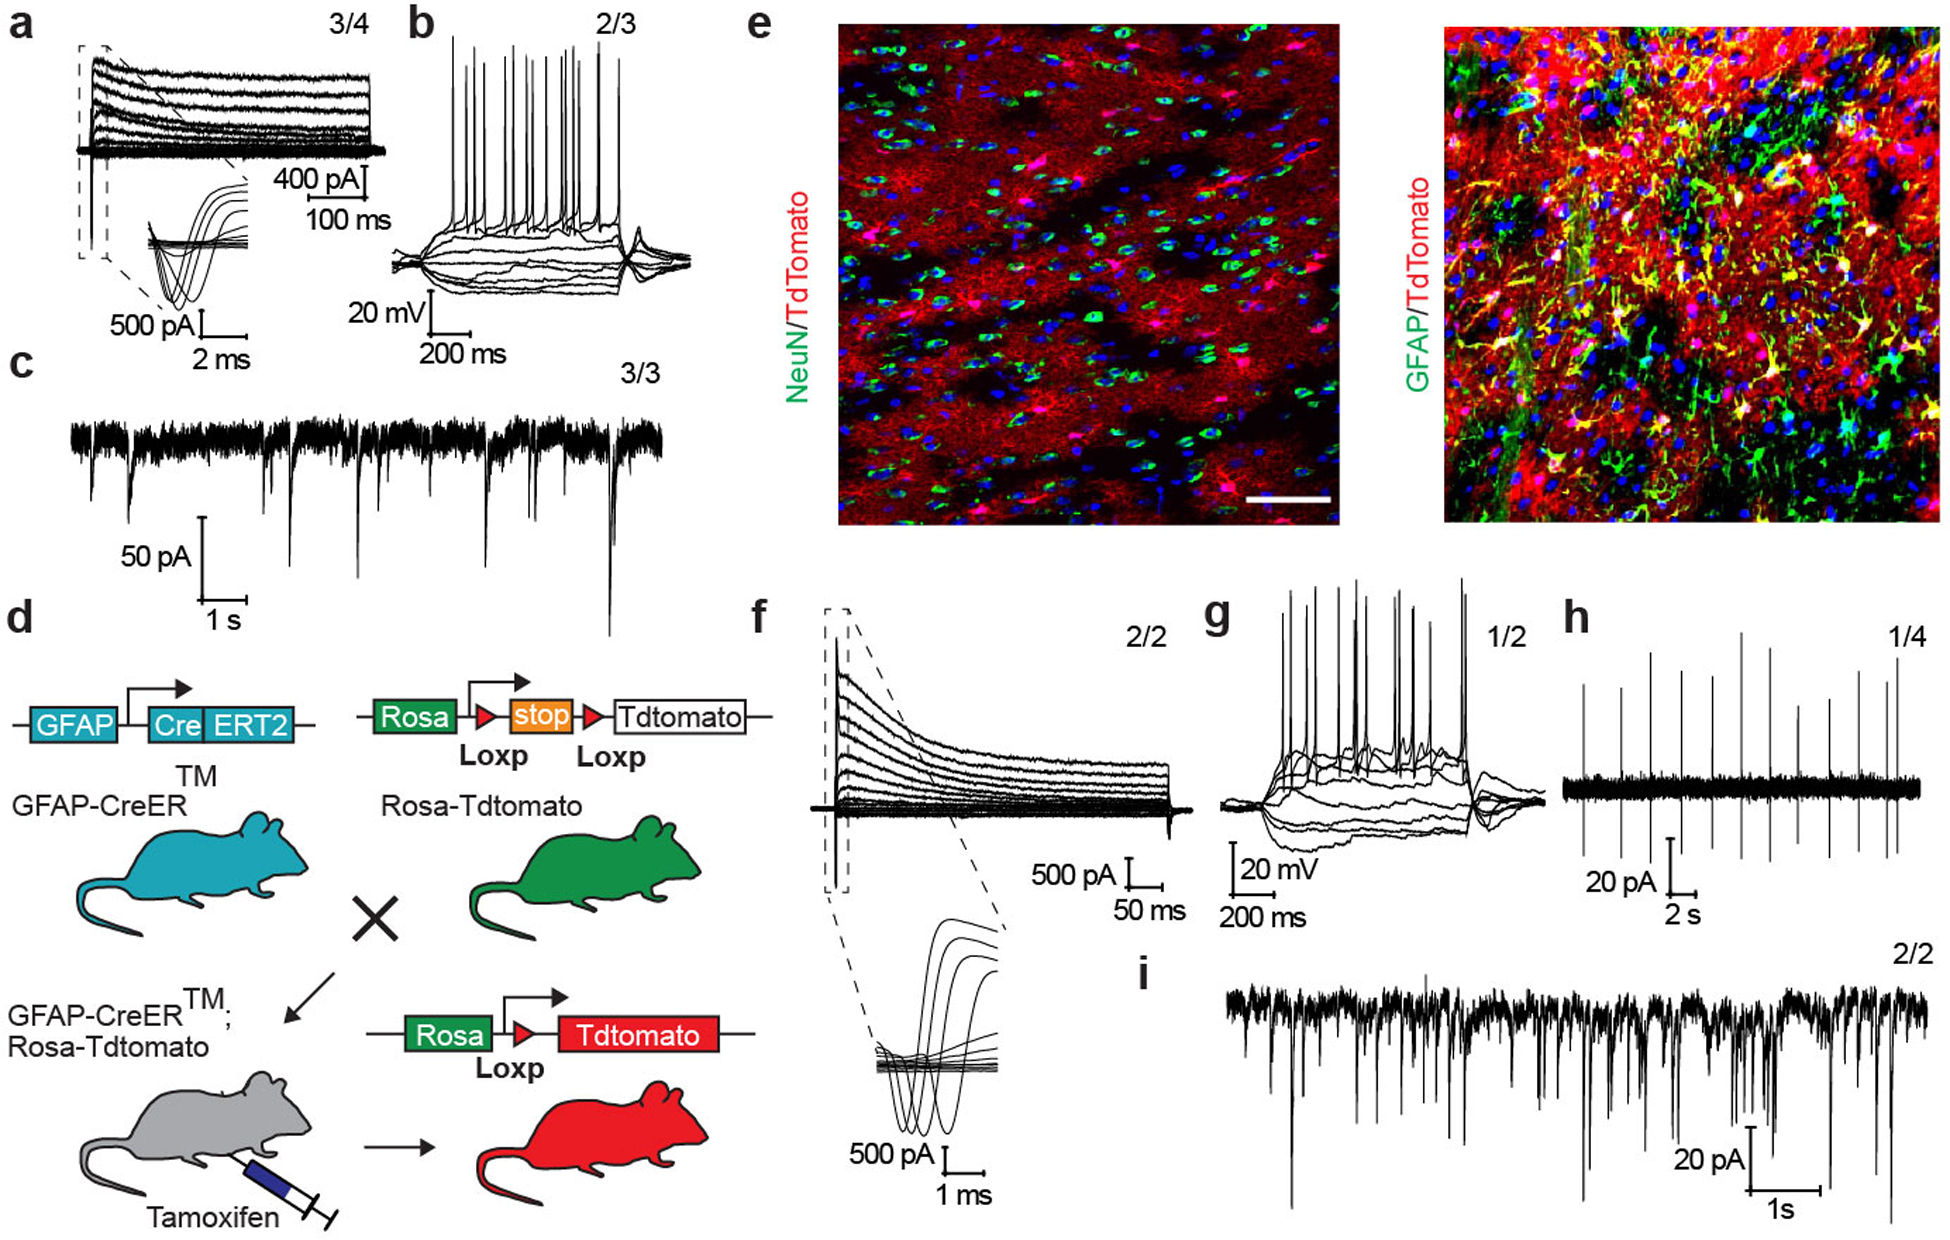
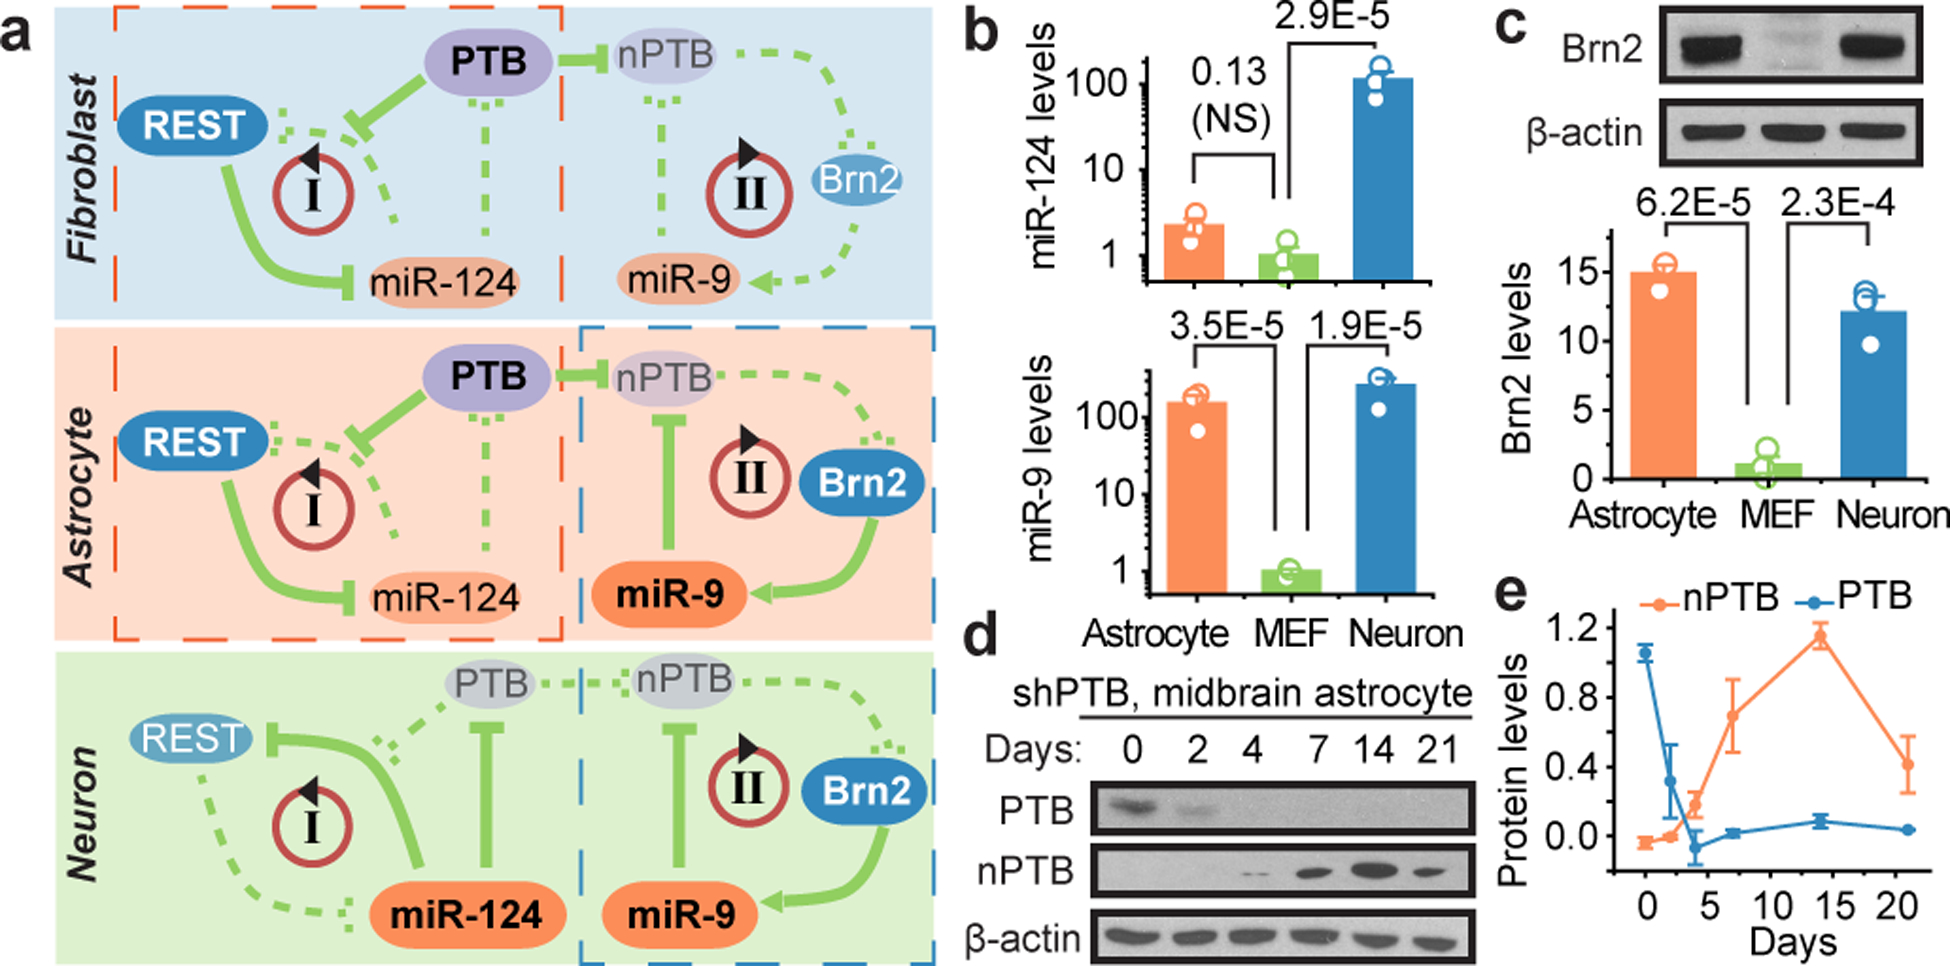
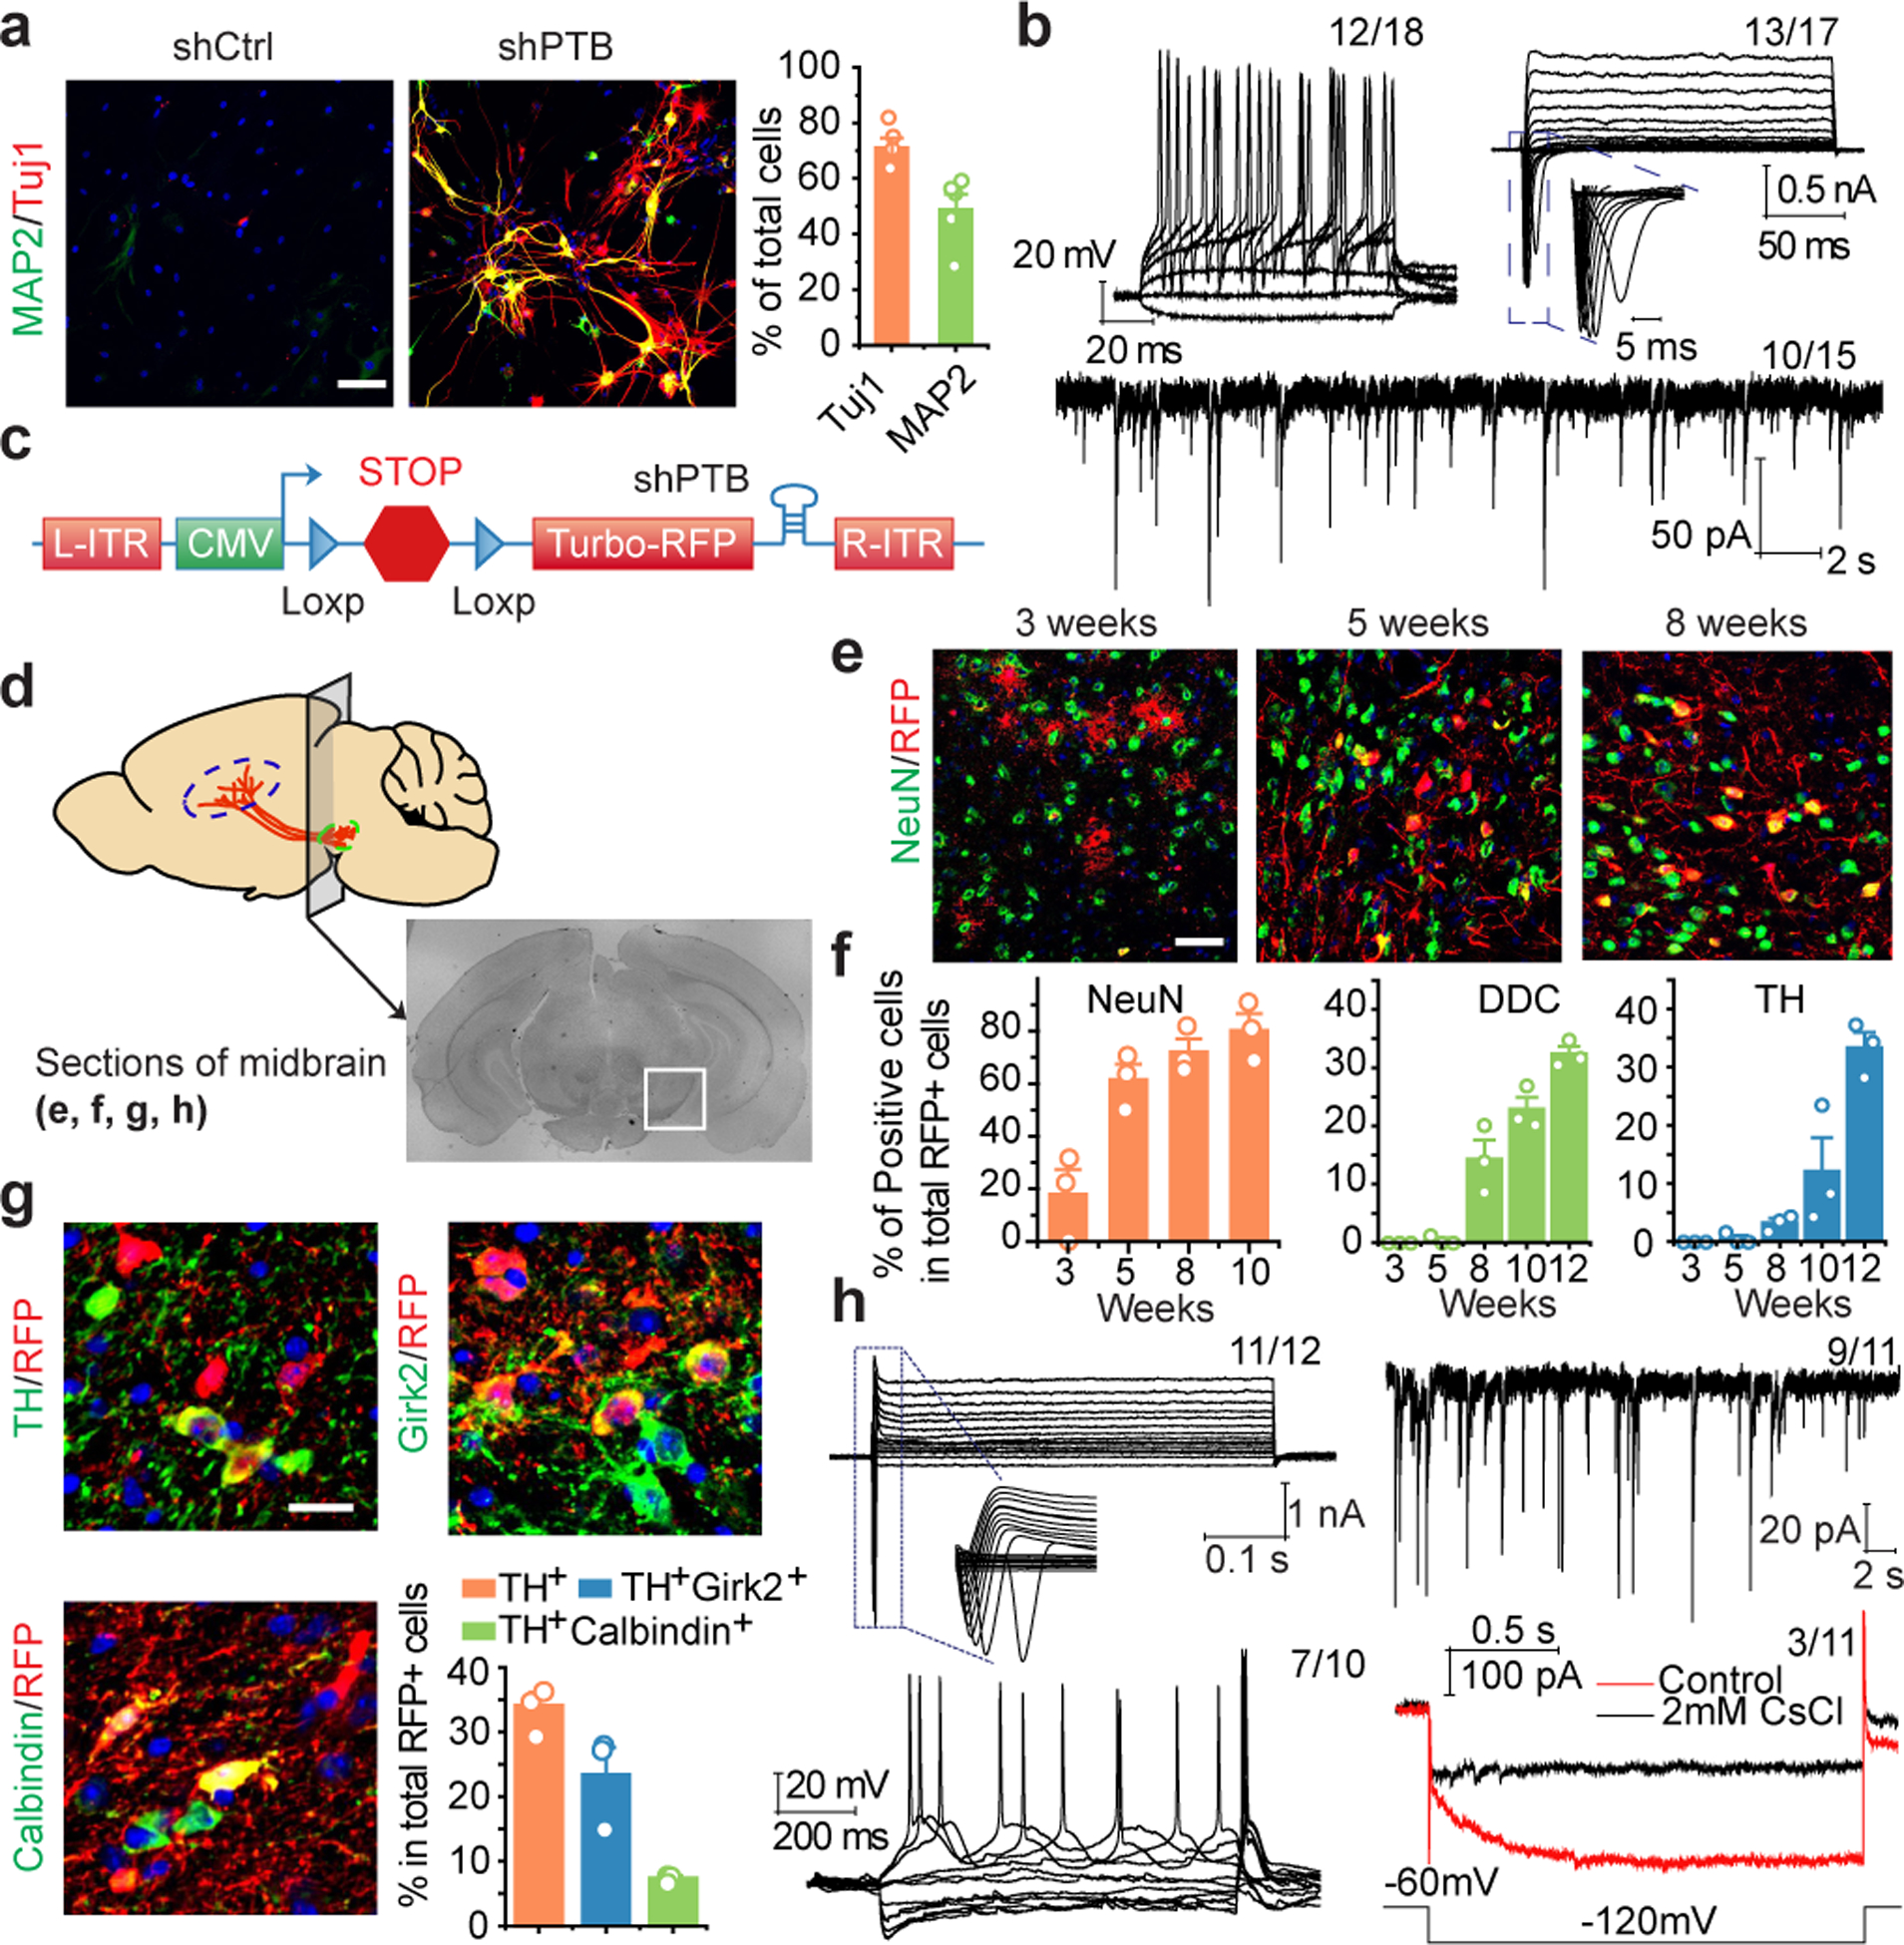
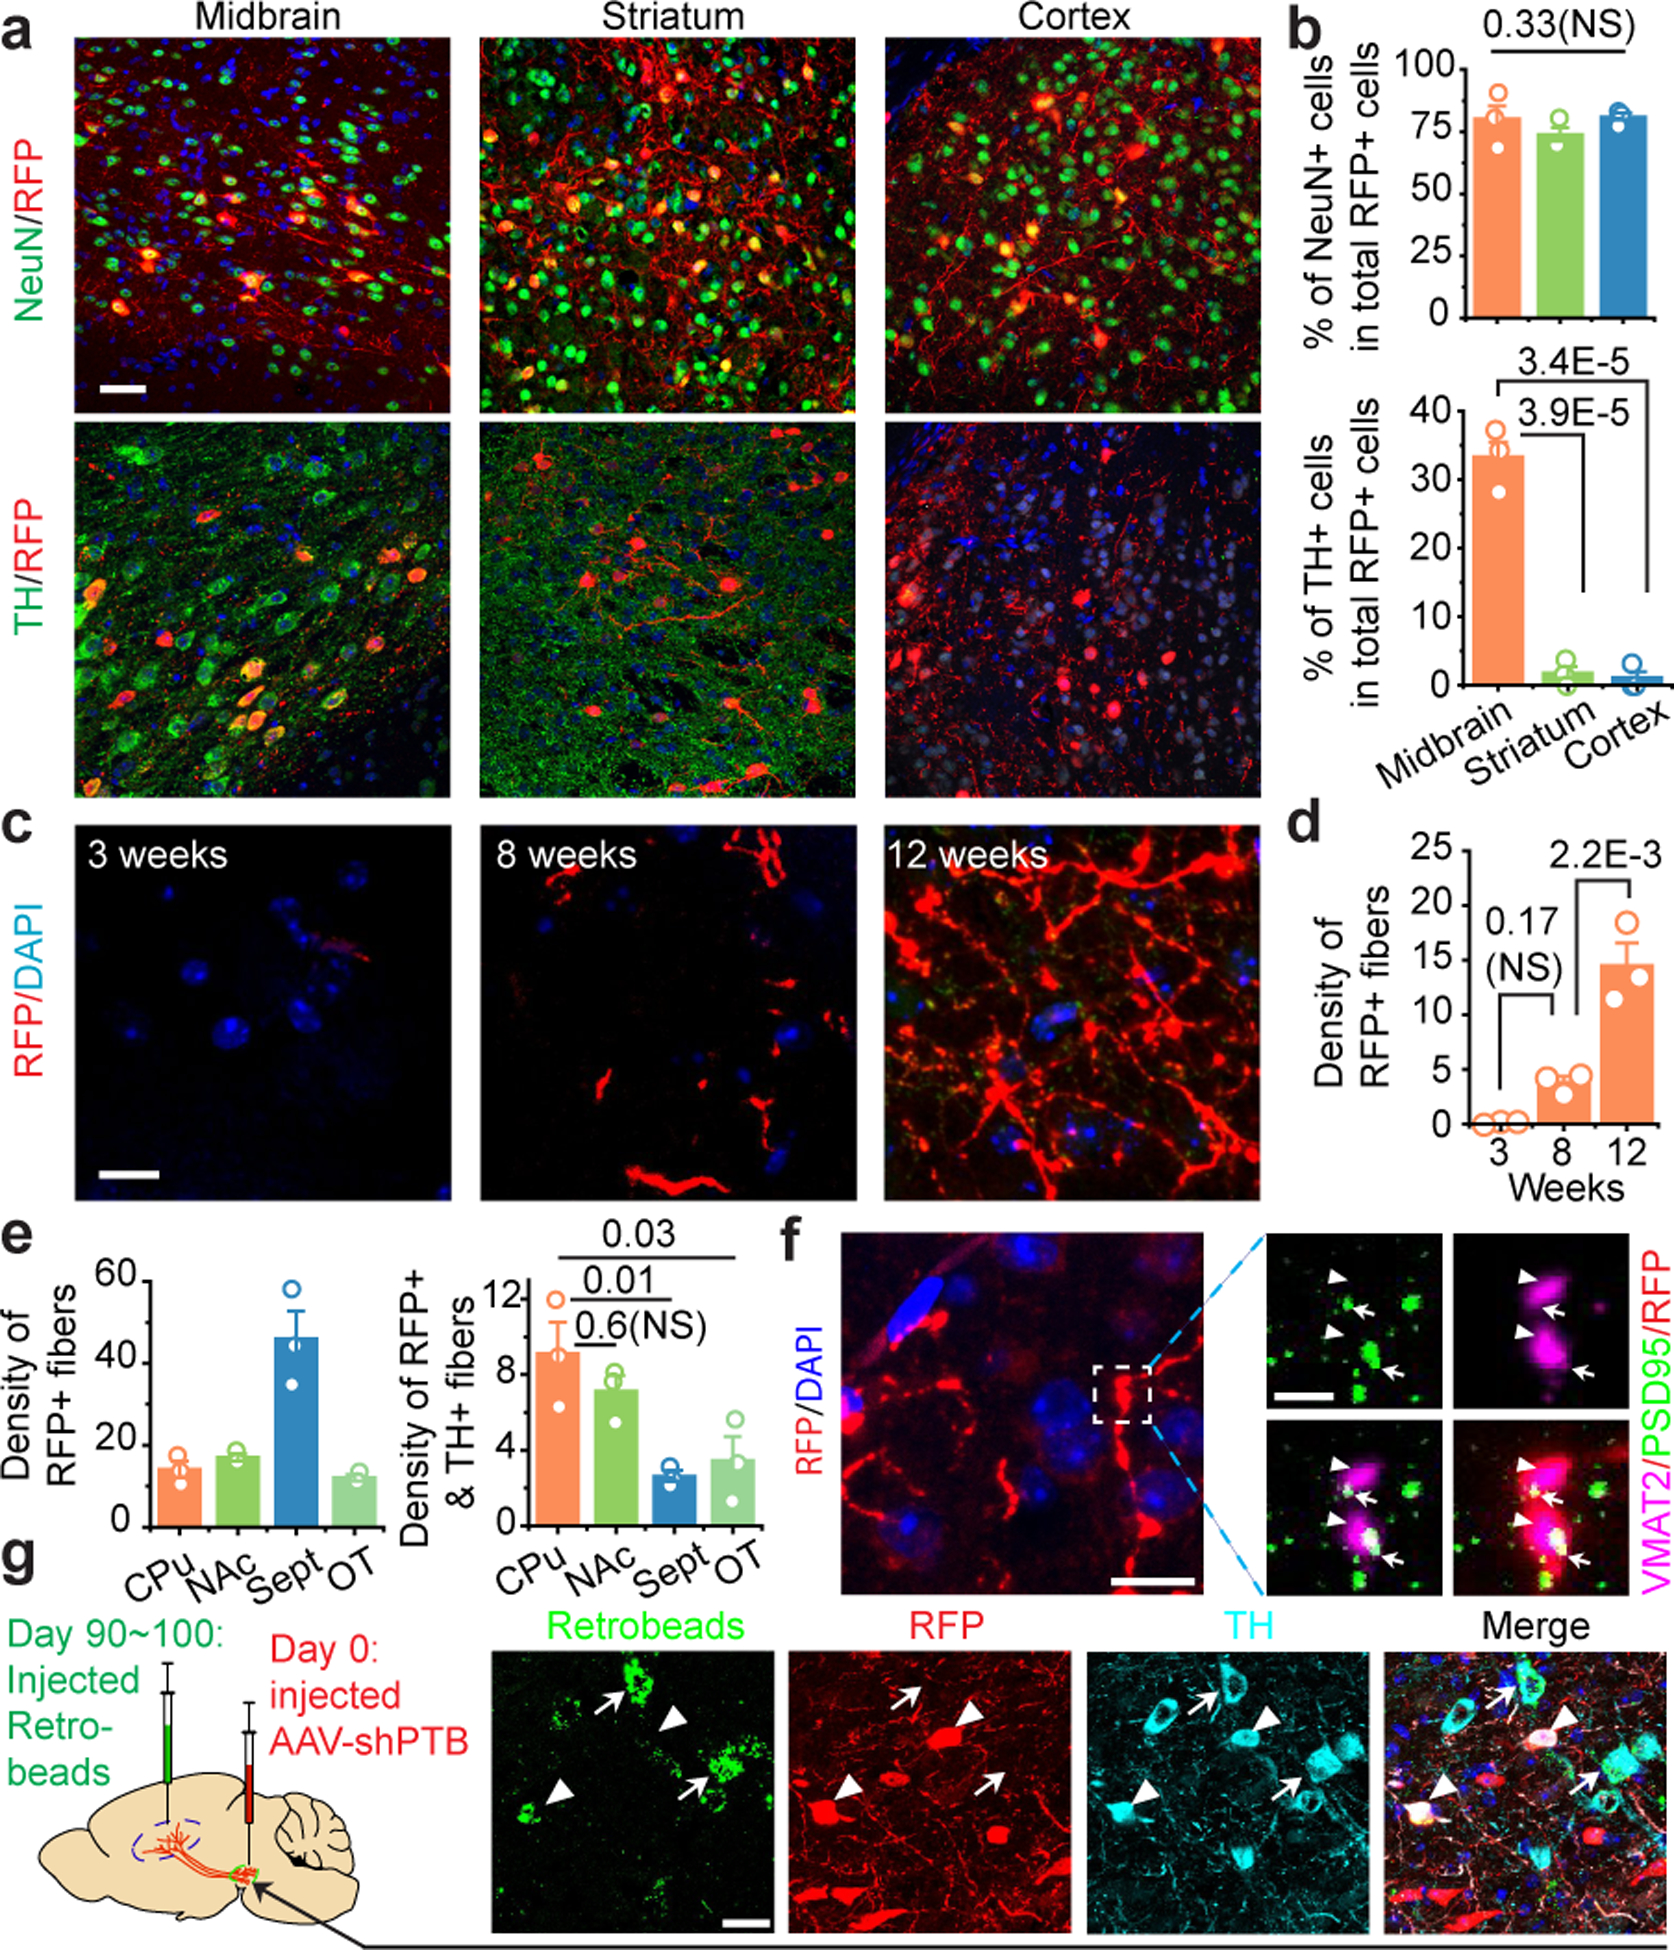
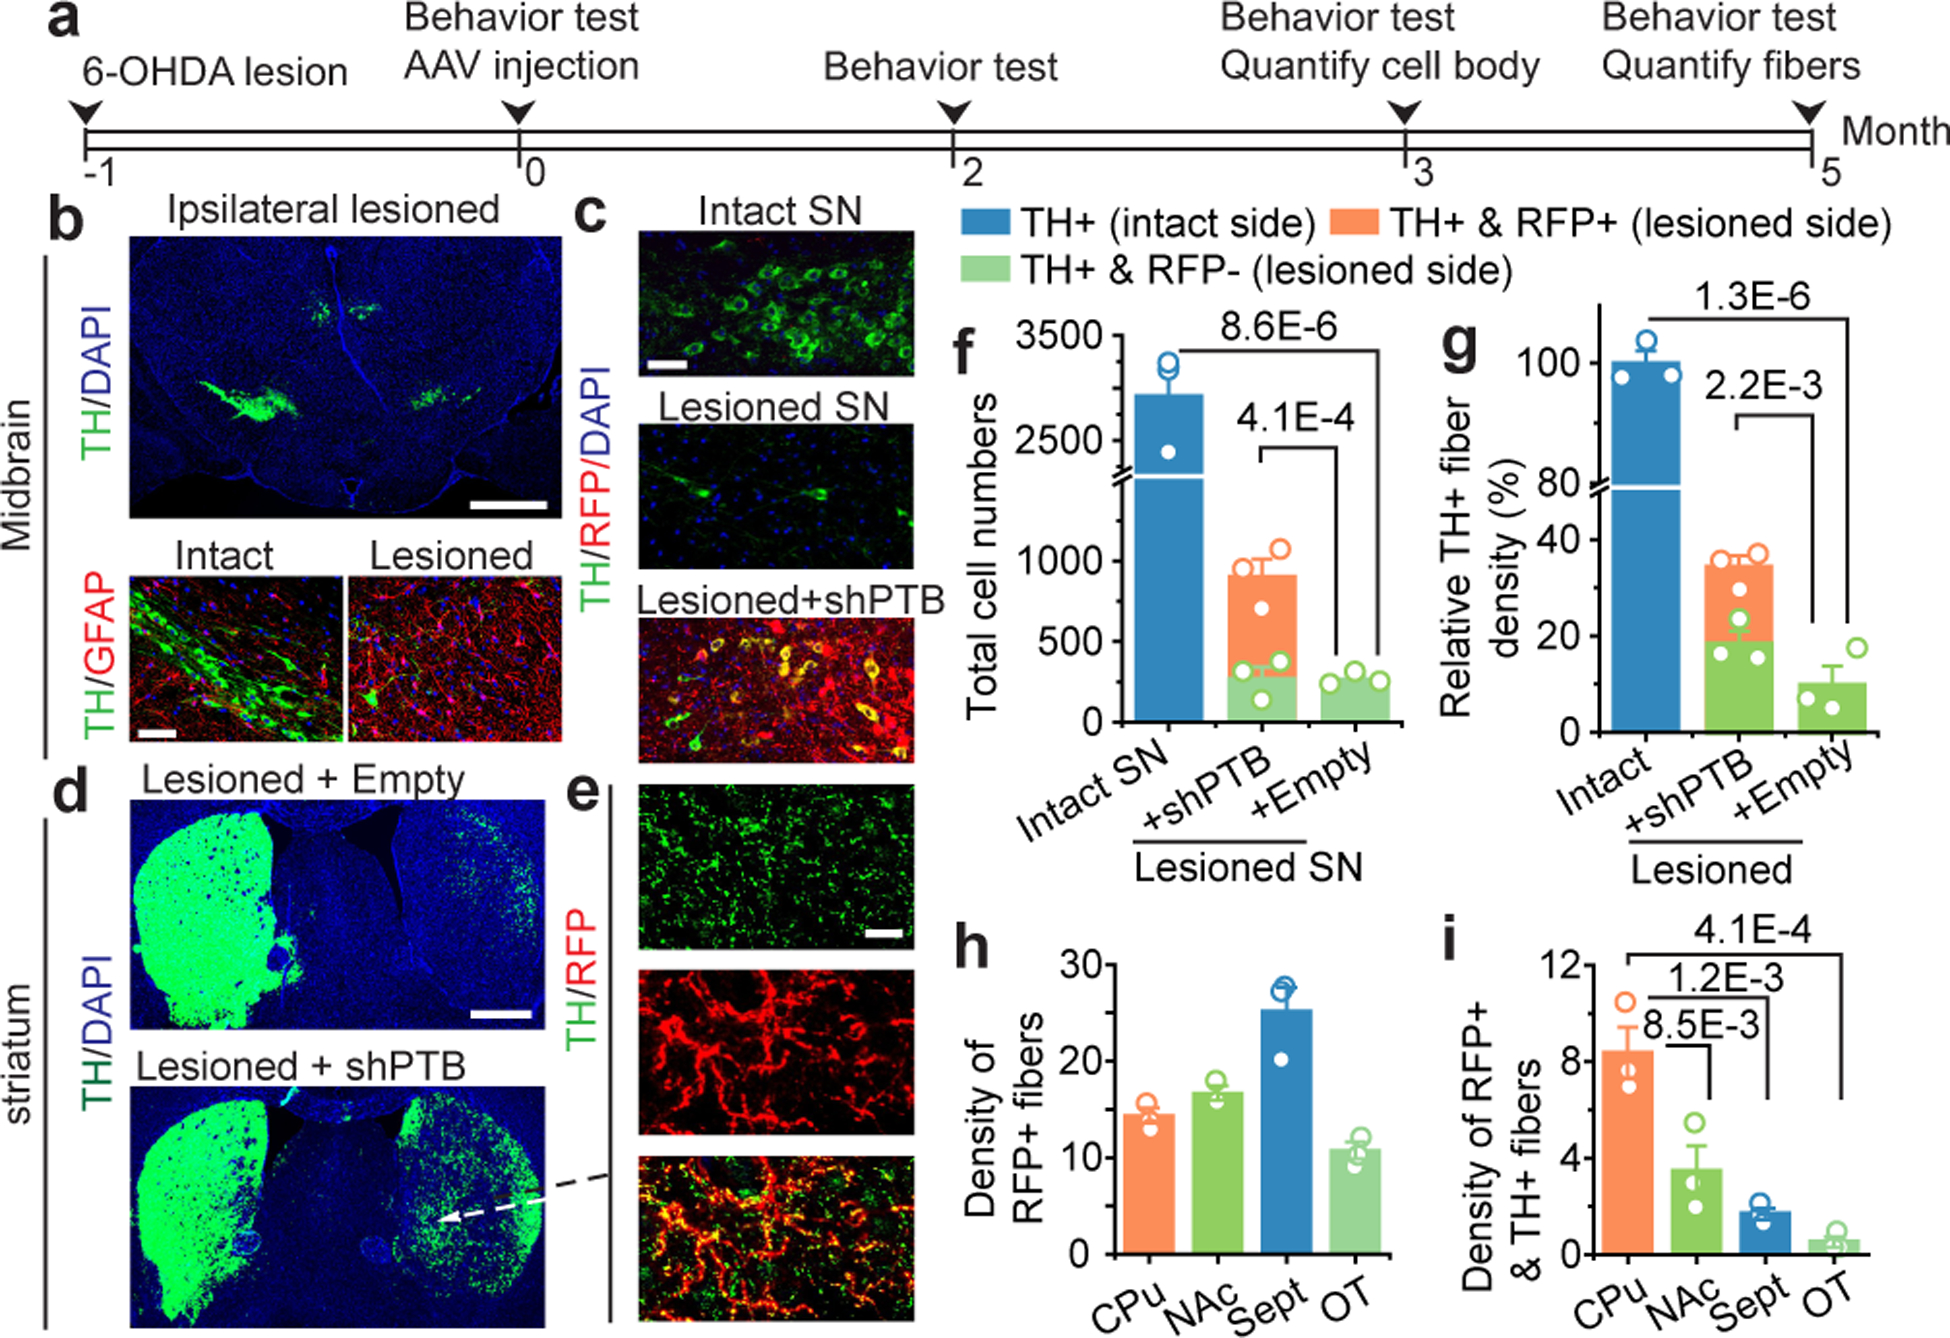
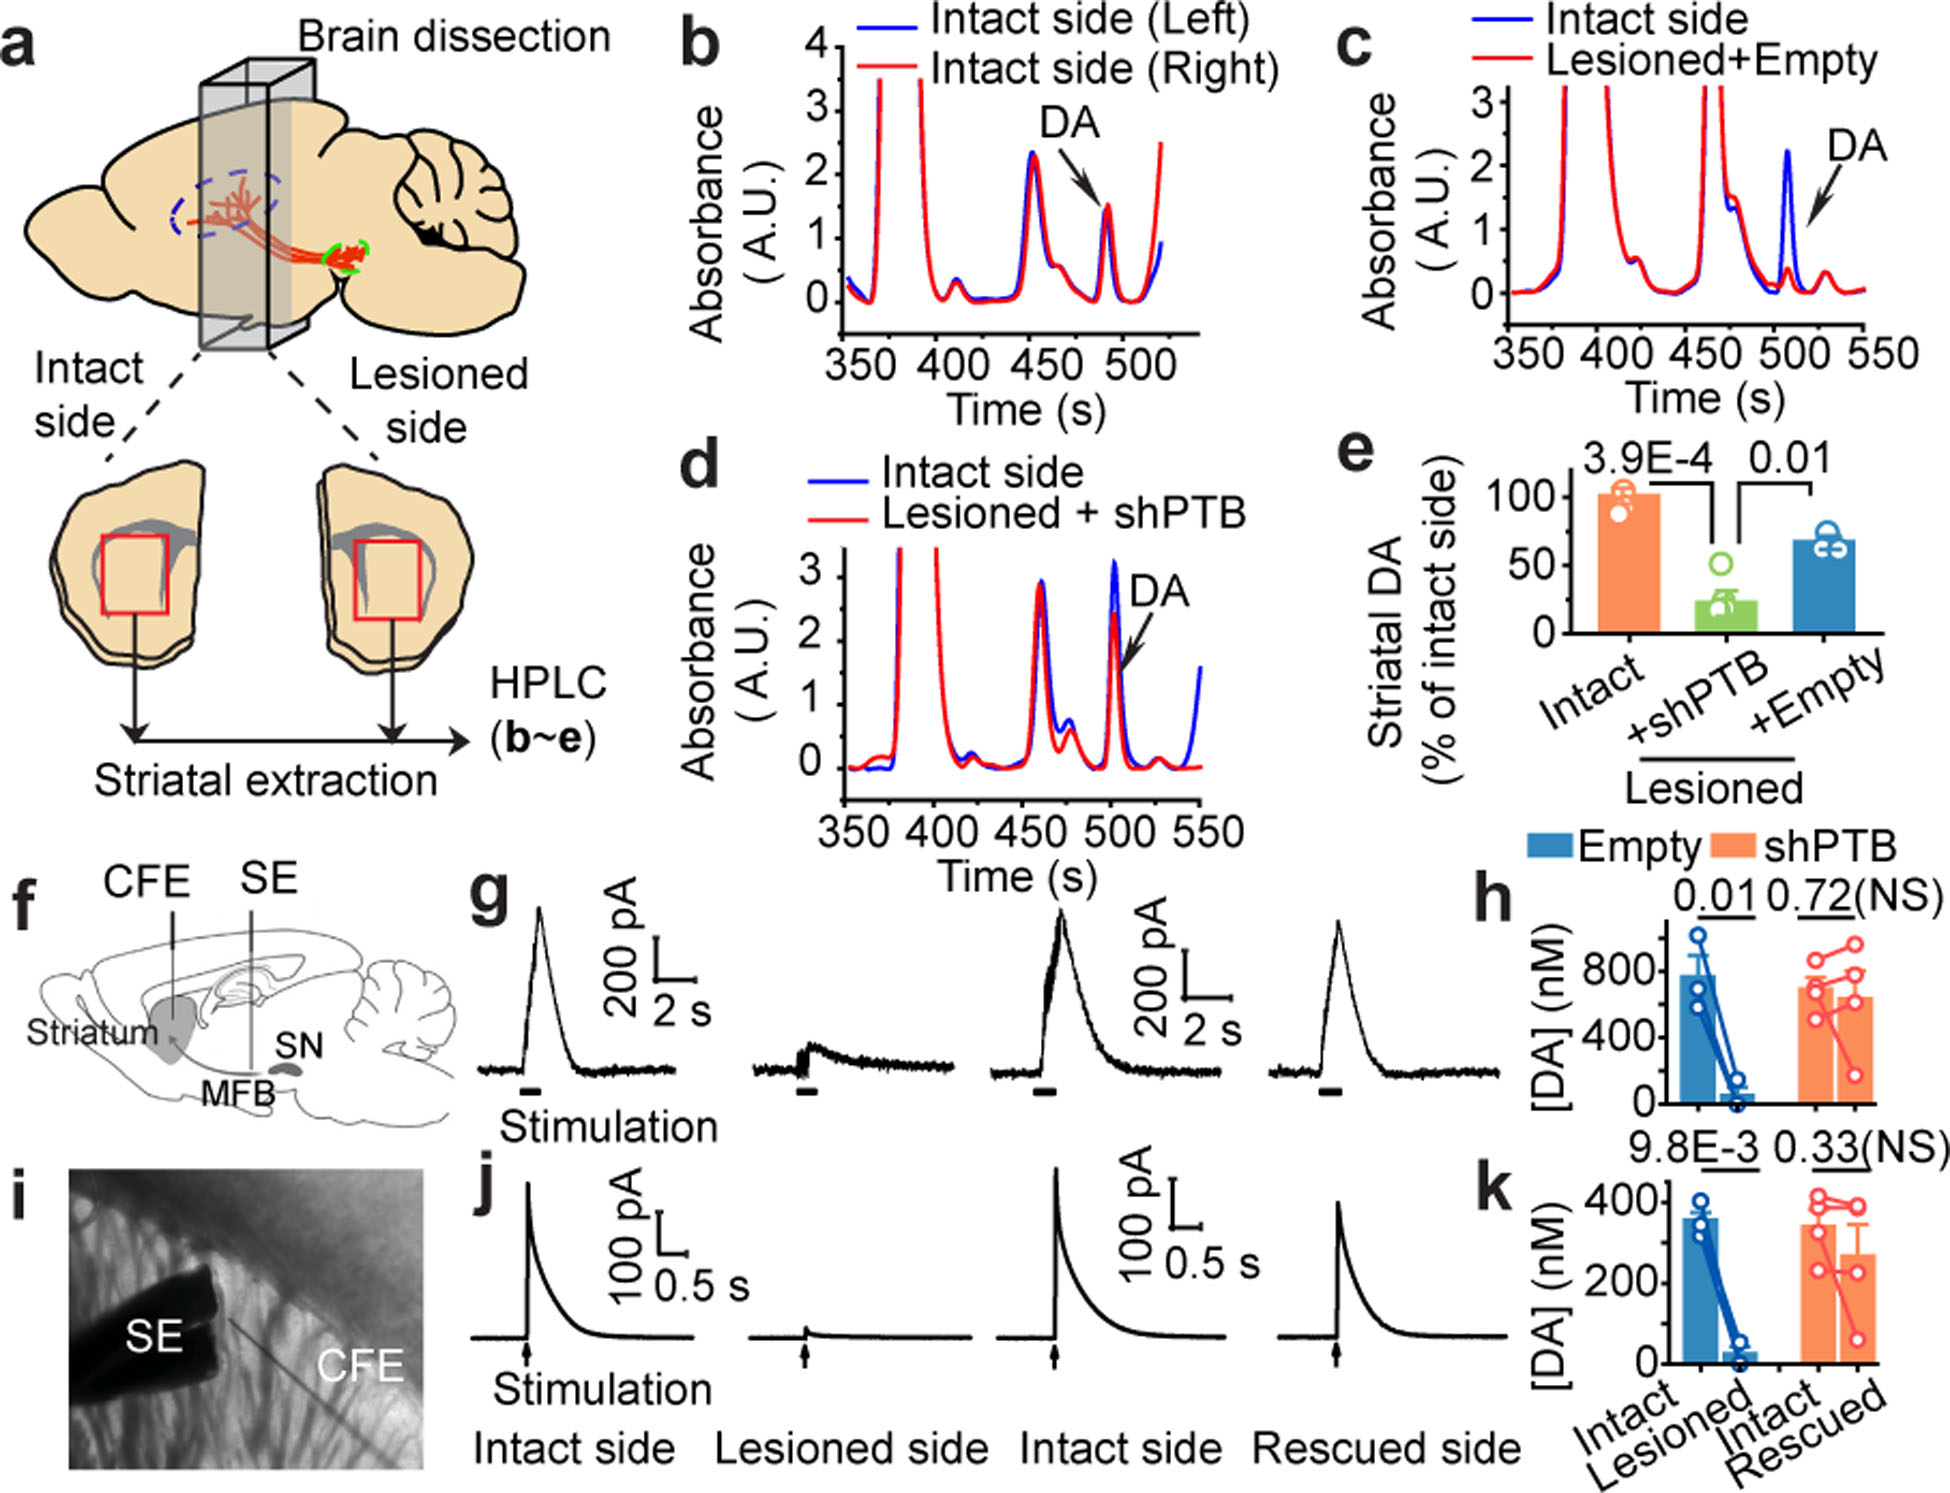
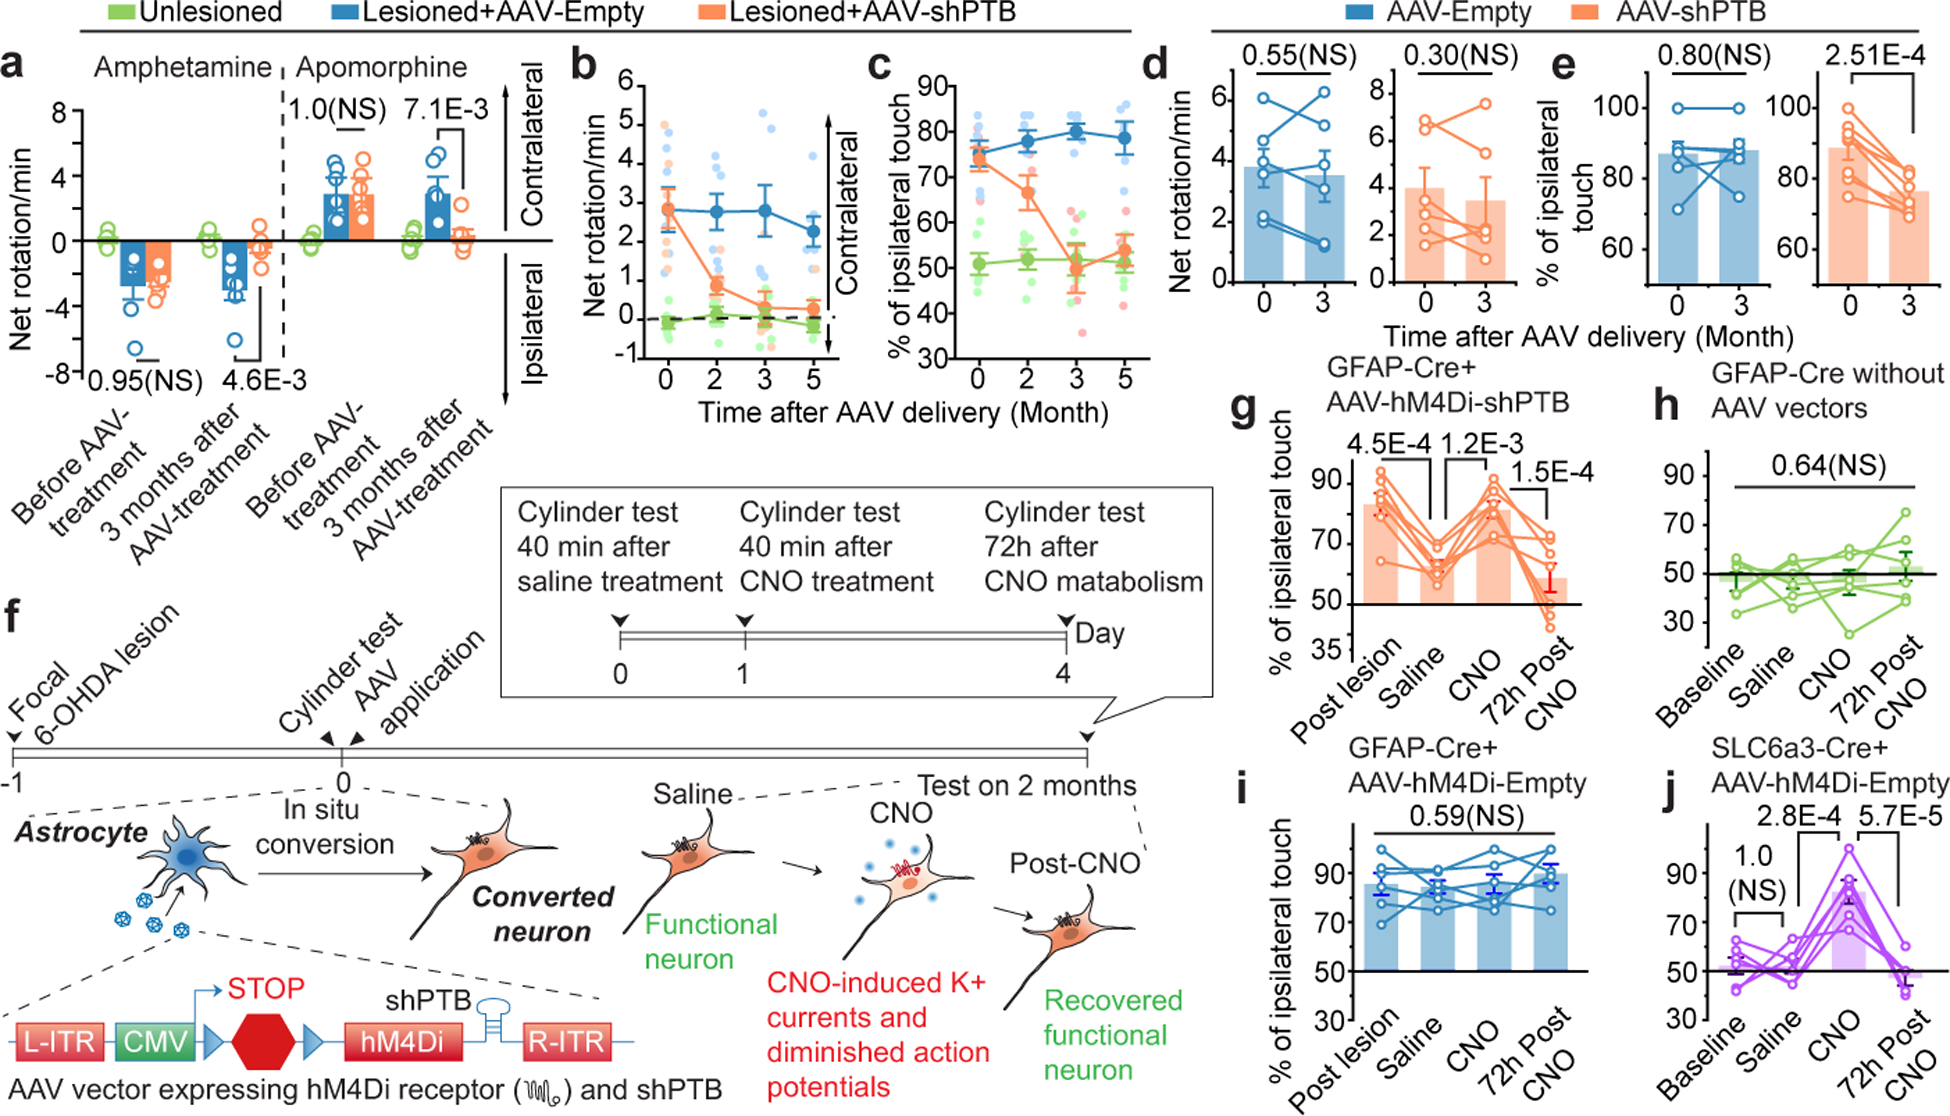
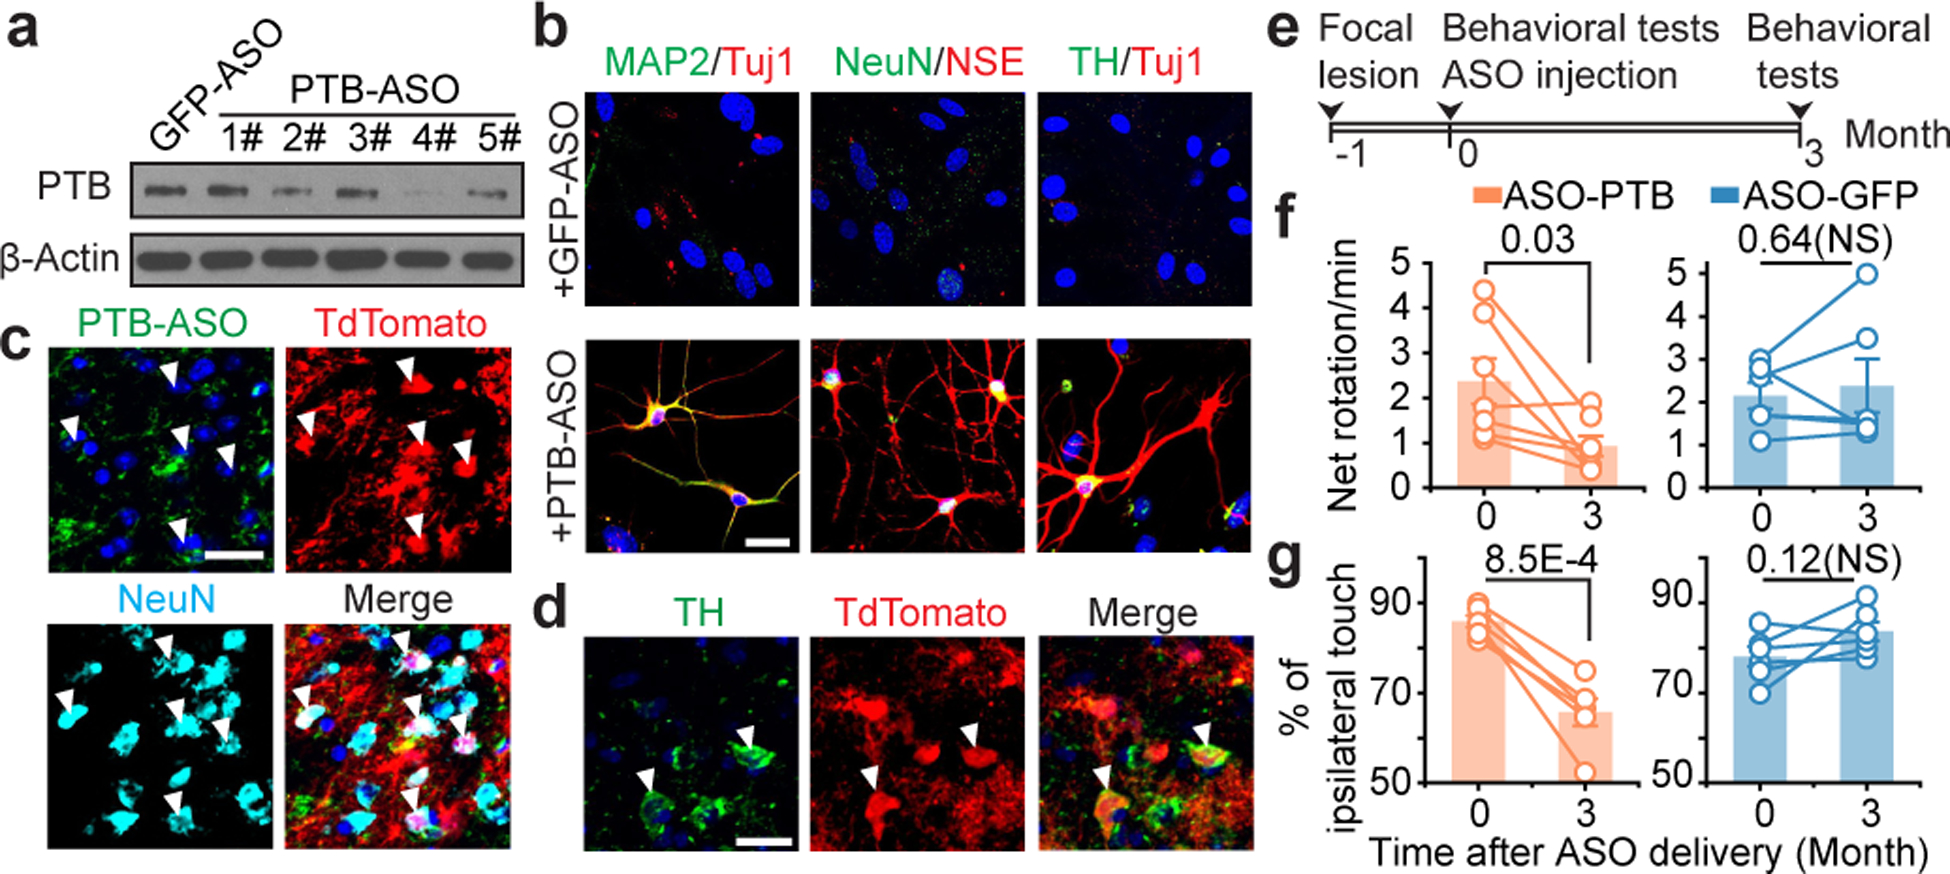
Parkinson's disease is characterized by loss of dopamine neurons in the substantia nigra1. Similar to other major neurodegenerative disorders, there are no disease-modifying treatments for Parkinson's disease. While most treatment strategies aim to prevent neuronal loss or protect vulnerable neuronal circuits, a potential alternative is to replace lost neurons to reconstruct disrupted circuits2. Here we report an efficient one-step conversion of isolated mouse and human astrocytes to functional neurons by depleting the RNA-binding protein PTB (also known as PTBP1). Applying this approach to the mouse brain, we demonstrate progressive conversion of astrocytes to new neurons that innervate into and repopulate endogenous neural circuits. Astrocytes from different brain regions are converted to different neuronal subtypes. Using a chemically induced model of Parkinson's disease in mouse, we show conversion of midbrain astrocytes to dopaminergic neurons, which provide axons to reconstruct the nigrostriatal circuit. Notably, re-innervation of striatum is accompanied by restoration of dopamine levels and rescue of motor deficits. A similar reversal of disease phenotype is also accomplished by converting astrocytes to neurons using antisense oligonucleotides to transiently suppress PTB. These findings identify a potentially powerful and clinically feasible approach to treating neurodegeneration by replacing lost neurons.


Conflict of interest statement

COMPETING INTERESTS

X-D. Fu is a founder of CurePharmacutics Inc.

Figures

Extended Data Fig. 1 |
Extended Data Fig. 1 |. Characterization and functional analysis of astrocytes from mice and humans.
a, Relative purity of mouse and human astrocytes. Astrocytes isolated from mouse cortex and midbrain or obtained from human embryonic brain (Cell Applications) were probed with a panel of markers for neurons and common non-neuronal cell types in the central nervous system, including those for astrocytes: GFAP (green) and ALDH1L1 (red); for neurons: Tuj1, NSE, NeuN, GAD67, VGluT1, TH; for oligodendrocyte: OLIG2; for microglia marker: CD11b; for NG2 cells: NG2; for neural progenitors: Nestin; for pluripotenct stem cells: NANOG; and for fibroblasts: Fibronectin). Scale bar: 30 μm. These data demonstrated that isolated astrocytes are largely free of neurons and common non-neuronal cells. The experiment was independently repeated twice with similar results. b,c, Levels of key components in the regulatory loops controlled by PTB and nPTB in mouse midbrain. Levels of miR-124 (b, upper) and miR-9 (b, bottom) were quantified by RT-qPCR in human astrocytes, human dermal fibroblasts (HDF), and human neurons differentiated from human neuronal progenitor cells. Data were normalized against U6 snRNA and the levels in HDF were set to 1 for comparative analysis. Levels of Brn2 were determined by Western blotting, normalized against β-actin (c). Results show that low miR-124, but high miR-9 and Brn2 in human astrocytes, suggesting inactive PTB-regulated loop and active components of the nPTB-regulated loop in human astrocytes. NS: not significant. d, Levels of PTB, nPTB, and Brn2 in mouse midbrain. Cell types in mouse midbrain were marked by GFAP for astrocytes, TH for DA neurons, and Fibronectin for adjacent meningeal fibroblasts and double-stained for Brn2, PTB, nPTB, and REST. Scale bar: 20 μm. Relative immunofluorescence intensities in different cell types were quantified (right in each panel). n=3 mice with a total of 54 cells counted in each. Note that REST is reduced, but not eliminated, in endogenous DA neurons, which is in agreement with the documented requirement of REST for viability of mature neurons. e,f, Dynamic nPTB expression in response to PTB knockdown. nPTB expression was monitored by Western blotting after PTB knockdown for different days in human dermal fibroblasts (HDF, e, left), mouse cortical astrocytes (mAstrocyte, e, middle) and human astrocytes (hAstrocytes, e, right). The data from 3 biological repeats were quantified (f). Results show that nPTB remains stably expressed in human dermal fibroblasts, but undergoes transient expression in astrocytes from both mice and humans. Statistical results in (b), (c), (d), (f) are based on ANOVA with post-hoc Tukey test and represented as mean+/−SEM (n=3 biological repeats). Specific P-values are indicated. All except one pairwise comparison in panel b are considered statistically significant.
Extended Data Fig. 2 |
Extended Data Fig. 2 |. Global evidence for programmed switch of gene expression from astrocytes to neurons in response to PTB depletion.
a, Clustering analysis. RNA-seq data (available under GSE142250) were generated on independent isolates of astrocytes from mouse cortex or midbrain before and after conversion to neurons by depleting PTB for 2 or 4 weeks. By clustering analysis, the global gene expression profiles were compared with the public datasets for astrocytes or neurons as indicated by the color key and the data sources on the right. The selection of these public data for comparison was based on astrocytes without further culture and on neurons directly isolated from mouse brain or differentiated from embryonic stem cells (ESCs). b,c, Comparison of gene expression profiles between independent libraries prepared from mouse cortical (b) or midbrain (c) astrocytes before and after PTB depletion for 2 or 4 weeks. Selective astrocyte-specific (green) and neuron-specific (red) genes are highlighted. Results show a degree of heterogeneity between independent isolates of astrocytes, but interestingly, their converted neurons became more homogeneous. d, Comparison between induced gene expression upon PTB depletion in cortical versus midbrain astrocytes. Several commonly induced DA neuron-specific genes (i.e. Otx2, En1, Aldh1a1) are highlighted when comparing between neurons derived from cortical versus midbrain astrocytes (right panel). Significantly induced DA neuron-associated genes are listed in Supplementary Table 1. Note that most genes are enriched, but not “uniquely expressed”, in DA neurons (thus, not specific markers for DA neurons), as evidenced from their induction to different degrees in shPTB-treated cortical astrocytes.
Extended Data Fig. 3 |
Extended Data Fig. 3 |. Characterization of converted neurons from mouse and human astrocytes.
a,b, Conversion of mouse and human astrocytes to neurons. Cells were immunostained with the indicated markers after conversion from mouse cortical astrocytes (a) or human astrocytes (b). Converted glutamatergic (marked by VGlut1) and GABAergic (marked by GAD67) neurons constituted ~90% and ~80% of total Tuj1-marked neurons from mouse and human astrocytes, respectively. Data were based on 4 (a) or 5 (b) biological repeats and represented as mean+/−SEM. Scale bar: 30 μm (a) and 40 μm (b). c,d, Efficient conversion from human astrocytes to neurons. Converted neurons were characterized by immunostaining with Tuj1 and MAP2 (c). Scale bar: 80 μm. n=4 biological repeats. These neurons are functional as indicated by repetitive action potentials (top left), large currents of voltage-dependent sodium and potassium channels (top right), and spontaneous post-synaptic currents after co-culture with rat astrocytes (bottom) (d). Indicated in each panel is the number of cells that showed the recorded activity versus the number of cells examined. e,f,g,h, Electrophysiological characterization of neurons converted from mouse (e) and human (f) astrocytes, showing spontaneous excitatory and inhibitory postsynaptic currents that could be sequentially blocked with the inhibitors against the excitatory {2,3-dihydroxy-6-nitro-7-sulfamoyl benzo[f]quinoxaline-2,3-dione (NBQX) plus D(−)-2-amino-5-phosphonovaleric acid or APV} and inhibitory {Picrotoxin (PiTX)} receptors (e.f), indicative of their secretion of glutamine and GABA neurotransmitters. Control shRNA (shCtrl)-treated mouse (g) and human astrocytes (h) failed to show action potentials (top), currents of voltage-dependent channels (middle) or postsynaptic events (bottom). The number of cells that showed the recorded activity versus the total number of cells examined is indicated on top right of each panel.
Extended Data Fig. 4 |
Extended Data Fig. 4 |. Cre-dependent expression of RFP in injected mouse midbrain.
a, Schematic of the substantial nigral region (while box) for AAV injection and immunochemical analysis. b, Cre-dependent RFP expression. RFP+ cells were not detected in midbrain of wild-type mouse injected with either AAV-Empty or AAV-shPTB (left). In comparison, both viruses generated abundant RFP signals in GFAP-Cre transgenic mice. Scale bar: 150 μm. c,d, Co-staining of RFP+ cells with the astrocyte markers S100b and Aldh1L1 10 weeks after injecting AAV-Empty (c), indicating that most RFP+ cells in AAV-Empty-transduced midbrain were astrocytes. Scale bar: 25 μm. No RFP expression was detectable in NG2-labled cells (d). Scale bar: 15 μm. Experiments in (b) to (d) were independently repeated 3 times with similar results. e, Reprogramming-dependent conversion from astrocytes to neurons. Immunostaining with the astrocyte marker GFAP and the pan-neuronal marker NeuN was performed 10 weeks after injection of AAV-Empty or AAV-shPTB in midbrain. Scale bar: 30 μm. Quantified results show that AAV-Empty transduced cells were all GFAP+ astrocytes whereas AAV-shPTB transduced cells were mostly NeuN+ neurons. Quantified data were based on 3 mice as shown on the right. P-values as indicated are based on two-sided Student t-test. Error bar: SEM. f,g, Further characterization of AAV-shPTB induced neurons in midbrain with additional neuronal markers, including pan-neuronal specific markers Tuj1, MAP2, NSE, and PSD-95 (f, Scale bar: 10 μm) and specific markers for glutamatergic (VGlut2) and GABAergic (GAD65) neurons (g, Scale bar: 20 μm).
Extended Data Fig. 5 |
Extended Data Fig. 5 |. Progressive conversion of AAV-shPTB treated astrocytes to DA neurons within the dopamine domain.
a,b, Time-dependent appearance of RFP+DDC+ DA neurons. AAV-shPTB transduced midbrain was characterized for time-dependent appearance of DA neurons with another dopaminergic neuron marker DDC (a, Scale bar: 50 μm). Little initial RFP+ cells were co-stained DDC 3 weeks after AAV-shPTB transduction, and the fraction of RFP+DDC+ cells progressively increased 8 and 12 weeks post AAV-shPTB injection. Images from substantia nigra 12 weeks post AAV-shPTB transduction were enlarged to highlight RFP+DDC+ neurons (b, Scale bar: 25 μm). c,d,e, Conversion of midbrain astroyctes to DA neurons within the dopamine domain. AAV-shPTB induced neuronal reprogramming was determined relative to the site of injection. Shown is a low magnification view of substantial nigra (SN) dorsal to the globus pallidus and posterior to the dorsal striatum (c). Circles mark brain areas with progressive increased diameters from the center of the injection site. Scale bar: 100 μm. Enlarged views show the representative proximal and distal sites from the injection site 12 weeks after AAV-shPTB transduction, positively stained for TH (green) over RFP-labeled cells, (d). Scale bar: 10 μm. Note RFP+TH+ cells in proximal site, but only and RFP+TH- cells in distal site. The percentages of TH+ cells among total RFP+ cells in three different areas defined in (c) were quantified based on 3 mice with at least 100 cells counted in each (e). Error bar: SEM. These data show the generation of TH+ neurons within the dopamine domain of midbrain. f,g, Further characterization of converted DA neurons with additional DA neuron-specific markers DAT, VMAT2, En1, Lmx1a, Pitx3 and DDC, all showing positive signals (f). RFP+TH+ cell bodies are highlighted by orthogonal views of z-stack images, attached on right and bottom of the main image (Scale bar: 10 μm). Cell body diameters were compared between newly converted RFP+TH+ neurons and endogenous RFP-TH+ DA neurons (g, left, Scale bar: 5 μm). The size distribution of both populations of neurons shown on the right suggests that converted TH+ cells have similar cell size to endogenous TH+RFP– DA neurons (g, right). Quantified data were based on 62 RFP+ cells and 64 RFP-TH+ cells from 3 mice. The indicated P-value is based on two-sided Student t-test. NS: not significant. h, Schematic depiction for further analysis of converted neurons in substantial nigra (SN) and ventral tegmental area (VTA). i,j, Representative immunostaining for Sox6, Otx2, and Aldh1a1, showing that Sox6-marked RFP+ cells were confined in SN whereas Otx2-marked RFP+ cells in VTA; the DA neuron marker Aldh1a1 was detected in both SN and VTA (i, Scale bar: 25 μm). Quantified data were based on 3 mice with at least 100 cells counted (j). Error bar: SEM. Results further support the generation of different subtypes of DA neurons. k, Minimal leaked Cre expression in endogenous DA neurons in midbrain. As GFAP-Cre is known to have a degree of leaked expression in neurons, raising a concern that AAV-shPTB might infect some endogenous DA neurons, mice treated with AAV-Empty (which expresses RFP, but not shPTB) were carefully examined. Scale bar: 30 μm. In comparison with AAV-shPTB treated mice, no RFP+ cells stained positively for either NeuN or TH in midbrain of mice transduced with AAV-Empty, as quantified on the right based on 3 mice with at least 100 cells counted in each. Error bar: SEM. Results show little, if any, leaked Cre expression in endogenous DA neurons at least in our hands and on midbrain regions of mice at the age (2 months) used in our studies.
Extended Data Fig. 6 |
Extended Data Fig. 6 |. Electrophysiological properties of gradually matured DA neurons.
a,b, Schematic depiction of patch recording of converted neurons in midbrain (a). According to this scheme, the fluorescent dye Neurobiotin 488 (green) was first injected in substantia nigra to mark cell bodies for patch clamp recording on brain slices. After recording, the patched cells were confirmed to be RFP+TH+ to demonstrate the recording being performed on newly converted neurons (b, Scale bar: 20 μm). Experiments were independently repeated 4 times with similar results. c,d,e, Detection of spontaneous action potential (c) and relatively wider action potential generated by newly converted neurons in comparison with endogenous GABAergic neurons (d). Importantly, hyperpolarization-activated currents of HCN channels (Ih currents) were recorded 12 weeks, but not 6 weeks, after AAV-shPTB induced neuronal conversion, which could be specifically blocked with CsCl (e). The numbers of cells that showed the recorded activity versus the total number of cells examined are indicated. Note that the trace in bottom is also shown in main Fig. 2h. f,g, Extracellular recording, showing more converted neurons firing spontaneous action potentials 12 weeks than 6 weeks after AAV-shPTB transduction. The numbers of cells that showed the recorded activity versus the total number of cells examined are indicated. The frequency of spontaneous spikes that increased upon further maturation was further quantified (g). Data were based on a total of 31 cells from 4 mice. Results show progressive maturation of newly converted DA neurons in the brain. h, Cortical neurons generated in AAV-shPTB transduced cortex in contrast to a large population of RFP+TH+ cells in midbrain. As a control, AAV-shPTB was injected in cortex and by 12 weeks, RFP+ cells were co-stained with the cortical neuron marker Ctip2 (top) and Cux1 (bottom). Scale bar: 40 μm; enlarged window: 15 μm. Note that RFP+Cux1+ cells are quite rare compared to RFP+Ctip2+ cells, indicative of different conversion efficiency in different layers of cortex. Experiments were independently repeated twice with similar results.
Extended Data Fig. 7 |
Extended Data Fig. 7 |. Characterization of cortical astrocyte-derived neurons in comparison with midbrain astrocyte-derived neurons.
a,b,c, A small fraction of cortical astrocyte-derived neurons express DA neuron markers. RT-qPCR showed the induction of DA neuron-specific genes SLC6A3 and FoxA2 in isolated cortical astrocytes treated lentiviral shPTB. These DA-like neurons were further characterized by immunostaining for additional DA neuron markers DAT and VMAT2 (b, Scale bar: 20 μm) and quantified among Tju1+ cells based on 3 biological repeats with at least 100 cells counted in each (c). Statistical significance was determined by two-sided Student’s t-test and represented as mean+/−SEM. Specific P-values are indicated. Results indicate that despite cortex does not contain DA neurons and RFP+TH+ DA-like neurons were never detected in AAV-shPTB transduced cortex in the brain, isolated cortical astrocytes were able to give rise a fraction of DA-like neurons in vitro. This implies that astrocytes may become more plastic in culture than within specific brain environments. d, Additional immunochemical evidence for the expression of DA neuron-specific markers (Lmx1a, Pitx3, and DDC) in a subpopulation of Tuj1+ cells derived from cortical astrocytes. Scale bar: 20 μm. Experiments were independently repeated 3 times with similar results. e,f,g, TH staining of Tuj1+ neurons from astrocytes derived from midbrain and comparison with cortical astrocyte-derived neurons. Lentiviral shPTB, but not control shRNA, converted midbrain astrocytes into TH+ DA neurons in culture (e). Scale bar: 25 μm. Comparison of the conversion efficiencies with cortical and midbrain astrocytes, showing similar high percentage of Tuj1+ neurons (left), but a significantly higher percentage of DA neurons converted from midbrain astrocytes compared to cortical astrocytes (right) (f). Data are based on 3 biological repeats with at least 200 cells counted in each. Statistical significance was determined by two-sided Student’s t-test and represented as mean+/− SEM. Specific P-values are indicated. NS: not significant. Western blotting analysis of a pan-neuronal marker (Tuj1) and two specific markers for DA neurons (TH and VMAT2) in shPTB reprogrammed astrocytes from cortex and midbrain, showing much higher levels of the DA neuron markers in neurons generated from midbrain astrocytes compared to cortical astrocytes (g). Experiments were independently repeated twice with similar results. Together, these data strongly suggest intrinsic cellular differences that are responsible the generation of different neuron subtypes from astrocytes from different brain regions.
Extended Data Fig. 8 |
Extended Data Fig. 8 |. Cell autonomous mechanisms for the regional specificity in neuronal conversion.
a,b, Comparable levels of TH+ neurons generated from cortical astrocytes with either normal and conditional media from cultured midbrain astrocytes (a). Scale bar: 100 μm. Quantified data were based on 3 biological repeats with at least 100 cells counted in each (b). Statistical significance was determined by ANOVA with post-hoc Tukey test and represented as mean+/− SEM. NS: Not Significant. c,d,e,f, RT-qPCR analysis of DA neuron-specific transcription factors (TFs) in cortical and midbrain astrocytes before and after lentiviral shPTB-induced neuronal conversion. The indicated TFs were quantified by real time PCR and normalized against β-actin mRNA (c). To ensure that the isolated astrocytes were free of contaminated neurons, RT-qPCR was also performed with the 3 indicated DA-neuron markers with isolated neurons as control (d). In response to PTB knockdown, astrocyte-specific genes S100b and GFAP were repressed, while pan-neuronal TFs Myt1L and Ascl1 were activated in astrocytes derived from both cortex and midbrain (e). Dashed lines: levels before shPTB treatment, which was set to 1 for comparison with levels after shPTB treatment. Under the same conditions, the 4 DA-neuron-specific TFs were more robustly induced in response to PTB depletion in midbrain astrocytes compared to cortical astrocytes (f). Statistical significance was determined by ANOVA with post-hoc Tukey test for (d) and two-sided Student’s t-test for (c,e,f), all based on 3 biological repeats, and represented as mean+/− SEM. Specific P-values are indicated. NS: not significant. Results suggest higher basal levels and more robust induction of DA neuron-specific TFs in midbrain astrocytes compared to cortical astrocytes, thus evidencing for the differences in cell intrinsic gene expression programs in giving rise to distinct subtypes of neurons. g,h,i, Schematic of amperometric recording of monoamine release, showing the placement of a carbon fiber electrode on midbrain astrocyte-derived neuron (g). Scale bar: 30 μm. Spike-like events were captured by holding the electrode at +750 mV after K+ (25mM) stimulation (h). A high-resolution of dopamine release events in (h) is shown in (i). Results demonstrate a key functional property of midbrain astrocyte-derived DA neurons. Experiments were independently repeated twice with similar results.
Extended Data Fig. 9 |
Extended Data Fig. 9 |. Time-course analysis of fiber outgrowth from converted neurons.
a, Schematic of coronal sections for analyzing fiber density in the nigrostriatal pathway. b,c,d, Sphere-determined density of RFP+ fibers that were progressively increased along the nigrostriatal bundle (NSB). Shown are low magnification views (b, Scale bar: 150 μm) and enlarged views (c, Scale bar: 35 μm). IC: internal capsule; OT: optical tract. Quantified RFP+ (left) or RFP+TH+ fibers (right) were based on 3 independent biological sections (d). Statistical significance was determined by ANOVA with post-hoc Tukey test and represented as mean+/− SEM. Specific P-values are indicated in each case. Results show time-dependent increase in fiber density, a portion of which also exhibits colocalization of the DA neuron marker TH. e,f, Low magnification view of striatum innervated by RFP+ projections (e). Scale bar: 300 μm. Shown in both sides are amplified views of RFP+ projections in different regions: CPu: Caudate-Putamen; NAc: Nucleus Accumbens; Sept: Septal nuclei; OT: Olfactory Tubercle. Scale bar: 15 μm. Note highly bright RFP signals in Septal nuclei. c, Three selected striatal regions were further amplified to highlight a fraction of RFP+ fibers with (arrowheads) or without (arrows) co-staining with the DA neuron marker TH. Scale bar: 5 μm. Results emphasize that converted DA neurons targeted more broad regions in striatum than endogenous DA neurons, which might cause certain side effect, a potential caveat of neuronal reprogramming to be investigated in future studies. g,h, Retrograde tracing of TH+ neurons from striatum to substantial nigra. Depicted is the AAV-shPTB injection site at Day 0 and the injection site of retrobeads at Day 30 (g). Retrograde tracing was monitored 24 hours post injection of retrobeads. After treatment of AAV-Empty for 10~12 weeks, TH+ cells, but not TH+RFP+ cells in substantial nigra were labeled with retrograde beads (h). Arrowheads: RFP+ cells; arrows: cell bodies of endogenous TH+ DA neurons labeled with retrobeads. Scale bar: 20 μm. These data provide a critical control for AAV-shPTB converted DA neurons that could be traced from striatum to substantia nigra, as described in the main text. All experiments show in this figure were independently repeated 3 times with similar results.
Extended Data Fig. 10 |
Extended Data Fig. 10 |. shPTB-converted neurons replenish lost dopaminergic neurons in substantia nigra.
a, Schematic of the experimental schedule for 6-OHDA-induced lesion followed by reprogramming with AAV-PTB and then TH staining. b,c, Low magnification views of unlesioned substantia nigra stained for TH (b) and nigra lesioned with 6-OHDA and transduced with AAV-shPTB (c). Scale bar: 80 μm. These data were used to provide quantitative information shown in main Fig. 4f,g. d, Enlarged view of RFP+ cells that co-expressed TH in substantia nigra. Two RFP+TH+ cell bodies are highlighted by orthogonal views of z-stack images, attached on right and bottom of the main image in each panel. Scale bar: 10 μm. Results show the generation of TH+ DA neurons in a highly regional specific manner in substantia nigra, as a large population of RFP+ cells not labeled by TH staining in the same image. All experiments show in this figure were independently repeated 3 times with similar results.
Extended Data Fig. 11 |
Extended Data Fig. 11 |. Restoration of TH+ neurons in striatum of 6-OHDA lessioned mice.
a,b, Schematic of the coronal section of striatum and images of striatum of unlessioned control and lessioned on the right side of the brain treated with either AAV-Empty or AAV-shPTB (a). Scale bar: 150 μm. Amplified images showed extensive colocalization of TH with RFP-labeled fibers (b). Scale bar: 10 μm. Results show a significant degree of restoration of TH+ fibers in striatum. Experiments were independently repeated 3 times with similar results. c,d, Quantitative analysis of TH+ fibers in striatum under different treatment conditions. TH staining of striatum under different treatment conditions, as indicated on top of each panel (c). Scale bar: 10 μm. Quantification of total TH+ or TH+RFP– fiber density in striatum under different treatment conditions based on 3 biological repeats (d). Statistical significance was determined by ANOVA with post-hoc Tukey test and represented as mean+/− SEM. Specific P-values are indicated. NS: Not Significant. Results show that most TH+ fibers seem to derive from AAV-shPTB converted dopaminergic neurons; however, the data do not rule out the possibility that the axons of some endogenous neurons also responded to the environment created by newly converted neurons.
Extended Data Fig. 12 |
Extended Data Fig. 12 |. Reconstruction of the nigrostriatal pathway by converted dopaminergic neurons.
a, Schematic of the experimental schedule for 6-OHDA-induced lesion and reconstruction of the nigrostriatal pathway. b to f, Images of RFP+ projections extended from nigra to striatum. The schematic diagram shows the dorso-ventral level of horizontal section. Scale bar: 100 μm. Amplified views show different brain regions (c to f). Scale bar: 25 μm. g, Amplified views of RFP-positive fibers that co-stained with TH in caudate-putamen and globus pallidus. Scale bar: 20 μm. These data were used to provide quantitative information shown in main Fig. 4h,i. All experiments show in this figure were independently repeated twice with similar results.
Extended Data Fig. 13 |
Extended Data Fig. 13 |. Measurement of striatal dopamine by HPLC and controls with AAV-shGFP and AAV-hM4Di.
a,b, Dopamine levels in brain detected by HPLC after two different doses of “spike-in” dopamine” according to the range of dopamine levels in wild-type brain (a). A standard curve generated by “spike-in” dopamine amounts (b). This set of experiments was performed only once. c, Controls for behavioral tests, showing that expressing an anti-GFP control shRNA alone did not rescue chemical-induced behavioral deficits based on apomorphine-induced rotation (left) and cylinder test (right). d, Controls for behavioral tests, showing that the expression of hM4Di in non-reprogrammed astrocytes did not trigger detectable behavior change on unlesioned mice in the presence of CNO. Statistical significance was determined by ANOVA with post-hoc Tukey test for (c,d) and represented as mean+/− SEM. 6 mice were analyzed in each group. Specific P-values are indicated. NS: not significant.
Extended Data Fig. 14 |
Extended Data Fig. 14 |. Electrophysiological analysis of ASO-PTB induced neurons in vitro and in brain.
a,b,c, Converted neurons showed large currents of voltage-dependent sodium and potassium channels (a), repetitive action potentials (b), and spontaneous post-synaptic currents (c). The numbers of cells that showed the recorded activity versus the total number of cells examined are indicated on top in each panel. d, Schematic of transgenic mice used to trace astrocytes in vivo. e, 3 weeks after treatment of tamoxifen, none of TdTomato-labeled cells in midbrain of GFAP-CreER:Rosa-tdTomato mice were stained positive for NeuN (left), and all were GFAP+ (right). Scale bar: 50 μm. f to i, Converted neurons in brain slices showed large currents of voltage-dependent sodium and potassium channels (f), repetitive action potentials (g), spontaneous action potentials (h), and spontaneous post-synaptic currents (i). The numbers of cells that showed the recorded activity versus the total number of cells examined are indicated on top in each panel. Results show functional neurons induced by PTB-ASO both in culture and in mouse brain. All experiments show in this figure were independently repeated twice with similar results.
Fig. 1 |
Fig. 1 |. PTB knockdown induces neurogenesis in mouse and human astrocytes
a, PTB and nPTB-regulated loops critical for neuronal induction and maturation in fibroblasts, astrocytes, and neurons. Bold and regular font sizes indicate high and low expression levels, respectively. Red dashed box: Similarity between fibroblasts and astrocytes in PTB-regulated loop; blue dashed box: Similarity between astrocytes and neurons in nPTB-regulated loop. b,c, Levels of miR-124 and miR-9 determined by RT-qPCR, normalized against U6 snRNA (b) and Brn2 by Western blotting, normalized against β-actin (c) in mouse astrocytes, mouse embryonic fibroblasts (MEF) and mouse neurons. Statistical results are represented as mean+/−SEM (n=3 biological repeats) and indicated P-values are based on ANOVA with post-hoc Tukey test. NS: not significant. d,e, Time-course analysis of nPTB levels upon PTB knockdown (d) in mouse midbrain astrocytes and quantified in (e). 3=biological repeats. Error bars: SEM.
Fig. 2 |
Fig. 2 |. Conversion of astrocytes to functional neurons in vitro and in mouse brain
a.b, Mouse cortical astrocytes (a) treated with shCtrl or shPTB lentivirus, stained for Tuj1 (red) and MAP2 (green). Scale bar: 80 μm. Right: quantified results (n= 5 biological repeats). Error bars: SEM. Electrophysiological recordings (b), showing repetitive action potentials (top left), large currents of voltage-dependent sodium and potassium channels (top right), and spontaneous post-synaptic currents after co-culture with rat astrocytes (bottom). Indicated in each panel is the number of cells that showed the recorded activity versus the number of cells examined. c,d, Design of the AAV-shPTB vector (c). AAV-Empty: same vector without shPTB. Schematic of the midbrain section for immunochemical analysis in the indicated panels (d). e,f, Gradual conversion of midbrain astrocytes to NeuN+ neurons (e). Shown are representative images (Scale bar: 50 μm) at 3 time points and quantified RFP+ cells that showed positive staining for NeuN (left), DDC (middle), and TH (right). n=3 biological repeats (f). Error bars: SEM. g, Converted TH+ DA neurons marked by Girk2 or Calbindin. Scale bar: 20 μm. Bottom right: Quantified results were based on 3 mice. Error bars: SEM. h, Electrophysiological recordings on brain slices showing large currents of voltage-dependent sodium and potassium channels (top, left), spontaneous post-synaptic currents (top, right), repetitive action potentials (bottom, left), and mature DA neuron-associated HCN channel activities, specifically blocked with 2 mM CsCl (bottom, right). Indicated in each panel is the number of cells that showed the recorded activity versus the number of cells examined.
Fig. 3 |
Fig. 3 |. Regional specificity in astrocyte-to-neuron conversion and axonal targeting
a,b, Induced NeuN+ neurons in 3 brain regions examined with TH+ neurons detected only in midbrain (a). Scale bar 30 μm. Quantified results were based on 3 mice (b). c,d, Progressive targeting of RFP+ fibers to striatum over a course of 12 weeks (c). Scale bar: 10 μm. RFP+ fiber density was determined by the sphere method and quantified from images (n=3 biological repeats) at each time point (d). e, Targeting of RFP+ fibers to multiple subregions around striatum, particularly Septal nuclei (left), but RFP+TH+ fibers mainly to caudate-putamen (CPu) and nucleus accumbens (NAc) (right). Quantification was performed on images collected at week 12 (n=3 mice). f, Evidence for synaptic connection in caudate-putamen, as indicated by colocalization in the amplified window between the presynaptic marker VMAT2 (arrowheads) and the postsynaptic marker PSD95 (arrows) on RFP+ fibers. Scale bar: 10 μm; enlarged window: 2 μm. g, Labeling of RFP+TH+ cells in substantia nigra with retrograde beads injected into striatum 90 to 100 days after reprogramming (left). Arrowheads: beads-labeled converted cells; arrows: beads-labeled endogenous (TH+ RFP-) DA neurons. Scale bar: 20 μm. Statistical significance in (b), (d), (e) was determined by ANOVA with post-hoc Tukey test and represented as mean+/−SEM. NS: not significant. Specific P-values are indicated in each panel. (f), (g) was each based on 3 independently repeated experiments with similar results.
Fig. 4 |
Fig. 4 |. Replenishing lost DA neurons to reverse parkinsonian phenotype
a, Schematic of the experimental schedule for 6-OHDA-induced lesion in substantia nigra (SN) followed by AAV-shPTB treatment and behavioral tests. b, 6-OHDA-induced unilateral loss of TH+ cells in midbrain (top, Scale bar: 500 μm), accompanied with increased GFAP+ astrocytes (bottom, Scale bar: 50 μm). c, Comparison between unlesioned (top) and 6-OHDA-lesioned nigra (middle), showing converted DA neurons (yellow) after AAV-shPTB treatment (bottom). Scale bar: 50 μm. d,e, TH+ fibers in striatum treated with AAV-Empty (top) or AAV-shPTB (bottom) (d). Scale bar: 500 μm. Amplified views from (d), showing extensive RFP+TH+ fibers (e). Scale bar: 10 μm. (b) to (e) were each based on 3 independently repeated experiments with similar results. f,g, Quantified DA neuron cell bodies (f) or fibers (g) in the unlesioned side (blue), remaining endogenous RFP–TH+ DA neurons in the lesioned side (green), and converted RFP+TH+ DA neurons in the lesioned side (orange). Data were from two sets of mice (n=3 in each set) transduced with AAV-shPTB or AAV-Empty. h,i, Quantification of RFP+ (h) or RFP+TH+ (i) fiber density in different subbrain regions, as indicated at bottom (n=3 mice in each group). Statistical significance from panel (f) to (i) was determined by ANOVA with post-hoc Tukey test and represented as mean+/− SEM. NS: not significant. Specific P-values are indicated in each panel.
Fig. 5 |
Fig. 5 |. Restoration of dopamine biogenesis and activity-induced dopamine release
a, Schematic depiction of the measurement of striatal dopamine levels by HPLC. b,c,d, Striatal dopamine levels in two sides of unlesioned mouse brain (b), comparison between unlsioned and 6-OHDA lesioned sides (c), and restoration in the lesioned side after reprogramming in ipsilateral nigra (d). Arrow in each panel: the DA position in HPLC. e, Striatal dopamine restoration after reprogramming with AAV-shPTB in ipsilateral nigra (n=3 unlesioned mice or lesioned mice treated with AAV-shPTB; n=4 lesioned treated with AAV-Empty). f,g,h, Activity-induced dopamine release in striatum. Depicted is striatal dopamine recording with insertion of a carbon fiber electrode (CFE) in striatum and stimulation electrode (SE) in medial forebrain bundle (MFB) next to substantia nigra (SN) in live animals (f). Representative traces of activity-induced dopamine release recorded on the unlesioned and 6-OHDA-lesioned striatum before and after neuronal conversion (g). Shown are statistics of the recorded results (n=3 for AAV-Empty treated; n=4 for AAV-shPTB treated mice) (h). Circles: individual mice; lines: same mice before and after reprogramming. i,j,k, Dopamine release recorded on striatal slices from the same set of mice analyzed in (g) as diagrammed in (i). Shown are representative traces (j) and the statistics of the recorded results (k) as in (h). Statistical significance was determined by ANOVA with post-hoc Tukey test in (e) or by Student’s t-test in (h, k), both represented as mean+/− SEM. NS: not significant. Specific P-values are indicated in each panel.
Fig. 6 |
Fig. 6 |. Behavioral benefits and chemical genetic evidence for induced neurons in brain repair
a, Parkinsonian behaviors in mock-treated (green), 6-OHDA-lesioned mice treated with AAV-Empty (blue) or AAV-shPTB (orange). Rotation was induced by amphetamine (left) or apomorphine (right). n=7 mice used for lesioned/treated with AAV-Empty or AAV-shPTB in apomorphine test. n=6 mice used for the rest conditions. b,c, Time-course analysis of behavioral restoration. Rotation induced by apomorphine (b) and cylinder test for ipsilateral touches (c) in unilateral lesioned mice (n=6 or 7 mice analyzed in each group as in (a). Error bar: SEM. d,e, Apomorphine-induced rotation test (d) and cylinder test (e) on 1-year old lesioned mice 3 months after treatment with AAV-Empty or AAV-shPTB (n=8 mice used for lesioned/treated with AAV-shPTB in cylinder test. n=6 mice for the rest conditions). Circles: individual mice; lines: same mice before and after reprogramming. f, Schematic of the chemogenetic strategy to demonstrate converted neurons directly responsible for phenotypic recovery, emphasizing the rapid effect of injected CNO in inhibiting activities of reprogrammed neurons and reappearance of parkinsonian phenotype after CNO metabolism. g,h,i, Results of cylinder test before and after injecting AAV-hM4Di-shPTB, treatment with saline or CNO or 3 days after drug withdrawal (g) in unlesioned mice mock-treated or treated with CNO (h) or lesioned mice treated with AAV-hM4Di-Empty vector (i). n=7 GFAP-Cre mice for (g), 6 for (h) and (i). j. The cylinder test results on unlesioned SLC6a3 transgenic mice (n=6) treated with AAV-hM4Di, which specifically targets endogenous DA neurons due to DA neuron-restricted Cre expression by the SLC6a3 promoter. Statistical significance in (a, b, c, g, h, i, j) was determined by ANOVA with post-hoc Tukey test and represented as mean+/− SEM. NS: not significant. Specific P-values are indicated in each panel.
Fig. 7 |
Fig. 7 |. Proof-of-concept experiments with the ASO-based strategy
a,b, Screening for PTB-ASOs by Western blotting in mouse astrocytes (a). PTB-ASO induced neurons in isolated mouse cortical astrocytes in vitro (b), positively stained for Tuj1 and MAP2 (left), NSE and NeuN (middle), with a small fraction of converted neurons stained positively for TH (right). n=3 biological repeats for both (a) and (b). Scale bar: 20 μm. c,d, A portion of tdTomato-labeled cells became NeuN+ by 8 weeks (c) and TH+ by 12 weeks (d) after PTB-ASO injection into midbrain of GFAP-CreER™/Rosa-tdTomato transgenic mice. n=4 biological repeats for both (c) and (d). Scale bar: 20 μm. e,f,g, Schematic of 6-OHDA induced lesion, ASO treatment, and behavioral tests (e). Results of apomorphine-induced rotation (f) and cylinder test (g). Circles: individual mice; lines: same mice before and after reprogramming (n=7 used for lesioned/treated with PTB-ASO in apomorphine test. n=6 for the rest conditions, both on wild-type C57BL/6 mice). Statistical significance in (f) and (g) was determined by two-sided Students’ t-test. NS: not significant. Specific P-values are indicated in each panel.

Comment in

References

    1. Poewe W et al. Parkinson disease. Nat Rev Dis Primers 3, 17013, doi: 10.1038/nrdp.2017.13 (2017). - DOI - PubMed
    1. Barker RA, Gotz M & Parmar M New approaches for brain repair-from rescue to reprogramming. Nature 557, 329–334, doi: 10.1038/s41586-018-0087-1 (2018). - DOI - PubMed
    1. Sonntag KC et al. Pluripotent stem cell-based therapy for Parkinson’s disease: Current status and future prospects. Prog Neurobiol 168, 1–20, doi: 10.1016/j.pneurobio.2018.04.005 (2018). - DOI - PMC - PubMed
    1. Cohen DE & Melton D Turning straw into gold: directing cell fate for regenerative medicine. Nature Reviews Genetics 12, 243–252 (2011). - PubMed
    1. Yu X, Nagai J & Khakh BS Improved tools to study astrocytes. Nat Rev Neurosci 21, 121–138, doi: 10.1038/s41583-020-0264-8 (2020). - DOI - PubMed

Publication types

MeSH terms

Substances