Spatial Analysis of Global Variability in Covid-19 Burden
- PMID: 32581614
- PMCID: PMC7280244
- DOI: 10.2147/RMHP.S255793
Spatial Analysis of Global Variability in Covid-19 Burden
Abstract
Background: Since the first occurrence of coronavirus disease 2019 (Covid-19), a number of online tools have become available to assist with tracking Covid-19 prevalence. Yet we are unaware of resources that provide country-specific Covid-19 incidence data.
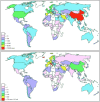
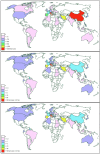
Methods: We undertook a descriptive analysis of the global impact of Covid-19 using data reported on March 17, 2020. The prevalence of Covid-19 cases, fatalities attributed to Covid-19, and the case fatality rate for each of the 238 countries were accessed from the World Health Organization global Covid-19 tracking site, and we additionally calculated Covid-19 incidence based on country-specific population data. We determined the country-specific point prevalence and incidence of Covid-19 and associated deaths while using geocoded data to display their spatial distribution with geographic heat maps.
Results: The analysis included 193,197 Covid-19 cases and 7859 associated deaths. The point prevalence was highest in China (80,881), Italy (31,506), Iran (16,169), and Spain (11,312); no other country reported more than 10,000 cases. The incidence (per million population) was highest in San Marino (3389) followed by Iceland (645) and Italy (521); no other country had an incidence above 400 per million population.
Conclusion: Countries with a high Covid-19 prevalence may not have a high incidence, and vice versa. Public health agencies that provide real-time infection tracking tools should report country-specific Covid-19 incidence metrics, in addition to prevalence data.
Keywords: Covid-19; coronavirus; incidence; prevalence.
© 2020 Miller et al.
Conflict of interest statement
The authors report no conflicts of interest.
Figures


References
-
- South China Morning Post. Coronavirus: china’s first confirmed Covid-19 case traced back to November 17; 2020. Available from: https://www.scmp.com/news/china/society/article/3074991/coronavirus-chin.... Accessed March19, 2020.
-
- World Health Organization. WHO Director-General’s opening remarks at the media briefing on COVID-19-11 March 2020; 2020. Available from: https://www.who.int/dg/speeches/detail/who-director-general-s-opening-re.... Accessed March19, 2020.
-
- Center for Infectious Disease Research and Policy. COVID-19 maps & visuals; 2020. Available from: http://www.cidrap.umn.edu/covid-19/maps-visuals. Accessed March19, 2020.
-
- Centers for Disease Control and Prevention. Coronavirus Disease 2019 (COVID-19): global map; 2020. Available from: https://www.cdc.gov/coronavirus/2019-ncov/cases-updates/world-map.html. Accessed March17, 2020.
-
- United Nations Department of Economic and Social Affairs. World population prospects: the 2019 revision; 2020. Available from: https://www.worldometers.info/world-population/population-by-country/. Accessed March17, 2020.
LinkOut - more resources
Full Text Sources

