. 2018 Dec;29(8):e2525.
doi: 10.1002/env.2525. Epub 2018 Sep 25.

Adaptive predictive principal components for modeling multivariate air pollution

Affiliations

Adaptive predictive principal components for modeling multivariate air pollution

Maitreyee Bose et al. Environmetrics. 2018 Dec.

Abstract

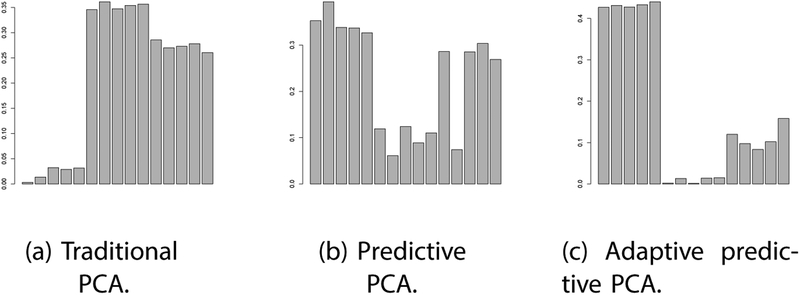
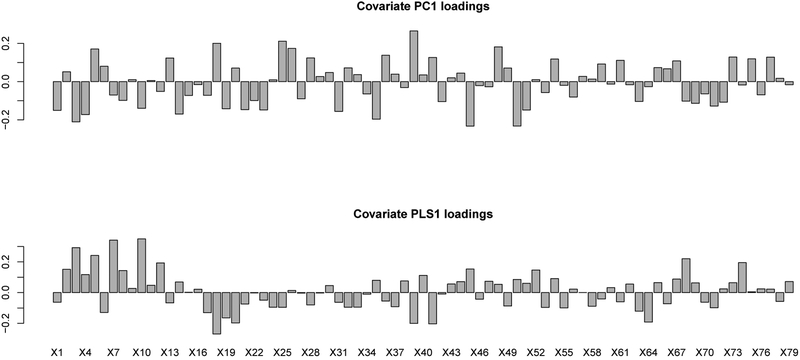
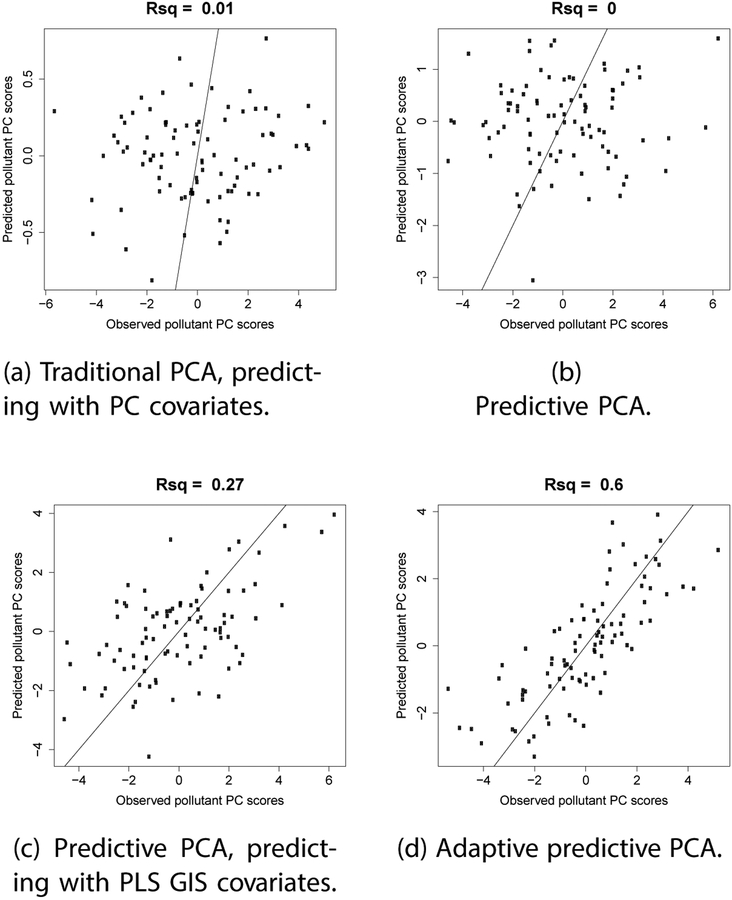
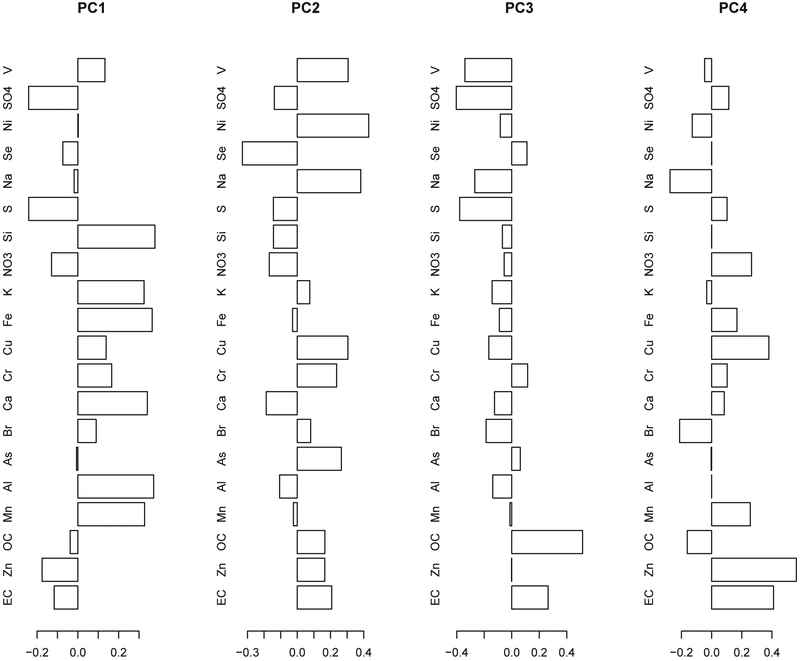
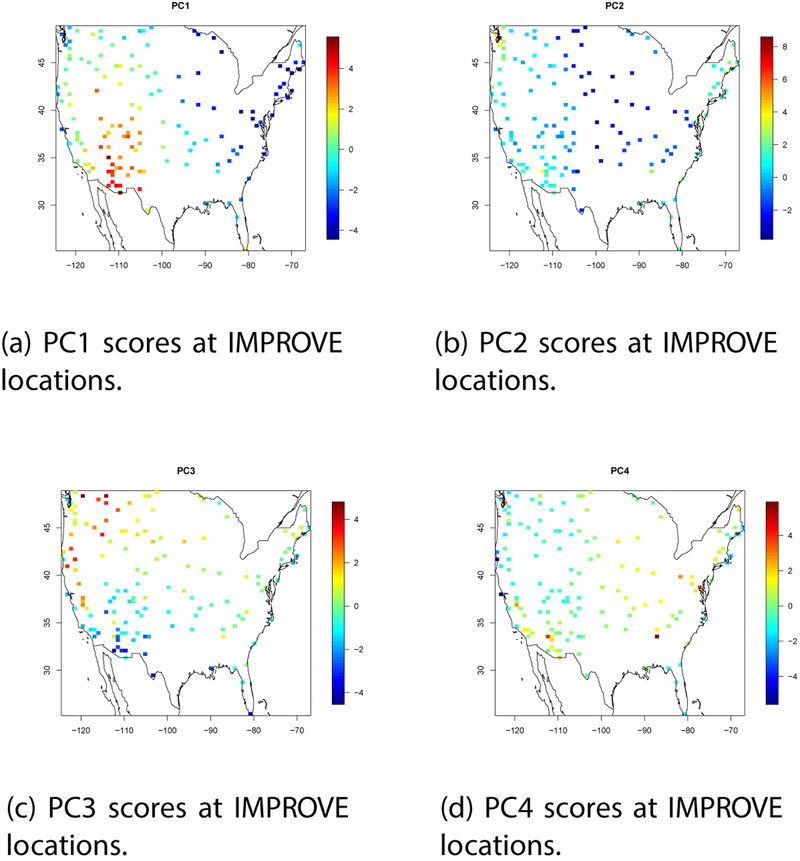
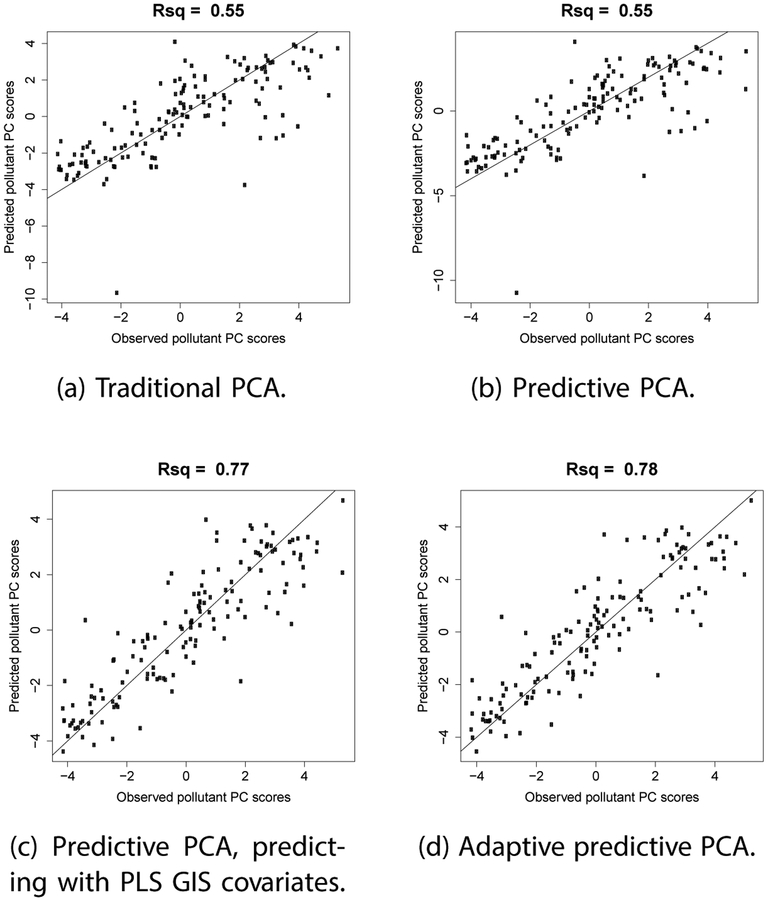
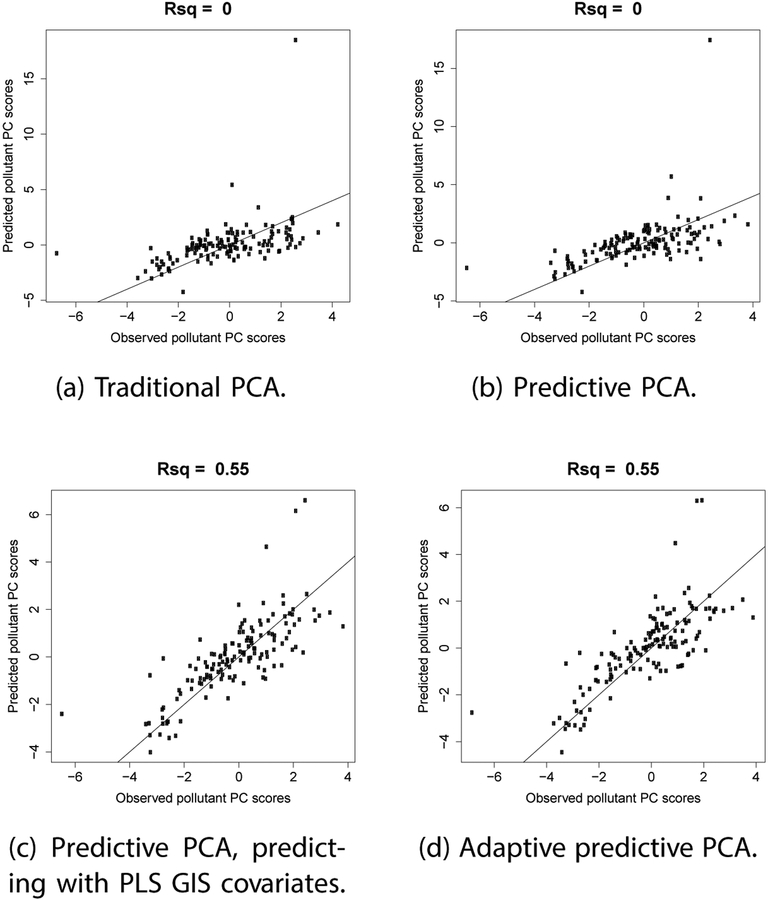
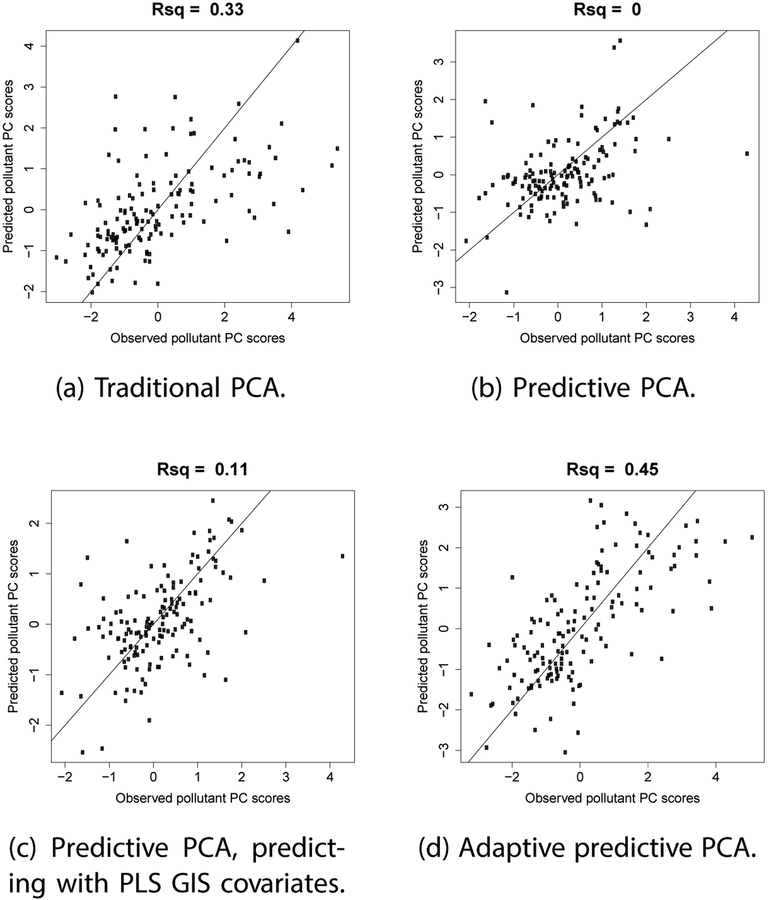
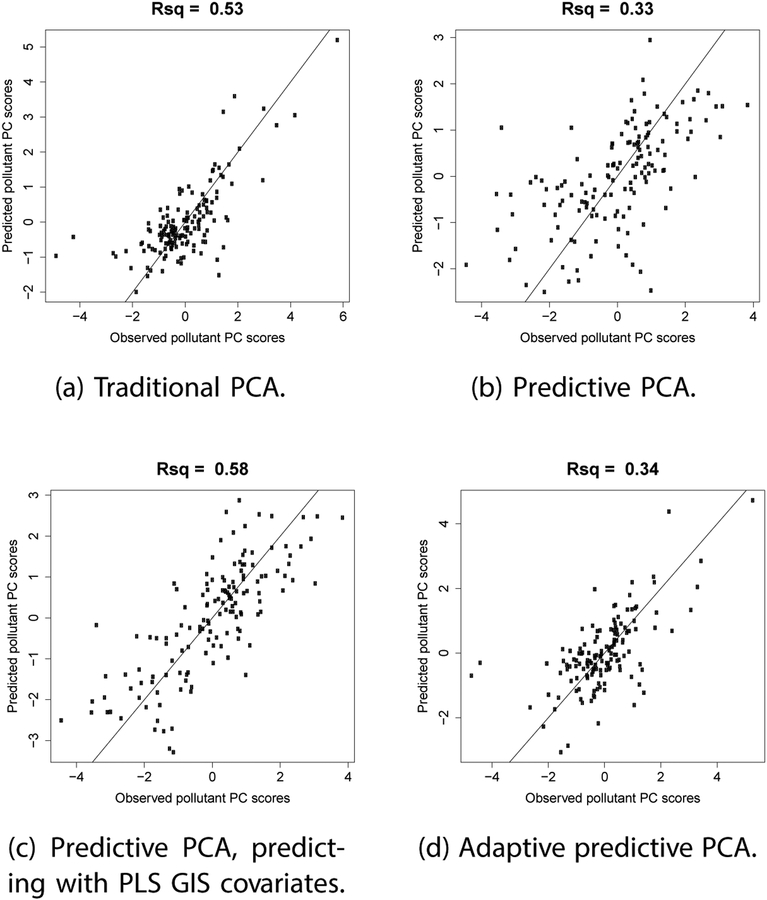
Air pollution monitoring locations are typically spatially misaligned with locations of participants in a cohort study, so to analyze pollution-health associations, exposures must be predicted at subject locations. For a pollution measure like PM2.5 (fine particulate matter) comprised of multiple chemical components, the predictive principal component analysis (PCA) algorithm derives a low-dimensional representation of component profiles for use in health analyses. Geographic covariates and spatial splines help determine the principal component loadings of the pollution data to give improved prediction accuracy of the principal component scores. While predictive PCA can accommodate pollution data of arbitrary dimension, it is currently limited to a small number of pre-selected geographic covariates. We propose an adaptive predictive PCA algorithm, which automatically identifies a combination of covariates that is most informative in choosing the principal component directions in the pollutant space. We show that adaptive predictive PCA improves the accuracy of multi-pollutant exposure predictions at subject locations.

Keywords: Multicomponent pollution; dimension reduction; partial least squares; prediction; spatial misalignment.


Figures

Figure 1:
Figure 1:
For one simulated dataset with uncorrelated covariates: PC1 loadings for the 15 pollutant constituents. There is one bar for each pollutant.
Figure 2:
Figure 2:
The first component of covariate loadings for predictive PCA, and for adaptive predictive PCA for pollutant PC1: for the simulation scenario with uncorrelated covariates. Note the difference in the axis scales: bottom figure axis maximum is greater than 0.2.
Figure 3:
Figure 3:
For one simulated dataset with uncorrelated covariates: Observed vs. predicted pollutant PC1 scores. The lines are 1–1 lines.
Figure 4:
Figure 4:
Loadings for first 4 pollutant PCs using the adaptive predictive PCA method on IMPROVE 2014 data.
Figure 5:
Figure 5:
Scores for first 4 pollutant PCs using the adaptive predictive PCA method on IMPROVE 2014 data.
Figure 6:
Figure 6:
PC1: Scatterplots of prediction of pollutant PC scores doing leave one out cross validation for IMPROVE 2014 data. The lines are 1–1 lines.
Figure 7:
Figure 7:
PC2: Scatterplots of prediction of pollutant PC scores doing leave one out cross validation for IMPROVE 2014 data. The lines are 1–1 lines.
Figure 8:
Figure 8:
PC3: Scatterplots of prediction of pollutant PC scores doing leave one out cross validation for IMPROVE 2014 data. The lines are 1–1 lines.
Figure 9:
Figure 9:
PC4: Scatterplots of prediction of pollutant PC scores doing leave one out cross validation for IMPROVE 2014 data. The lines are 1–1 lines.

Similar articles

Cited by

References

    1. Achilleos S, Kioumourtzoglou MA, Wu CD, Schwartz JD, Koutrakis P and Papatheodorou SI (2017). Acute effects of fine particulate matter constituents on mortality: A systematic review and meta-regression analysis. Environment International, 109, 89–100. - PMC - PubMed
    1. Badaloni C, Cesaroni G, Cerza F, Davoli M, Brunekreef B and Forastiere F (2017). Effects of long-term exposure to particulate matter and metal components on mortality in the Rome longitudinal study. Environment International, 109, 146–154. - PubMed
    1. Bell ML, Dominici F, Ebisu K, Zeger SL, and Samet JM (2007). Spatial and temporal variation in PM(2.5) chemical composition in the United States for health effects studies. Environmental Health Perspectives, 115(7), 989–995. - PMC - PubMed
    1. Bergen S, Sheppard L, Sampson PD, Kim SY, Richards M, Vedal S, … and Szpiro AA (2013). A national prediction model for PM2. 5 component exposures and measurement errorcorrected health effect inference. Environmental Health Perspectives, 121(9), 1017–1025. - PMC - PubMed
    1. Brook RD, Rajagopalan S, Pope CA, Brook JR, Bhatnagar A, Diez-Roux AV, … Kaufman JD (2010). Particulate matter air pollution and cardiovascular disease: An update to the scientific statement from the American Heart Association. Circulation, 121(21), 2331–2378. - PubMed

LinkOut - more resources