

Hypothermia-Induced Ubiquitination of Voltage-Dependent Anion Channel 3 Protects BV2 Microglia Cells From Cytotoxicity Following Oxygen-Glucose Deprivation/Recovery
- PMID: 32581711
- PMCID: PMC7289978
- DOI: 10.3389/fnmol.2020.00100
Hypothermia-Induced Ubiquitination of Voltage-Dependent Anion Channel 3 Protects BV2 Microglia Cells From Cytotoxicity Following Oxygen-Glucose Deprivation/Recovery
Abstract
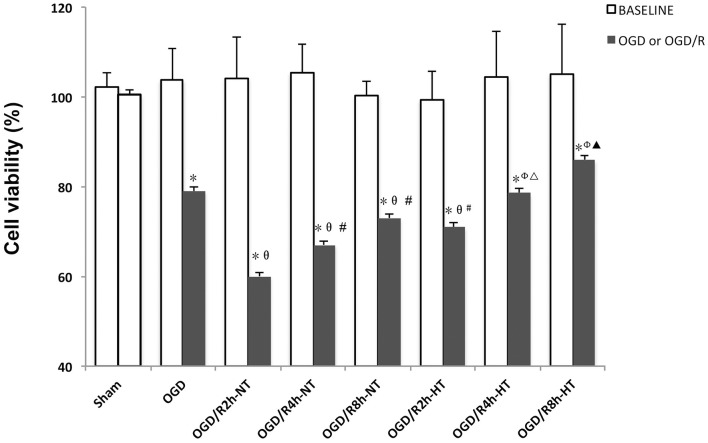
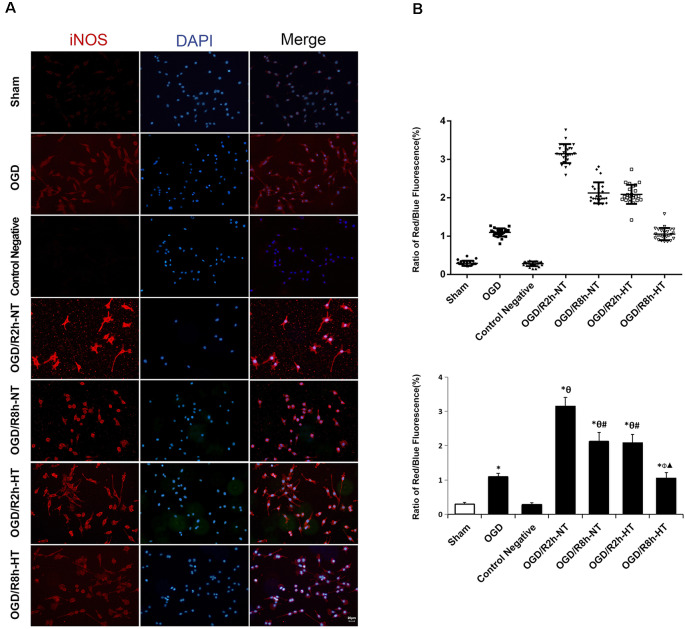
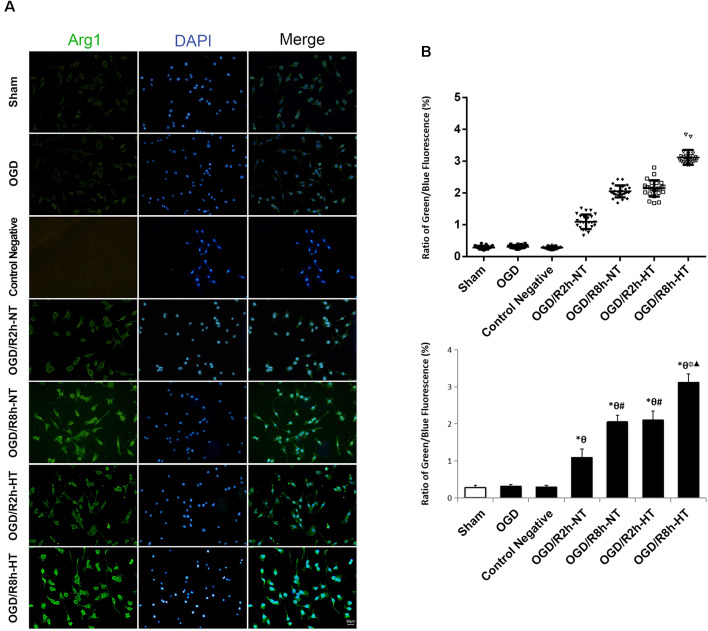
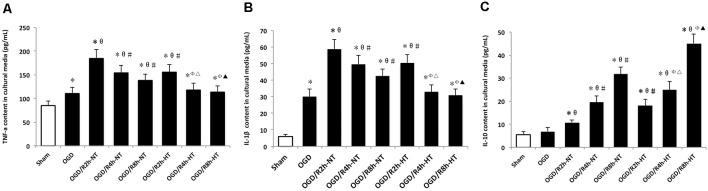
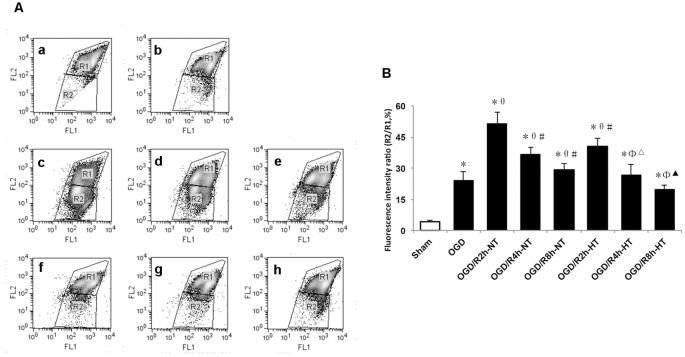
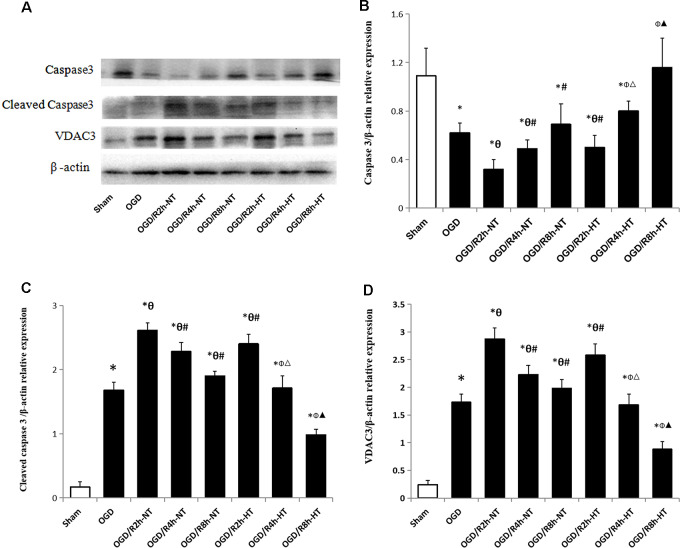
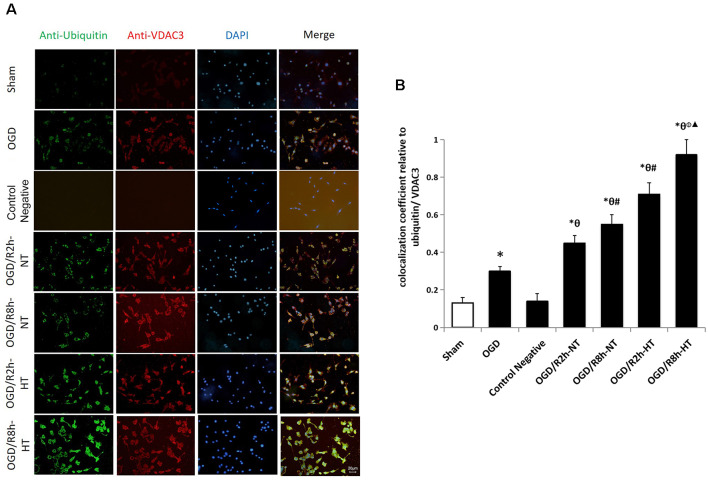
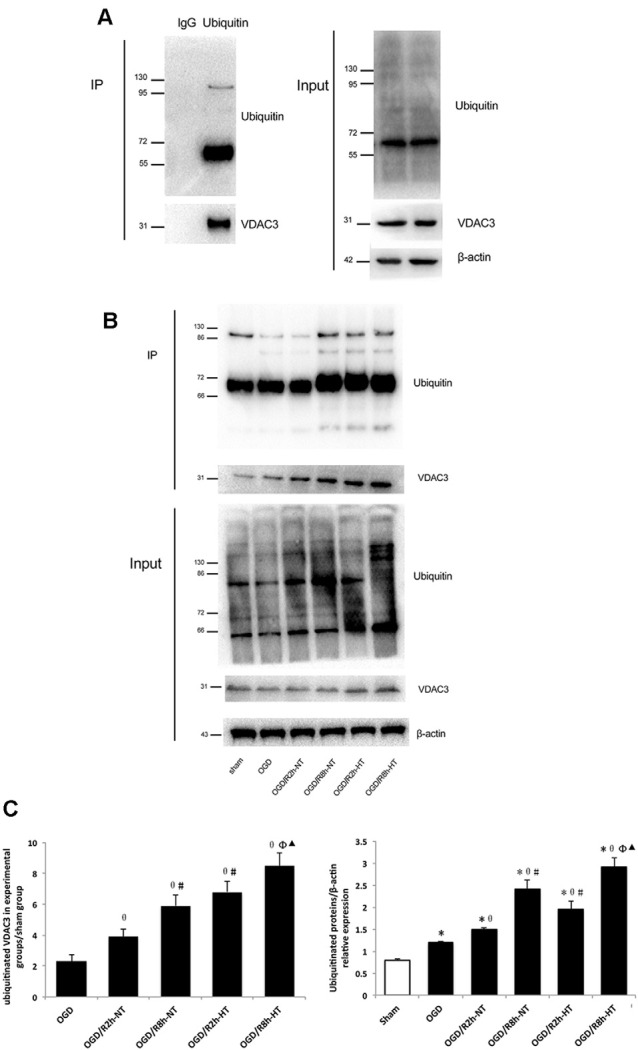
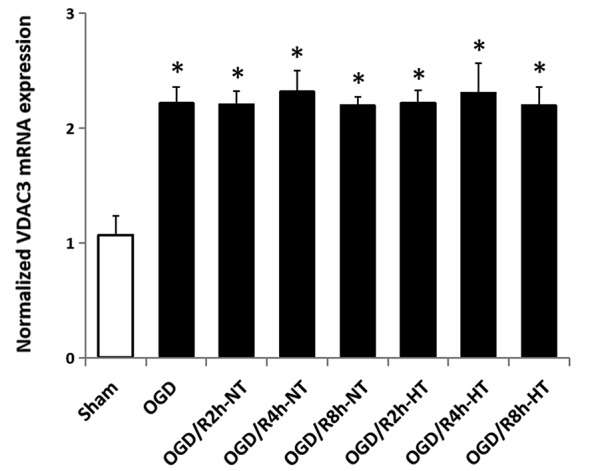
Background: Hypothermia attenuates microglial activation and exerts a potential neuroprotective effect against cerebral ischemic-reperfusion (I/R) injury. However, the underlying mechanism remains to be elucidated. In this in vitro study, a model of oxygen-glucose deprivation, followed by recovery (OGD/R), was used to investigate whether hypothermia exerts anti-inflammatory and anti-apoptosis properties via enhanced ubiquitination and down-regulation of voltage-dependent anion channel 3 (VDAC3) expression. Methods: BV2 microglia were cultured under OGD for 4 h following reperfusion with or without hypothermia for 2, 4, or 8 h. M1 and M2 microglia markers [inducible nitric oxide synthase (iNOS) and arginase (Arg)1] were detected using immunofluorescence. The levels of pro-inflammatory cytokines [tumor necrosis factor (TNF) α, interleukin (IL)-1β], and anti-inflammatory factor (IL-10) were determined using enzyme-linked immunosorbent assay (ELISA). Mitochondrial membrane potential (ΔΨm) was assayed by JC-1 staining using a flow cytometer. Expression of caspase-3, cleaved caspase-3, and VDAC3 were assessed using western blot analysis. The cellular locations and interactions of ubiquitin and VDAC3 were identified using double immunofluorescence staining and immunoprecipitation (IP) assay. Also, the level of the VDAC3 mRNA was determined using a quantitative polymerase chain reaction (qPCR). Results: Hypothermia inhibited the OGD/R-induced microglia activation and differentiation into the M1 type with pro-inflammatory effect, whereas it promoted differentiation to the M2 type with anti-inflammatory effect. Hypothermia attenuated OGD/R-induced loss of Δψm, as well as the expression of apoptosis-associated proteins. Compared to normothermia, hypothermia increased the level of ubiquitinated VDAC3 in the BV2 microglia at both 2 and 8 h of reperfusion. Furthermore, hypothermia did not attenuate VDAC3 mRNA expression in OGD/R-induced microglia. Conclusions: Hypothermia treatment during reperfusion, attenuated OGD/R-induced inflammation, and apoptosis in BV2 microglia. This might be due to the promotion of VDAC3 ubiquitination, identifying VDAC3 as a new target of hypothermia.
Keywords: BV2 microglial cells; VDAC3; cytotoxicity; hypothermia; oxygen-glucose deprivation/recovery.
Copyright © 2020 Zhao, Xiao, Cui, Gong, Lin, Chen and Tang.
Figures
Similar articles
-
Madecassoside protects BV2 microglial cells from oxygen-glucose deprivation/reperfusion-induced injury via inhibition of the toll-like receptor 4 signaling pathway.Brain Res. 2018 Jan 15;1679:144-154. doi: 10.1016/j.brainres.2017.11.030. Epub 2017 Dec 1. Brain Res. 2018. PMID: 29198964
-
Regulation of oxygen-glucose deprivation/reperfusion-induced inflammatory responses and M1-M2 phenotype switch of BV2 microglia by lobetyolin.Metab Brain Dis. 2023 Dec;38(8):2627-2644. doi: 10.1007/s11011-023-01292-6. Epub 2023 Oct 14. Metab Brain Dis. 2023. PMID: 37837601
-
[Mechanism of microglia promoting retinal ganglion cell death in vitro].Zhonghua Yan Ke Za Zhi. 2020 Jan 11;56(1):32-40. doi: 10.3760/cma.j.issn.0412-4081.2020.01.010. Zhonghua Yan Ke Za Zhi. 2020. PMID: 31937061 Chinese.
-
Cooling and Sterile Inflammation in an Oxygen-Glucose-Deprivation/Reperfusion Injury Model in BV-2 Microglia.Mediators Inflamm. 2021 Nov 5;2021:8906561. doi: 10.1155/2021/8906561. eCollection 2021. Mediators Inflamm. 2021. PMID: 34776788 Free PMC article.
-
VDAC3 As a Potential Marker of Mitochondrial Status Is Involved in Cancer and Pathology.Front Oncol. 2016 Dec 23;6:264. doi: 10.3389/fonc.2016.00264. eCollection 2016. Front Oncol. 2016. PMID: 28066720 Free PMC article. Review.
Cited by
-
The Value of Myocardium and Kidney Histopathological and Immunohistochemical Findings in Accidental Hypothermia-Related Fatalities.Medicina (Kaunas). 2022 Oct 23;58(11):1507. doi: 10.3390/medicina58111507. Medicina (Kaunas). 2022. PMID: 36363464 Free PMC article.
-
TJ-M2010-5, a novel CNS drug candidate, attenuates acute cerebral ischemia-reperfusion injury through the MyD88/NF-κB and ERK pathway.Front Pharmacol. 2022 Dec 15;13:1080438. doi: 10.3389/fphar.2022.1080438. eCollection 2022. Front Pharmacol. 2022. PMID: 36588708 Free PMC article.
-
Extracellular microparticles derived from hepatic progenitor cells deliver a death signal to hepatoma-initiating cells.J Nanobiotechnology. 2022 Feb 14;20(1):79. doi: 10.1186/s12951-022-01280-5. J Nanobiotechnology. 2022. PMID: 35164767 Free PMC article.
-
Zinc regulates microglial polarization and inflammation through IKBα after spinal cord injury and promotes neuronal repair and motor function recovery in mice.Front Pharmacol. 2025 Jan 29;16:1510372. doi: 10.3389/fphar.2025.1510372. eCollection 2025. Front Pharmacol. 2025. PMID: 39944615 Free PMC article.
-
Post-translational modifications and protein quality control of mitochondrial channels and transporters.Front Cell Dev Biol. 2023 Aug 3;11:1196466. doi: 10.3389/fcell.2023.1196466. eCollection 2023. Front Cell Dev Biol. 2023. PMID: 37601094 Free PMC article. Review.
References
-
- Callaway C. W., Donnino M. W., Fink E. L., Geocadin R. G., Golan E., Kern K. B., et al. . (2015). Part 8: post-cardiac arrest care: 2015 American Heart Association guidelines update for cardiopulmonary resuscitation and emergency cardiovascular care. Circulation 132, S465–S482. 10.1161/CIR.0000000000000262 - DOI - PMC - PubMed
LinkOut - more resources
Full Text Sources
Research Materials
Miscellaneous