. 2020 Jun 9:12:137.
doi: 10.3389/fnagi.2020.00137. eCollection 2020.

Dl-3-n-Butylphthalide Promotes Remyelination and Suppresses Inflammation by Regulating AMPK/SIRT1 and STAT3/NF-κB Signaling in Chronic Cerebral Hypoperfusion

Affiliations

Dl-3-n-Butylphthalide Promotes Remyelination and Suppresses Inflammation by Regulating AMPK/SIRT1 and STAT3/NF-κB Signaling in Chronic Cerebral Hypoperfusion

Meixi Li et al. Front Aging Neurosci. .

Abstract

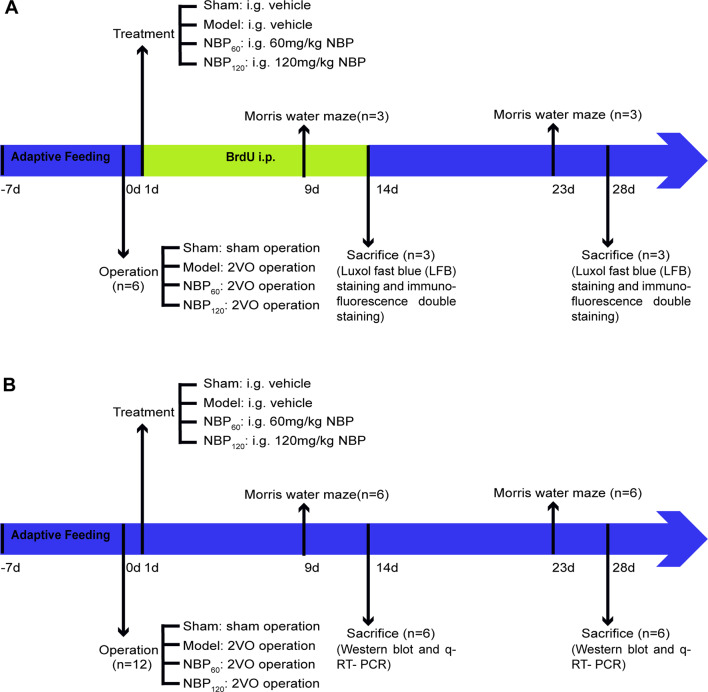
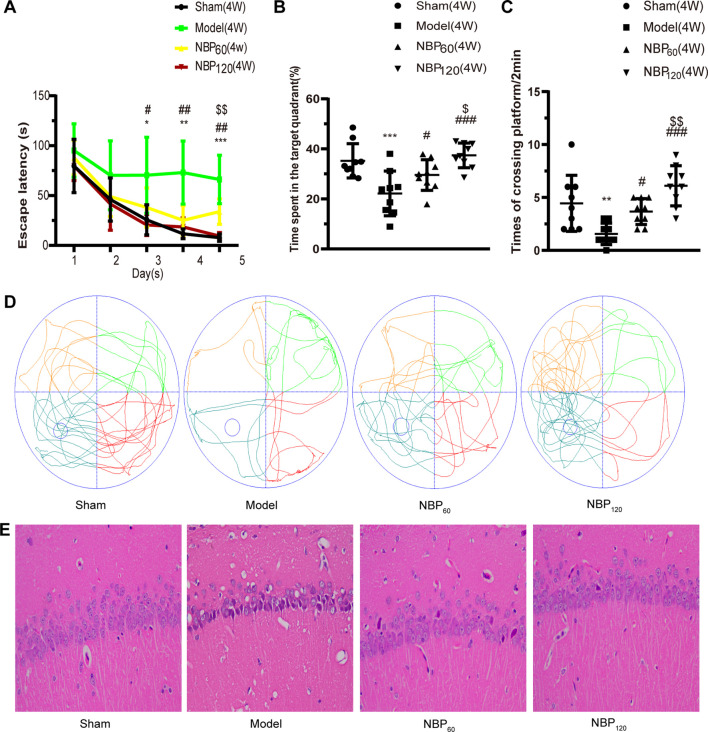
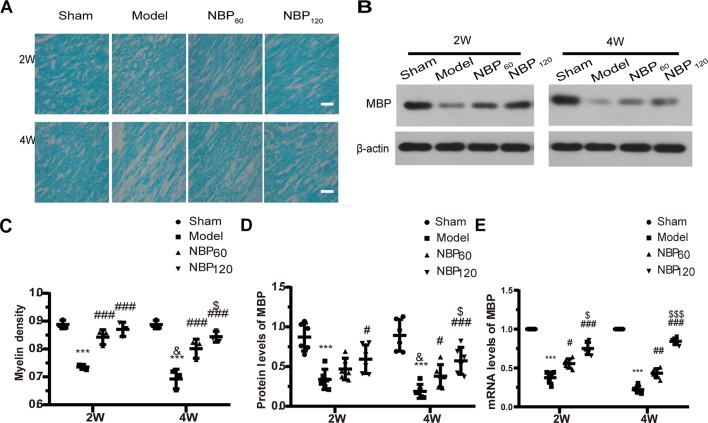
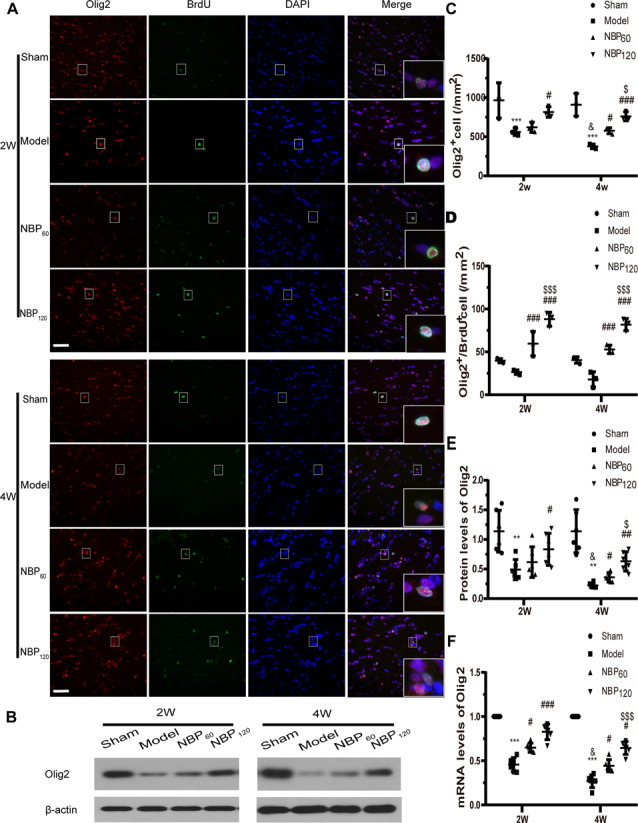
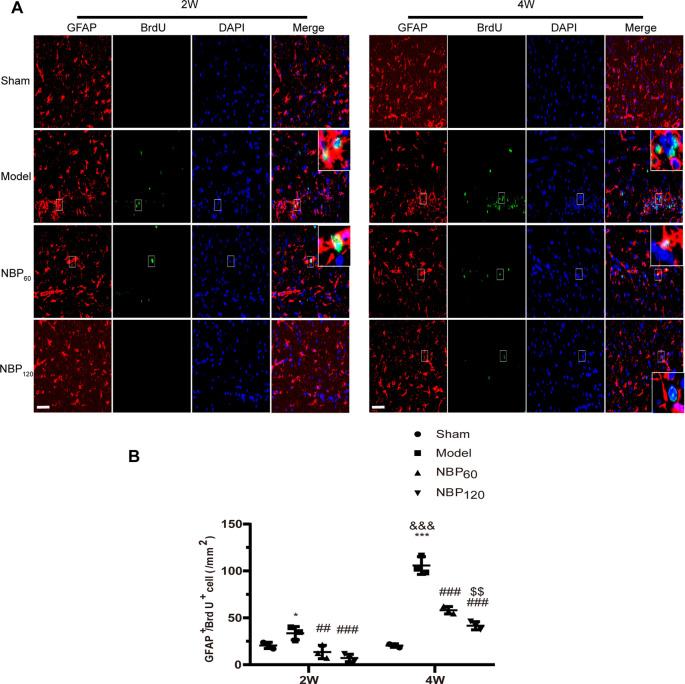
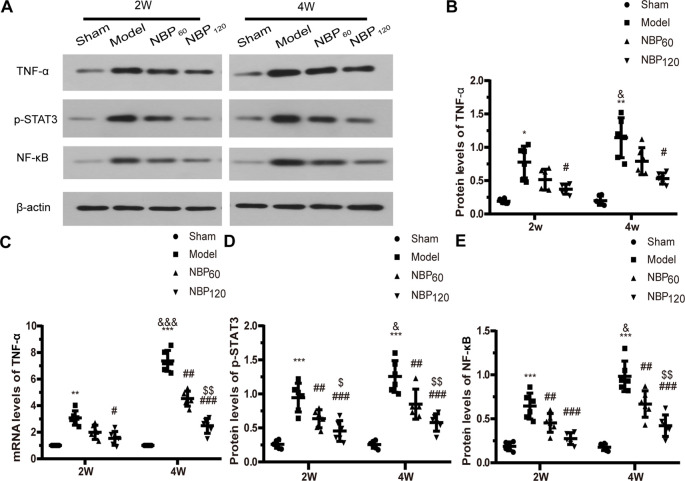
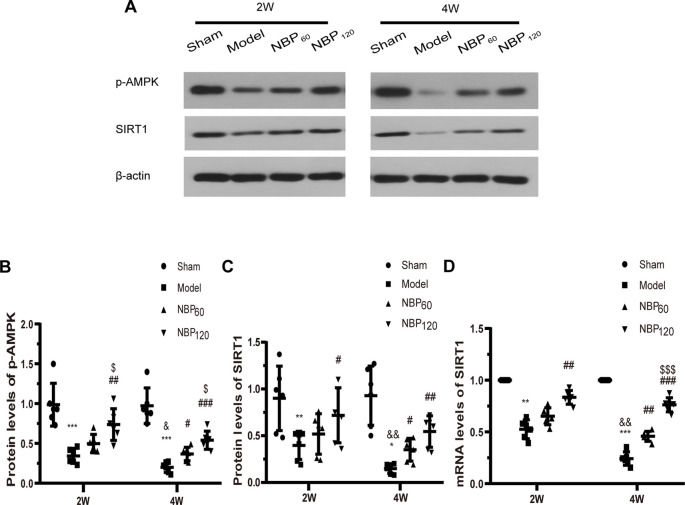
Demyelination in vascular dementia (VD) is partly attributable to inflammation induced by chronic cerebral hypoperfusion (CCH). Remyelination contributes to the recovery of cognitive impairment by inducing the proliferation and differentiation of oligodendrocyte progenitor cells. It was previously reported that Dl-3-n-butylphthalide (NBP) promotes cognitive improvement. However, whether NBP can stimulate remyelination and suppress inflammation after CCH remains unclear. To answer this question, the present study investigated the effects of NBP on remyelination in a rat model of CCH established by bilateral carotid artery occlusion. Functional recovery was evaluated with the Morris water maze (MWM) test, and myelin integrity, regeneration of mature oligodendrocytes, and inhibition of astrocyte proliferation were assessed by immunohistochemistry and histologic analysis. Additionally, activation of 5' AMP-activated protein kinase (AMPK)/Sirtuin (SIRT)1 and Signal transducer and activator of transcription (STAT)3/nuclear factor (NF)-κB signaling pathways was evaluated by western blotting. The results showed that NBP treatment improved memory and learning performance in CCH rats, which was accompanied by increased myelin integrity and oligodendrocyte regeneration, and reduced astrocyte proliferation and inflammation. Additionally, NBP induced the activation of AMPK/SIRT1 signaling while inhibiting the STAT3/NF-κB pathway. These results indicate that NBP alleviates cognitive impairment following CCH by promoting remyelination and suppressing inflammation via modulation of AMPK/SIRT1 and STAT3/NF-κB signaling.

Keywords: AMPK/SIRT1 pathway; Dl-3-n-butylphthalide (NBP); STAT3/NF-κB pathway; chronic cerebral hypoperfusion; inflammation; remyelination.


Figures

Figure 1
Figure 1
A complete flow chart of this study. (A) The flow chart of the morphological part in this study. The rats in each group were injected with BrdU intraperitoneally for 14 consecutive days. They were sacrificed at 2 weeks and 4 weeks separately for luxol fast blue (LFB) staining and immunofluorescence double staining. n = 6. (B) The flow chart of the molecular part in this study. Rats in each group were sacrificed at 2 weeks and 4 weeks separately for western blot and q-RT-PCR. n = 12.
Figure 2
Figure 2
Dl-3-n-butylphthalide (NBP) alleviates learning and memory deficiency, and the pathologic changes in hippocampal CA 1 region at 4 weeks after 2VO (Morris water maze, n = 9 in each group; Hematox­ylin-eosin staining, n = 3 in each group). (A) Escape latency changes in different groups from day 1 to day 5. (B) Changes in time spent in the target quadrant (%) at day 6. (C) Changes in frequency of platform crossings in 2 min at day 6. (D) Swimming path of rats at day 6 in different groups. (E) Representative images of Hematoxylin-eosin staining in the hippocampal CA1 region. *p < 0.05, **p < 0.01, ***p < 0.001, the model group vs. the sham group; #p < 0.05, ##p < 0.01, ###p < 0.001, the NBP60 group or NBP120 group vs. the model group; $p < 0.05, $$p < 0.01, the NBP60 group vs. NBP120 group. Values are expressed as mean ± SD.
Figure 3
Figure 3
Dl-3-n-butylphthalide (NBP) attenuates demyelination in corpus callosum after 2VO. (A) Representative images of luxol fast blue (LFB) staining in the corpus callosum at 2 weeks and 4 weeks after 2VO. Bar = 50 μm (n = 3 in each group). (B) Western blot analysis of the expressions of MBP (n = 6 in each group). (C) Myelin density in each group presented by the percentage of stained area in total area of corpus callosum. (D) Quantitative analysis of protein levels of MBP. β-actin was used as an internal control. (E) Quantitative analysis of mRNA levels of MBP. β-actin was used as an internal control (n = 6 in each group). ***p < 0.001, the model group vs. the sham group; #p < 0.05, ##p < 0.01, ###p < 0.001, the NBP60 group or NBP120 group vs. the model group; $p < 0.05, $$$p < 0.001, the NBP60 group vs. NBP120 group; and &p < 0.05, the model group sacrificed at 2 weeks vs. the model group sacrificed at 4 weeks. Values are expressed as mean ± SD. MBP, myelin basic protein.
Figure 4
Figure 4
Dl-3-n-butylphthalide (NBP) promotes oligodendrocytes regeneration in corpus callosum after 2VO. (A) Representative images of Olig2 (red) and BrdU (green) immunofluorescence double labeling in corpus callosum at 2 weeks and 4 weeks after 2VO. Bar = 50 μm. Typical double-labeled areas are magnified (n = 3 in each group). (B) Western blot analysis of the expressions of Olig2 (n = 6 in each group). (C) The number of Olig2+ cells in corpus callosum. (D) The number of Olig2+/BrdU+ cells in corpus callosum. (E) Quantitative analysis of protein levels of Olig2. β-actin was used as an internal control. (F) Quantitative analysis of mRNA levels of Olig2. β-actin was used as an internal control (n = 6 in each group). **p < 0.01, ***p < 0.001, the model group vs. the sham group; #p < 0.05, ##p < 0.01, ###p < 0.001, the NBP60 group or NBP120 group vs. the model group; $p < 0.05, $$$p < 0.001, the NBP60 group vs. NBP120 group; and &p < 0.05, the model group sacrificed at 2 weeks vs. the model group sacrificed at 4 weeks. Values are expressed as mean ± SD. Olig2, oligodendrocyte lineage transcription factor 2.
Figure 5
Figure 5
Dl-3-n-butylphthalide (NBP) suppresses astrocytes regeneration after 2VO. (A) Representative images of GFAP (red) and BrdU (green) immunofluorescence double labeling in corpus callosum at 2 weeks and 4 weeks after 2VO. Bar = 50 μm. Typical double-labeled areas are magnified (n = 3 in each group). (B) The number of GFAP+/BrdU+ cells in corpus callosum. *p < 0.05, ***p < 0.001, the model group vs. the sham group; ##p < 0.01, ###p < 0.001, the NBP60 group or NBP120 group vs. the model group; $$p < 0.01, the NBP60 group vs. NBP120 group; &&&p < 0.001, the model group sacrificed at 2 weeks vs. the model group sacrificed at 4 weeks. Values are expressed as mean ± SD. GFAP, glial fibrillary acidic protein.
Figure 6
Figure 6
Dl-3-n-butylphthalide (NBP) suppresses inflammation induced after 2VO. (A) Western blot analysis of the expressions of TNF-a, p-STAT3 and NF-KB (n = 6 in each group). (B) Quantitative analysis of protein levels of TNF-α. (C) Quantitative analysis of mRNA levels of TNF-α (n = 6 in each group). (D) Quantitative analysis of protein levels of p-STAT3. (E) Quantitative analysis of protein levels of NF-KB. β-actin was used as an internal control. *p < 0.05, **p < 0.01, ***p < 0.001, the model group vs. the sham group; #p < 0.05, ##p < 0.01, ###p < 0.001, the NBP60 group or NBP120 group vs. the model group; $p < 0.05, $$p < 0.01, the NBP60 group vs. NBP120 group; &p < 0.05, &&&p < 0.001, the model group sacrificed at 2 weeks vs. the model group sacrificed at 4 weeks. Values are expressed as mean ± SD. TNF-α, tumor necrosis factor-α. p-STAT3, phosphorylated signal transducers and activators of transcription 3. NF-κB, nuclear factor κB.
Figure 7
Figure 7
Dl-3-n-butylphthalide (NBP) upregulates AMPK/SIRT1 signaling after 2VO. (A) Western blot analysis of the expressions of p-AMPK and SIRT1 (n = 6 in each group). (B) Quantitative analysis of protein levels of p-AMPK. (C) Quantitative analysis of protein levels of SIRT1. (D) Quantitative analysis of mRNA levels of SIRT1 (n = 6 in each group). β-actin was used as an internal control. *p < 0.05, **p < 0.01, ***p < 0.001, the model group vs. the sham group; #p < 0.05, ##p < 0.01, ###p < 0.001, the NBP60 group or NBP120 group vs. the model group; $p < 0.05, $$$p < 0.001, the NBP60 group vs. NBP120 group; and &p < 0.05, &&p < 0.01, the model group sacrificed at 2 weeks vs. the model group sacrificed at 4 weeks. Values are expressed as mean ± SD. p-AMPK, phosphorylated AMP-activated protein kinase. SIRT1, silent mating type information regulation 2 homolog 1.

References

    1. Ashburner B. P., Westerheide S. D., Baldwin A. S., Jr. (2001). The p65 (RelA) subunit of NF-κB interacts with the histone deacetylase (HDAC) corepressors HDAC1 and HDAC2 to negatively regulate gene expression. Mol. Cell. Biol. 21, 7065–7077. 10.1128/mcb.21.20.7065-7077.2001 - DOI - PMC - PubMed
    1. Back S. A., Kroenke C. D., Sherman L. S., Lawrence G., Gong X., Taber E. N., et al. . (2011). White matter lesions defined by diffusion tensor imaging in older adults. Ann. Neurol. 70, 465–476. 10.1002/ana.22484 - DOI - PMC - PubMed
    1. Bonda D. J., Lee H. G., Camins A., Pallàs M., Casadesus G., Smith M. A., et al. . (2011). The sirtuin pathway in ageing and Alzheimer disease: mechanistic and therapeutic considerations. Lancet Neurol. 10, 275–279. 10.1016/s1474-4422(11)70013-8 - DOI - PMC - PubMed
    1. Caminero A., Comabella M., Montalban X. (2011). Tumor necrosis factor α (TNF-α), anti-TNF-α and demyelination revisited: an ongoing story. J. Neuroimmunol. 234, 1–6. 10.1016/j.jneuroim.2011.03.004 - DOI - PubMed
    1. Cao F., Hata R., Zhu P., Nakashiro K., Sakanaka M. (2010). Conditional deletion of Stat3 promotes neurogenesis and inhibits astrogliogenesis in neural stem cells. Biochem. Biophys. Res. Commun. 394, 843–847. 10.1016/j.bbrc.2010.03.092 - DOI - PubMed