Review
. 2020 Jun 4:11:504.
doi: 10.3389/fphys.2020.00504. eCollection 2020.

Gating and Regulation of KCNQ1 and KCNQ1 + KCNE1 Channel Complexes

Affiliations
Review

Gating and Regulation of KCNQ1 and KCNQ1 + KCNE1 Channel Complexes

Yundi Wang et al. Front Physiol. .

Abstract

The IKs channel complex is formed by the co-assembly of Kv7.1 (KCNQ1), a voltage-gated potassium channel, with its β-subunit, KCNE1 and the association of numerous accessory regulatory molecules such as PIP2, calmodulin, and yotiao. As a result, the IKs potassium current shows kinetic and regulatory flexibility, which not only allows IKs to fulfill physiological roles as disparate as cardiac repolarization and the maintenance of endolymph K+ homeostasis, but also to cause significant disease when it malfunctions. Here, we review new areas of understanding in the assembly, kinetics of activation and inactivation, voltage-sensor pore coupling, unitary events and regulation of this important ion channel complex, all of which have been given further impetus by the recent solution of cryo-EM structural representations of KCNQ1 alone and KCNQ1+KCNE3. Recently, the stoichiometric ratio of KCNE1 to KCNQ1 subunits has been confirmed to be variable up to a ratio of 4:4, rather than fixed at 2:4, and we will review the results and new methodologies that support this conclusion. Significant advances have been made in understanding differences between KCNQ1 and IKs gating using voltage clamp fluorimetry and mutational analysis to illuminate voltage sensor activation and inactivation, and the relationship between voltage sensor translation and pore domain opening. We now understand that the KCNQ1 pore can open with different permeabilities and conductance when the voltage sensor is in partially or fully activated positions, and the ability to make robust single channel recordings from IKs channels has also revealed the complicated pore subconductance architecture during these opening steps, during inactivation, and regulation by 1-4 associated KCNE1 subunits. Experiments placing mutations into individual voltage sensors to drastically change voltage dependence or prevent their movement altogether have demonstrated that the activation of KCNQ1 alone and IKs can best be explained using allosteric models of channel gating. Finally, we discuss how the intrinsic gating properties of KCNQ1 and IKs are highly modulated through the impact of intracellular signaling molecules and co-factors such as PIP2, protein kinase A, calmodulin and ATP, all of which modulate IKs current kinetics and contribute to diverse IKs channel complex function.

Keywords: IKs; KCNE1; KCNQ1; PKA; activation gating; calmodulin; single channels.


Figures

FIGURE 1
FIGURE 1
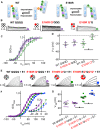
IKs channel gating depends on the stoichiometric ratio of KCNE1:KCNQ1. Representative single channel (above) and whole cell currents (below) with single channel all-points amplitude histograms of active sweeps (lower right) are shown for EQ (orange), EQQ (blue), EQQQQ (green), and KCNQ1 (black) expressed alone (A–B) or in combination with wild-type KCNE1-GFP (C, all panels). The predicted stoichiometry of KCNE1:KCNQ1 in each case is shown above. Arrows on histograms indicate the peak of the major Gaussian fit. Whole cell protocol: 4 s pulses from –80 mV to between –80 and +100 mV, followed by a repolarizing step to –40 mV for 1 s. Single channel protocol: 4 s pulses from –60 mV (–80 mV for EQQQQ) to +60 mV for 4 s, repolarized to –40 mV for 0.75 s. In A-C, topologies of expected channel Q1 and E1 complexes indicated as large hollow and small filled circles, respectively. (D) V1/2 of activation (n = 3–11; *p < 0.05) as indicated. Mean G-V plots from peak tail currents: KCNQ1 (black), EQQQQ (green), EQQ (blue), and EQ (orange) expressed alone (E) and in the presence of KCNE1 (F; filled symbols). (G) Slope conductance for each construct showing peak open amplitudes in the presence of KCNE1 (4:4 stoichiometry, EQ, EQQ, EQQQQ and KCNQ1 in the presence of KCNE1) and EQQ alone. Conductance not measured for EQQQQ or KCNQ1 alone. All error bars in this and other figures denote mean ± SE. Figure adapted from Murray et al. (2016), Figures 1–3. Reproduced with permission of CC-BY 4.0.
FIGURE 2
FIGURE 2
Voltage sensor movement (F-V) and pore opening (G-V) of KCNQ1 in the absence and presence of KCNE1. Fluorescence (left) and current recordings (right) are shown for G219C-KCNQ1 in the absence (G219C Q) (A) and presence of KCNE1 (G219C Q + E1) (B). Expected channel Q1 and E1 complex topologies shown as large and small filled circles, respectively. A three-step protocol was used for current and fluorescence: 4 s pre-pulses to –140 mV (not shown), followed by 5 s steps to potentials between +80 and –180 mV, with a final repolarization step to –40 mV for 1 s. (C) Mean G–V and F–V plots obtained in the absence (G219C Q F-V: black circles; G219C Q G-V: black triangles) and presence of KCNE1 (G219C Q + E1 F-V: red circles; G219C Q + E1 G-V: red triangles). The G219C Q + E1 F-V was fit with a double Boltzmann function to obtain F1 and F2 components. Other F-V and G-V curves were fit with a single Boltzmann function. Fluorescence and current data were replotted from Westhoff et al. (2019), Figure 8 with permission.
FIGURE 3
FIGURE 3
Functional currents from KCNQ1 and KCNQ1 + KCNE1 channel complexes with one, two or three E160R mutations (A) Cartoons representing possible charge interactions between WT S2 and S4 TMDs during activation and deactivation (left) and E160R mutants when VSD movement is impeded by charge repulsion (right). Channel topology configurations of WT Q1 (black) and E160R mutant (red) subunits, with E1 (gray) are shown adjacent to current traces (B,E). Black lines represent tethers between subunits. Currents were obtained using the same protocol as in Figures 1B–D. In the absence of KCNE1. Currents (B), mean G-V (C), and summary V1/2 of activation (D) for KCNQ1 complexes containing zero (WT QQQQ: purple triangles; WT QQ: green diamonds), one (E160R Q*QQQ; purple circles) or two (E160R Q*Q; green circles) E160R mutant subunits (n = 3–4; *p < 0.05). (E–G) In the presence of KCNE1. Currents (E), mean G-V (F) V1/2 of activation (G) for Q1 + E1 complexes containing zero (WT QQQQ; purple triangles), one (E160R Q*QQQ; purple circles), two (E160R Q*Q; green circles) or three (E160R EQ*QQ*Q*; blue circles) E160R subunits (n = 5–8; p < 0.05). (E, Inset) Expanded view of G-V plots between –50 and +20 mV (p < 0.05). Figure adapted from Westhoff et al. (2019), Figures 1, 3.
FIGURE 4
FIGURE 4
S4-S5L interactions of the PIP2 bound hKCNQ1/KCNE3/CaM structure. Each of three subunits of the tetramer is shown in a different color. The S4-S5L of the yellow subunit is shown in magenta for emphasis. Side chains of residues of the S4-S5L and residues within 4Å of these are shown, in addition to E160, R237 and Q234 in the yellow subunit to emphasize the activated state of the VSD. Only some of the more visible side chains are labeled but all residues appearing to interact with the linker include: R116, R174, I198, L239, H240, V241, Q260, E261, L262, and I263 (yellow subunit); E261, Y267, I268, and L271 (green subunit); none (cyan subunit); L75 and Y79 (KCNE3); PIP2. CaM and most of the intracellular portions (illustrated in inset to right), as well as the VSD of the cyan subunit, a third entire subunit and all but one KCNE3 (dark blue) have been removed for clarity. Image made from pdb 6V01 (Sun and MacKinnon, 2020) using PyMOL software (The PyMOL Molecular Graphics System, Version 2.2.3 Schrödinger, LLC).
FIGURE 5
FIGURE 5
In the PIP2 bound state the KCNQ1 S4-S5L appears to have pivoted out and S6 has expanded into the space vacated. View is from below. Each of three subunits of the tetramer is shown in a different color. The S4-S5L of the yellow subunit is shown in magenta for emphasis. The PIP2-free structure of hKCNQ1/CaM/KCNE3 is on top (6V00) and the PIP2-bound structure is on the bottom (6V01). The asterisks indicate the location of the inner vestibule. Most of the intracellular portions and transmembrane regions of the other subunits have been removed for clarity. Inset: overlay of just the linker and the covalently linked S6 subunit, in PIP2 bound and unbound states highlighting changes related to PD opening. Arrow points in direction of expansion. Image made from pdbs 6V01 and 6V00 (Sun and MacKinnon, 2020) using PyMOL software (The PyMOL Molecular Graphics System, Version 2.2.3 Schrödinger, LLC).
FIGURE 6
FIGURE 6
CaM unbinds from the S2-S3L in the PIP2 bound structure of hKCNQ1/KCNE3/CaM. Each of three subunits of the tetramer is shown in a different color. The S4-S5L of the yellow subunit is shown in magenta for emphasis. Only one CaM molecule is shown in the PIP2-free structure on the left (6V00) and the PIP2-bound structure in the middle panel (6V01) and most of the intracellular portions (illustrated in insets to right), as well as the VSD of the cyan subunit, a third entire subunit and all but one KCNE3 have been removed for clarity. Red arrow points to CaM interaction site on the S2-S3L. Image made from pdb 6V00 and 6V01 (Sun and MacKinnon, 2020) using PyMOL software (The PyMOL Molecular Graphics System, Version 2.2.3 Schrödinger, LLC).
FIGURE 7
FIGURE 7
Binding site, signaling pathway and functional effect of various intracellular signaling molecules and co-factors on IKs. Left Table: Functional effect of protein kinase A (PKA) phosphorylation, ATP, Ca2+, CaM, CaM1234, and PIP2 on IKs where “+” and “–” denotes a stimulatory and inhibitory effect, respectively. “Obligatory” indicates ATP is required for channel conductance. Left panel: Cartoon of the single transmembrane β-subunit KCNE1 and the α-subunit KCNQ1. KCNQ1 consists of 6 transmembrane domains (TM1-4 and TM5-6 form the voltage sensor and pore domain, respectively) and 4 helices (A–D). Four KCNQ1 subunits come together to form the channel with 1-4 KCNE1 subunits. Binding sites for ATP, CaM/CaM1234 and PIP2 as well as sites of PKA phosphorylation are depicted using colored arrows (for binding sites) or directly on KCNQ1 (for PKA phosphorylation). Ca2+ is known to bind to CaM but not CaM1234 however, Ca2+ may modulate the channel by binding and interacting with other proteins and/or other locations on the IKs channel complex which are presently unknown. Right Table: The impact of KCNE1:KCNQ1 stoichiometry on the phosphorylation of residues S27 and S92 by PKA and the consequent functional effect. Checkmarks indicate PKA phosphorylation occurs or a functional effect is seen on the respective stoichiometrically fixed KCNE1:KCNQ1 complex (EQ, EQQ, EQQQQ, and KCNQ1). The “X” indicates a functional effect is not seen despite PKA phosphorylation of KCNQ1. Right panel: Signaling pathway for β-adrenergic enhancement of IKs current through PKA phosphorylation.

Similar articles

Cited by

References

    1. Abbott G. W. (2014). Biology of the KCNQ1 potassium channel. New J. Sci. 2014 1–26. 10.1155/2014/237431 - DOI
    1. Abbott G. W., Sesti F., Splawski I., Buck M. E., Lehmann W. H., Timothy K. W., et al. (1999). MiRP1 forms I Kr potassium channels with HERG and is associated with cardiac arrhythmia. Cell 97 175–187. 10.1016/s0092-8674(00)80728-x - DOI - PubMed
    1. Abitbol I., Peretz A., Lerche C., Busch A. E., Attali B. (1999). Stilbenes and fenamates rescue the loss of I KS channel function induced by an LQT5 mutation and other IsK mutants. EMBO J. 18 4137–4148. 10.1093/emboj/18.15.4137 - DOI - PMC - PubMed
    1. Aldrich R. W. (2001). Fifty years of inactivation. Nature 411 643–644. 10.1038/35079705 - DOI - PubMed
    1. Altomare C., Bucchi A., Camatini E., Baruscotti M., Viscomi C., Moroni A., et al. (2001). Integrated allosteric model of voltage gating of HCN channels. J. Gen. Physiol. 117 519–532. 10.1085/jgp.117.6.519 - DOI - PMC - PubMed