. 2020 May 27:11:510.
doi: 10.3389/fphys.2020.00510. eCollection 2020.

MiR-181d-5p Targets KLF6 to Improve Ischemia/Reperfusion-Induced AKI Through Effects on Renal Function, Apoptosis, and Inflammation

Affiliations

MiR-181d-5p Targets KLF6 to Improve Ischemia/Reperfusion-Induced AKI Through Effects on Renal Function, Apoptosis, and Inflammation

Yue Zhang et al. Front Physiol. .

Abstract

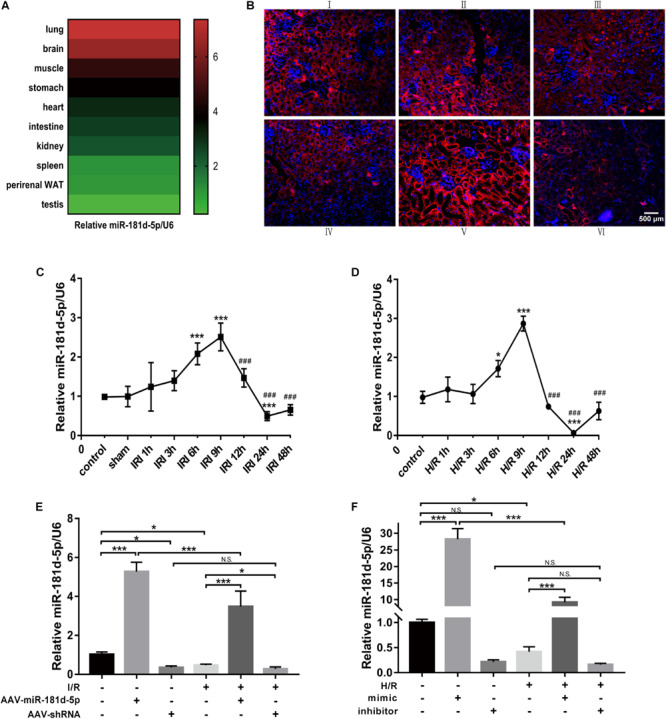
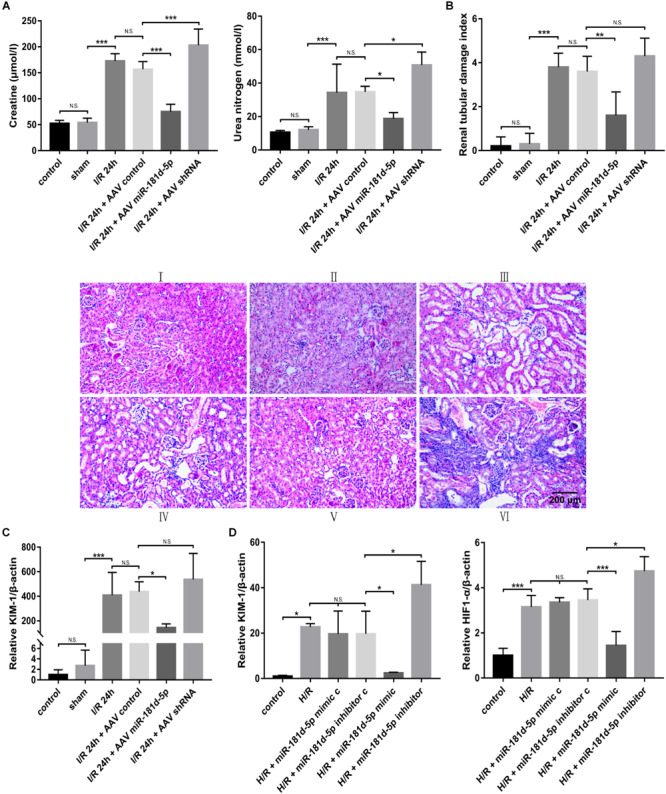
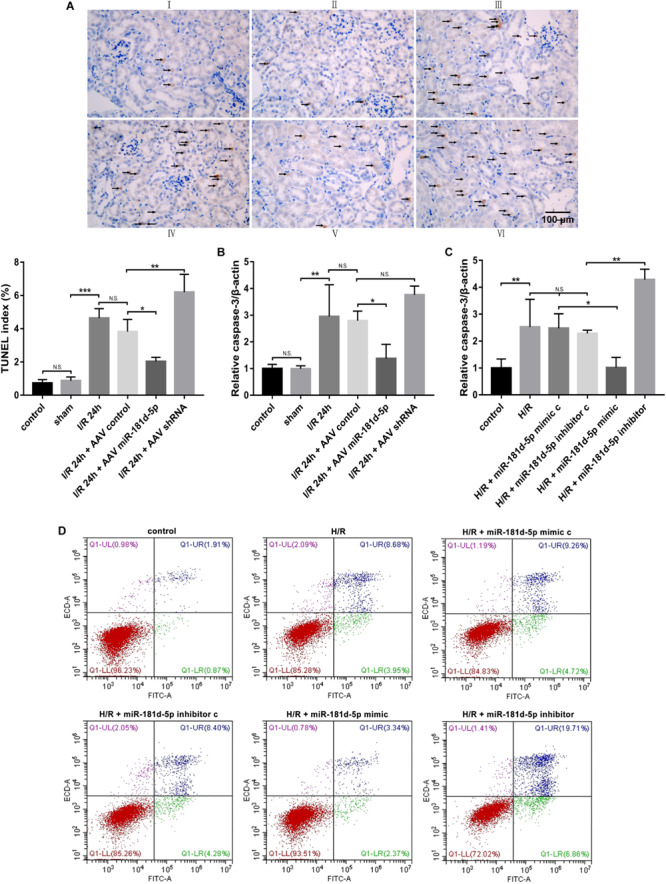
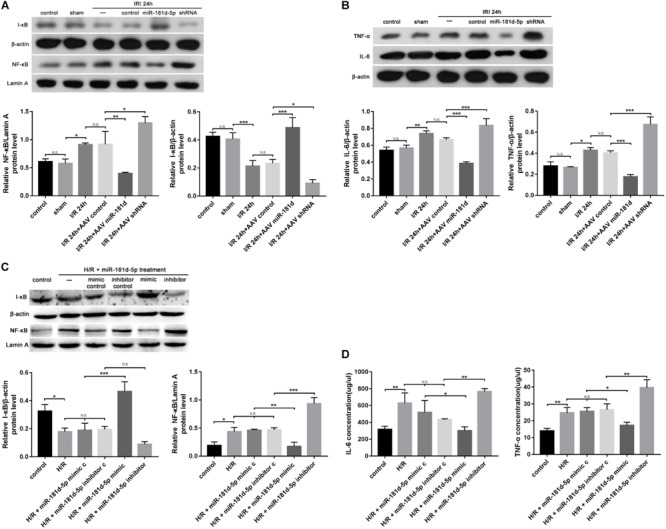
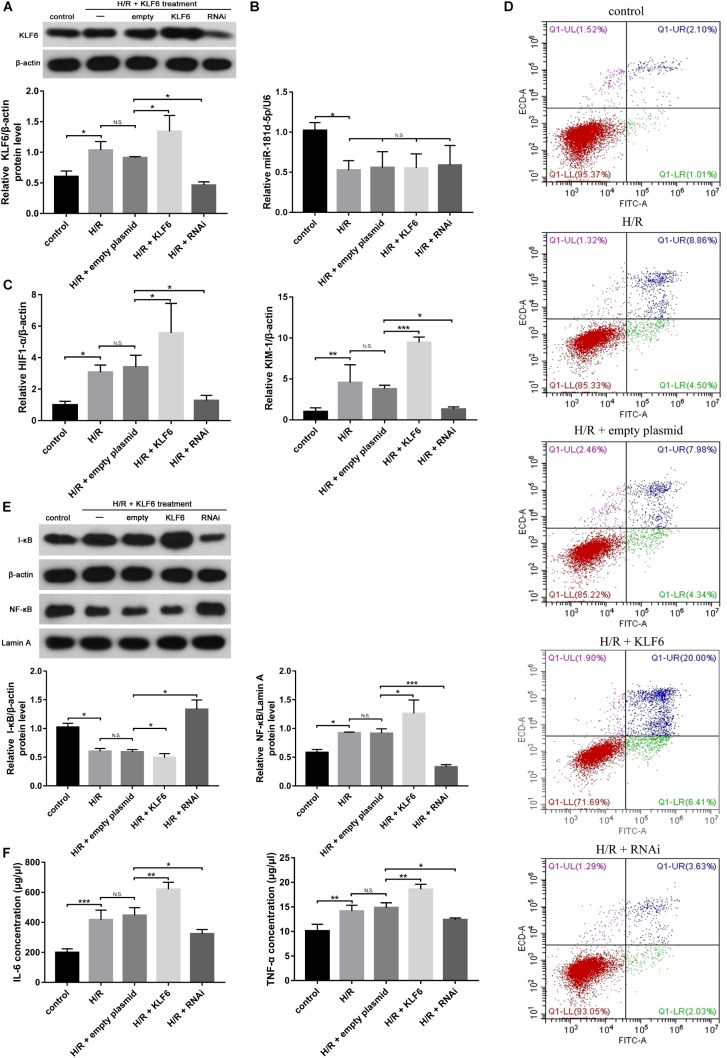
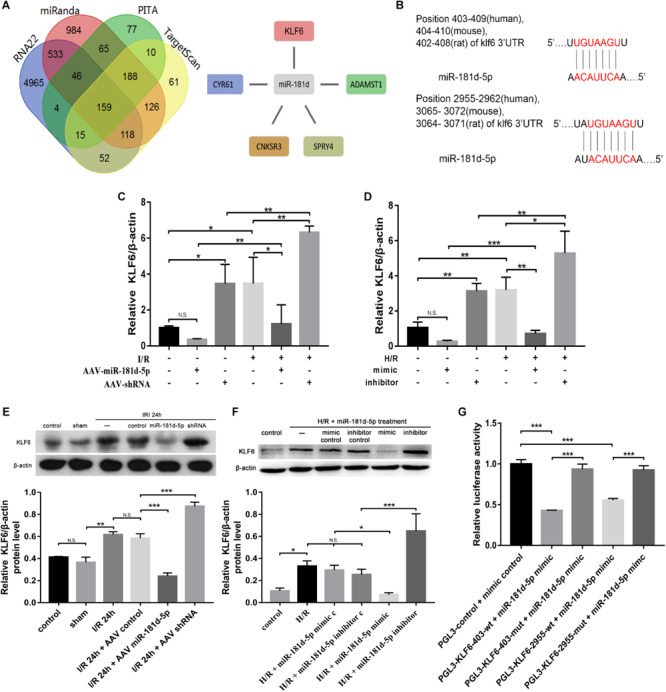
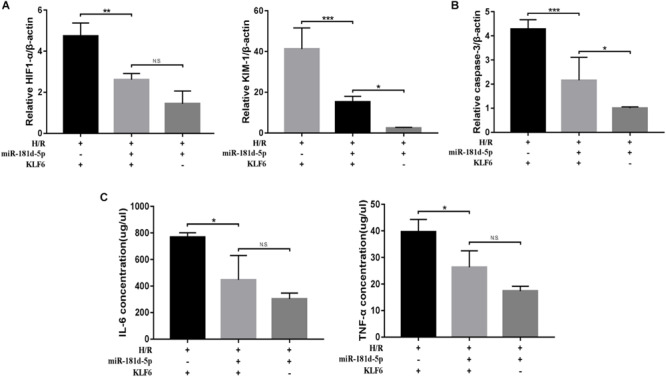
Renal tubular epithelial cell (RTEC) death and renal interstitial inflammation are the most crucial pathophysiological changes in acute kidney ischemia/reperfusion injury (IRI). The microRNA (miR)-181d family plays diverse roles in cell proliferation, apoptosis and inflammation, but its renal target and potential role in IRI are unknown. Here, we showed that the expression of miR-181d-5p decreased and Krueppel-like factor 6 (KLF6) increased in a renal cell (HK-2) model of hypoxia/reoxygenation (H/R) injury and a mouse model of renal IRI. They were mainly distributed in the renal tubules. After renal IRI, miR-181d-5p overexpression significantly inhibited inflammatory mediators, reduced apoptosis and further improved renal function. KLF6 exacerbated RTEC damage and acted as a NF-κB co-activator to aggravate the renal IRI inflammatory response. Mechanistically, KLF6 was predicted as a new potential target gene of miR-181d-5p through bioinformatic analysis and luciferase reporter assay verification. After overexpressing miR-181d-5p and inhibiting KLF6, the role of miR-181d-5p was weakened on the renal damage improvement. In conclusion, miR-181d-5p upregulation produced protective antiapoptotic and anti-inflammatory effects against IRI in kidneys in vivo and H/R injury in HK-2 cells in vitro, and these effects were achieved by targeted inhibition of KLF6. Thus, our results provide novel insights into the molecular mechanisms associated with IRI and a potential novel therapeutic target.

Keywords: IRI; KLF6; MiR-181d-5p; apoptosis; inflammation; renal function.


Figures

FIGURE 1
FIGURE 1
Expression and localization of miR-181d-5p during renal IRI in vivo and hypoxia in vitro. (A) Total RNA samples were extracted from various tissues of C57BL/6 mice. MiRNAs were reverse transcribed using miR-181d-5p and U6 RNA-specific primers, and qRT-PCR was performed as described in the section “Materials and Methods.” The relative expression of mature miR-181d-5p was normalized to that of U6 RNA (n = 4 per group). (B) The localization of miR-181d-5p in the mouse kidney after IRI (45 min of bilateral renal ischemia followed by 24 h of reperfusion) was assessed by in situ hybridization. Paraffin-fixed mouse kidney sections were hybridized with the digoxigenin-labeled miR-181d-5p fluorescent probe (red), and nuclei were stained with DAP1 (blue). Scale bar, 500 μm. (I: control; II: sham; III: I/R; IV: I/R+AAV-control; V: I/R+AAV-miR-181d-5p; VI: IRI+AAV-shRNA.) (C) Time course of the miR-1R1d-5p expression levels in mouse kidneys. Tissues were harvested at different time points after the bilateral renal pedicle was clamped for 45 min (n = 4 or 5 per group). (D) Time course of the miR-181d-5p expression levels in vitro. MiR-181d-5p induction was assessed in cultured HK-2 cells subjected to H/R. HK-2 cells were incubated under normoxia or hypoxia (1% oxygen) for 0–48 h and subsequently reoxygenated for 3 h. Total RNA samples were extracted for RT-PCR, showing significant induction of miR-181d-5p after treatment with hypoxia for 24 h/reoxygenation for 3 h (n = 5 per group). (E,F) Quantitative analysis of miR-181d-5p expression in mice kidneys and HK-2 cells treated with or without miR-181d-5p AAV constructs (n = 5 per group) The data are presented as the means ± SDs. and #, P < 0.05; ∗∗ and ##, P < 0.01; ∗∗∗ and ###, P < 0.001.
FIGURE 2
FIGURE 2
MiR-181d-5p improved kidney function in mice with renal IRI and in RTECs. C57BL/6 mice were injected with AAVs and, 3 weeks later, were subjected to 45 min of bilateral renal ischemia followed by 24 h of reperfusion. HK-2 cells were transfected with 100 nM miR-181d-5p mimic, 150 nM miR-181d-5p inhibitor or scrambled oligonucleotides and, 72 h later, were incubated in normoxia (control) or treated with hypoxia (1% oxygen) for 24 h/reoxygenation for 3 h. (A) Serum creatinine and BUN levels were assessed in mice with or without miR-181d-5p infusion after IRI (n = 6 per group). (B) Pathological score of renal tubular injury in mice infused with or without miR-181d-5p, as assessed using hematoxylin and eosin staining. Paraffin sections were stained with hematoxylin and eosin. Scale bar, 200 μm (I: control; II: sham; III: I/R; IV: I/R+AAV-control; V: I/R+AAV-miR-1818d-5p; VI: IRI+AAV-shRNA.) (C) qRT-PCR was performed for KIM-1 as described in the section “Materials and Methods.” The relative expression of KIM-1 was normalized to that of β-actin (n = 5 per group). (D) The relative mRNA expression levels of KIM-1 and HIF-1α in HK-2 cells were normalized to the β-actin expression level (n = 5 per group). The data are presented as the means ± SDs. *P < 0.05, **P < 0.01, ***P < 0.001.
FIGURE 3
FIGURE 3
MiR-181d-5p decreased RTEC apoptosis during IRI in mice and H/R in HK-2 cells. (A) Apoptotic kidney cells in mice infused with or without miR-181d-5p, as assessed using TUNEL. TUNEL of representative kidney sections from each experimental group is shown. Colocalization of blue and brown staining in nuclei indicates apoptotic cells, which are indicated with arrows. Scale bar. 100 mm. (I: control; II: sham; III: I/R; IV: I/R+AAV-control; V: I/R+AAV-miR-181d-5p; VI: IRI+AAV-shRNA). Proportions of TUNEL-positive nuclei to total nuclei in renal epithelial cells of mice are shown (n = 3 per group). (B,C) qRT-PCR was used to detect caspase-3 in mouse tissues and HK-2 cells as described in the section “Materials and Methods.” The relative expression of caspase-3 was normalized to that of β-actin (n = 5 per group). (D) Flow cytometric analysis of Annexin V/PI staining showed that hsa-miR-181d-5p decreased the level of programmed cell apoptosis in miR-181d-5p-treated HK2 cells. The data are presented as the means-SDs. *P < 0.05, **P < 0.01, ***P < 0.001.
FIGURE 4
FIGURE 4
MiR-181d-5p reduced inflammation-related gene expression in mice with IRI and HK-2 cells subjected to H/R. (A,C) MiR-181d-5p decreased NF-KB expression and increased I-KB expression in HK-2 cells subjected to H/R and mice subjected to I/R that were transfected with miR-181d-5p. The protein expression are shown from Western blot analysis. β-Actin and Lamin-A were used as internal controls for I-KB and NF-KB, respectively (n = 3 per group). (B) Western blot analysis of IL-6 and TNF-α in damaged kidneys of mice treated with different miR-181d-5p constructs (n = 3 per group). (D) ELISAs were used to measure IL-6 and TNF-α levels in the cell supernatant. The data are presented as the means ± SDs (n = 4 or 5 per group). *P < 0.05, **P < 0.01, ***P < 0.001.
FIGURE 5
FIGURE 5
KLF6 expression in IRI and its biological function were predicted by bioinformatic analysis and verified experimentally. (A,B) Volcano plot illustrating the differentially expressed proteins identified by quantitative analysis. The –log10 (P-value) was plotted against the log2 (IR/Control) ratio. The red dots represent proteins with dysregulated expression in IR samples, and the blue dots indicate KLF6 upregulation in IR samples. (C,D) GSEA of microarray data showing enrichment plots and beat maps for sets of genes in the GSE58438 dataset involved in cell activation, leukocyte activation. (C) Enrichment plot for the cell activation gene set. Heat map of the core enriched genes in the cell activation gene set. (D) Enrichment plot for the leukocyte activation gene set. Heat map of the core enriched genes involved in leukocyte activation. In the enrichment plot, a positive enrichment score (ES; red part of the horizontal bar) indicates gene set enrichment at the top of the ranked list. A negative ES (blue part of the horizontal bar) indicates gene set enrichment at the bottom of the ranked list The middle part of the plot shows the positions of the genes in the gene ranking list. The bottom portion or the plot shows the value of the ranking metric with decreasing rank. Heat map of correlation values for all individual genes within the gene set. The colors and shades indicate the direction and magnitude of correlation. The red boxes indicates a positive correlation with IRI, and the blue boxes indicates a negative correlation with IRI. Darker shades correspond to larger correlation values. The set of genes with the greatest contribution to the ES, i.e., the leading edge subset of genes, is enclosed in a box in both the enrichment plot and the heat map. (E,F) Time course of the expression levels of KLF6 in mouse kidneys and HK-2 cells. Tissues were harvested at different time points after the bilateral renal pedicle was clamped for 45 min. In vitro, total RNA samples were extracted for RT-PCR, showing significant induction of KLF6 alter hypoxia for 24 h/reoxygenation for 3 h (n = 5 per group). (G) The localization of KLF6 in the mouse kidney after IRI (45 min of bilateral renal ischemia followed by 24 h of reperfusion) was detected by immunohistochemistry. Positive staining of formalin-fixed, paraffin-embedded mouse kidney sections is indicated by the yellow–brown color. Scale bar, 200 μm. (I: control; II: sham; III: AAV-miR-181d-5p; IV: AAV-shRNA; V: I/R; VI: I/R+AAV-control; VII: I/R+AAV-miR-181d-5p; VIM: IRI+AAV-shRNA.) The data arc presented as the means ± SDs. *P < 0.05, **P < 0.01, ***P < 0.001.
FIGURE 6
FIGURE 6
KLF6 overexpression exacerbated the hypoxia-induced decline in renal function, renal tubular cell apoptosis, and inflammatory response. HK-2 cells were transfected with KLF6 plasmid and KLF6 shRNA plasmid or scrambled plasmid with Lipofectamine 3000 and, 72 h later, were incubated in normoxia (control) or treated with hypoxia (1% oxygen) for 24 h/reoxygenation for 3 h. (A) KLF6 protein expression in HK-2 cells treated with or without KLF6 (n = 3 per group). (B,C) qRT-PCR was used to measure miR-181d-5p, KIM-1 and HIF1-α levels after KLF6 transfection (n = 5 per group). (D) Annexin V-FITC/PI double staining was utilized to evaluate apoptosis after KLF6 transfection. This experiment was repeated three times. (E) KLF6 increased NF-KB expression. HK-2 cells were transfected with or without the KLF6 plasmid. The results shown are from Western blot analysis of NF-KB and I-KB.β-Actin and Lamin-A were used as internal controls for I-KB and NF-KB, respectively (n = 3 per group). (F) ELISAs were used to measure 1L-6 and TNF-α expression levels in the cell supernatant (n = 3 per group). The data are presented as the means ± SDs. *P < 0.05, **P < 0.01, ***P < 0.001.
FIGURE 7
FIGURE 7
Overexpression of miR-181d-5p inhibited KLF6 expression. (A) The four regions indicate the numbers of miRNA-181d target genes obtained via different software packages. The intersecting regions indicate that multiple software packages predicted the same numbers of target genes. The expression of five miRKA-181d target genes (CYR61, CNKSR3, SPRY4, KLF6, ADAMTSI) was increased in AKI (FDR < 0.05, expression level change > 2-fold). (B) Schematic representation of the putative miR-181d-5p target sites in the 3’UTR of mouse, rat, and human KLF6. (C,E) qRT-PCR and Western blot analyses of KLF6 in mice, mRNA and protein were extracted from kidney cortical tissues for analysis of KLF6, B-Actin was used as the reference gene. For quantification, the KLF6 bands were analyzed by densitometry, and the band densities were expressed as the ratios to β-actin (C: n = 5 per group; E: n = 3 per group). (D,F) qRT-PCR and Western blot analyses of KLF6 expression in HK-2 cells. Cells were transfected with the miR-181d-5p mimic or miR-181d-5p inhibitor, and the miR-181d-5p mimic control or miR-181d-5p inhibitor control was used as the respective control. Whole-cell lysates were collected for analysis after transfection for 72 h and treatment with hypoxia for 24 h/reoxygenation for 3 h (D: n = 5 per group; F: n = 3 per group). (G) KLF6 3’UTR activity assay. EGFP-miR-181d-5p and RFP-KLF6 3’UTR plasmids containing fluorescent constructs were co-transfected into 293T cells with or without scrambled or mutant plasmids. The fluorescence intensity was determined 48 h after transfection. The ratio of the normalized sensor fluorescence intensity to the control fluorescence intensity is shown (n = 3 per group). The data are presented as the means ± SDs, *P < 0.05, **P < 0.01, ***P < 0.001.
FIGURE 8
FIGURE 8
MiR-181d-5p targets KLF6 to ameliorate H/R injury. HK-2 cells were co-transfected with the KLF6 plasmid and miR-181d-5p mimic with Lipofectamine 3000 and, 72 h later, were treated with hypoxia (l% oxygen) for 24 h/reoxygenation for 3 h. (A,B) Quantitative analysis of HIF1-α, KIM-1, and caspase-3 expression in HK-2 cells treated with or without miR-181d-5p and KLF6 (n = 4 or 5 per group). (C) ELISAs were used to measure 1L-6 and TNF-α expression levels in the cell supernatant (n = 4 per group). The data are presented as the means ± SDs. P < 0.05, ∗∗P < 0.01, ∗∗∗P < 0.001.

References

    1. Baker M. A., Davis S. J., Liu P., Pan X., Williams A. M., Iczkowski K. A., et al. (2017). Tissue-specific microRNA expression patterns in four types of kidney disease. J. Am. Soc. Nephrol. 28 2985–2992. 10.1681/ASN.2016121280 - DOI - PMC - PubMed
    1. Barnes P. J. (1997). Nuclear factor-kappa B. Int. J. Biochem. Cell Biol. 29 867–870. - PubMed
    1. Belkaya S., van Oers N. S. C. (2014). Transgenic expression of microRNA-181d augments the stress-sensitivity of CD4(+)CD8(+) thymocytes. PLoS One 9:e85274. 10.1371/journal.pone.0085274 - DOI - PMC - PubMed
    1. Bhatt K., Wei Q., Pabla N., Dong G., Mi Q.-S., Liang M., et al. (2015). MicroRNA-687 induced by hypoxia-inducible factor-1 targets phosphatase and tensin homolog in renal ischemia-reperfusion injury. J. Am. Soc. Nephrol. 26 1588–1596. 10.1681/ASN.2014050463 - DOI - PMC - PubMed
    1. Bienz M., Clevers H. (2000). Linking colorectal cancer to Wnt signaling. Cell 103 311–320. 10.1016/s0092-8674(00)00122-7 - DOI - PubMed

LinkOut - more resources