Review
. 2020 Jun 9:11:544.
doi: 10.3389/fphys.2020.00544. eCollection 2020.

Theoretical Bases for the Role of Red Blood Cell Shape in the Regulation of Its Volume

Affiliations
Review

Theoretical Bases for the Role of Red Blood Cell Shape in the Regulation of Its Volume

Saša Svetina. Front Physiol. .

Abstract

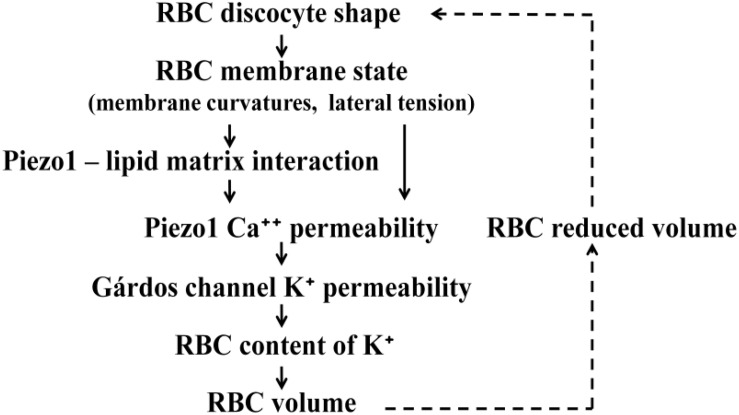
The red blood cell (RBC) membrane contains a mechanosensitive cation channel Piezo1 that is involved in RBC volume homeostasis. In a recent model of the mechanism of its action it was proposed that Piezo1 cation permeability responds to changes of the RBC shape. The aim here is to review in a descriptive manner different previous studies of RBC behavior that formed the basis for this proposal. These studies include the interpretation of RBC and vesicle shapes based on the minimization of membrane bending energy, the analyses of various consequences of compositional and structural features of RBC membrane, in particular of its membrane skeleton and its integral membrane proteins, and the modeling of the establishment of RBC volume. The proposed model of Piezo1 action is critically evaluated, and a perspective presented for solving some remaining experimental and theoretical problems. Part of the discussion is devoted to the usefulness of theoretical modeling in studies of the behavior of cell systems in general.

Keywords: Gárdos channel; Piezo1; cell to cell variability; curvature dependent protein–membrane interaction; mechanosensitivity; negative feedback loop; osmotic fragility; spectrin skeleton.


Figures

FIGURE 1
FIGURE 1
Demonstration of basic features of the bilayer couple theories of vesicle shapes [(A–C) of “strict” and (D) of “generalized”]. (A) va) dependences of limiting shapes which correspond to the extreme values of v at a given value of Δa (lines 1 to 8) plotted in the v – Δa shape phase diagram (Svetina and Žekš, 1989). Examples of corresponding shape cross-section are also shown. The dotted horizontal line at v = 0.6 indicates the range of Δa values for which minimal membrane bending energy is presented in (C). Red point indicates the phase diagram location of a discocyte and red triangle of a characteristic stomatocyte. (B) Stable vesicle shapes in the central part of the v – Δa shape phase diagram. Lines 9–12 are symmetry breaking lines. Marked areas represent the parts of the shape phase diagram where there are no contacts between different regions of the membrane. The meaning of red points is the same as in (A). (C) Membrane bending energy wb (defined relative to the bending energy of the sphere which is 8πkc) calculated at v = 0.6 for the Δa values indicated by the dotted line in (A). Line S shows bending energy of disk shapes and line A of the cup shapes. The arrow indicates the point of the symmetry breaking of the disk shape as predicted by Svetina and Žekš (1989). Shown are also contours of cross-sections of a discocyte (red point) and a stomatocyte (red triangle) and it is indicated which are their Δa values. (D) The dependence of the partial derivatives of the bending energies S and A presented in (C) by the area difference Δa. The dotted lines present the right hand side of Eq. 4 for the indicated values of Δa0 and kr/kc = 3 (reprinted with permission from Svetina, 1998).
FIGURE 2
FIGURE 2
Deformation of RBC skeleton. (A) Experimental evidence for the deformation of the membrane skeleton when RBC ghost is aspirated into a medium size pipette (Rp ≈ 2 μm) (from Discher et al., 1994; reprinted with permission from AAAS). The skeleton density profiles along the projection of four aspirated RBC ghosts are shown, obtained by measuring fluorescein-phalloidin-labeled actin. Relevant for the present discussion is the decrease of the intensity along the aspirated part of the ghosts (arrows). (B) Skeleton extension ratios along parallels λp (dashed) and along meridians λm (dots) and the density 1/λpλm (relative to its mean value; full line) calculated according to the described model (Svetina et al., 2016) for the RBC aspirated into medium size pipette (A) (reprinted with permission from Švelc and Svetina, 2012). The pipette is on the right. The initial shape with, presumably, homogeneous skeleton distribution is a discocyte.
FIGURE 3
FIGURE 3
Illustrations of effects of protein–membrane interaction. (A) The shape of the Piezo1 membrane footprint shown as the cross-section of the mid-bilayer surface and its intersection with the Piezo1 dome; scale bar: 4 nm (reprinted from Haselwandter and MacKinnon, 2018, held under CC-BY 4.0 license). (B) The sum of the membrane bending energy and the distributional free energy of mobile membrane inclusions calculated for the disk shape and for the shape that involves two buds for a cell with the reduced volume 0.6 in the dependence of the number of inclusions p (in some reduced units) (reprinted with permission from Svetina et al., 1996).
FIGURE 4
FIGURE 4
Illustrations of consequences of the correlation between RBC area (A) and volume (V). (A) Coefficient of variation of RBC reduced volume (CVv) in dependence on the correlation coefficient ρA,V obtained for the values of coefficients of variations of RBC volume and membrane area to be 0.12 and 0.13, respectively (reprinted with permission from Svetina et al., 2019). CVv at ρA,V = 0.96 is about 0.06. (B) Evidence for the role of Piezo1 based regulation of RBC volume on the mouse RBC VA correlation. Cahalan et al. (2015) measured osmotic fragility of normal (WT) and of Piezo1 knocked out (Vav1-PicKO) mouse RBC in the absence (+Veh) and presence (+A23187) of Ca2+ ionophore A23187 (reprinted with permission from Svetina et al., 2019). In Figure 5 of Svetina et al. (2019) we added to Figure 3D of Cahalan et al. (2015) the column of the corresponding coefficients of variation (CVh) obtained from steepness of osmotic fragility curves as indicated by red dashed lines.
FIGURE 5
FIGURE 5
Schematic presentation of processes involved in the effect of RBC discocyte shape on RBC volume. The meanings of the links are described in the text. Because the volume affects the shape (dashed links) the described system as a whole represents a closed regulatory loop. It is indicated that Piezo1 Ca++ permeability can be affected either by membrane curvature or membrane lateral tension.

Similar articles

Cited by

References

    1. Armstrong C. M. (2003). The Na/K pump, Cl ion, and osmotic stabilization of cells. Proc. Natl. Acad. Sci. U.S.A. 100 6257–6262. 10.1073/pnas.0931278100 - DOI - PMC - PubMed
    1. Ataullakhanov F. I., Korunova N. O., Spiridonov I. S., Pivovarov I. O., Kalyagina N. V., Martinov M. V. (2009). How erythrocyte volume is regulated, or what mathematical models can and cannot do for biology. Biochem. Mosc. Suppl. Ser. A Membr. Cell Biol. 3 101–115. 10.1134/s1990747809020019 - DOI
    1. Božič B., Kralj-Iglič V., Svetina S. (2006). Coupling between vesicle shape and lateral distribution of mobile membrane inclusions. Phys. Rev. E 73:041915. - PubMed
    1. Brumen M., Glaser R., Svetina S. (1979). Osmotic states of red blood cells. Bioelectrochem. Bioenerget. 6 227–241. 10.1016/0302-4598(79)87010-5 - DOI
    1. Brumen M., Glaser R., Svetina S. (1981). Study of the red blood cell osmotic behaviour in the “pump-leak” model. Period. Biol. 83 151–153.

LinkOut - more resources