. 2020 Jun 9:11:625.
doi: 10.3389/fphys.2020.00625. eCollection 2020.

Deficiency of the Immunoproteasome LMP10 Subunit Attenuates Angiotensin II-Induced Cardiac Hypertrophic Remodeling via Autophagic Degradation of gp130 and IGF1R

Affiliations

Deficiency of the Immunoproteasome LMP10 Subunit Attenuates Angiotensin II-Induced Cardiac Hypertrophic Remodeling via Autophagic Degradation of gp130 and IGF1R

Wen Yan et al. Front Physiol. .

Abstract

Background/aim: Hypertensive cardiac hypertrophy is the leading cause of cardiac remodeling and heart failure. We recently demonstrated that the immunoproteasome, an inducible form of the constitutive proteasome, plays a critical role in regulating cardiovascular diseases. However, the role of the immunoproteasome LMP10 (β2i) catalytic subunit in the regulation of angiotensin II (Ang II)-induced cardiac hypertrophic remodeling remains unclear.

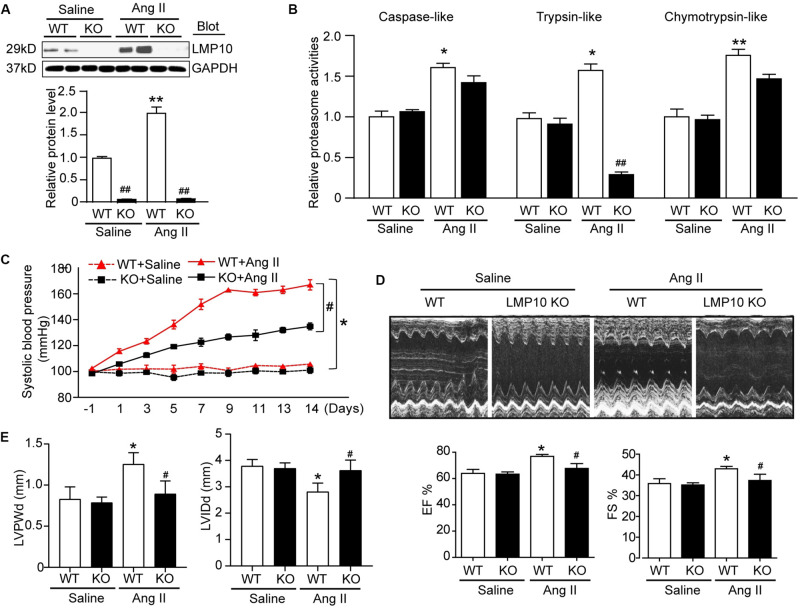
Methods: Wild-type (WT) and LMP10 knockout (KO) mice were infused with Ang II 1,000 ng/kg/min for 2 weeks. Blood pressure was measured using a tail-cuff system. Cardiac function and hypertrophic remodeling were examined by echocardiography and histological staining. The expression levels of genes and proteins were examined with quantitative real-time PCR and immunoblotting analysis, respectively.

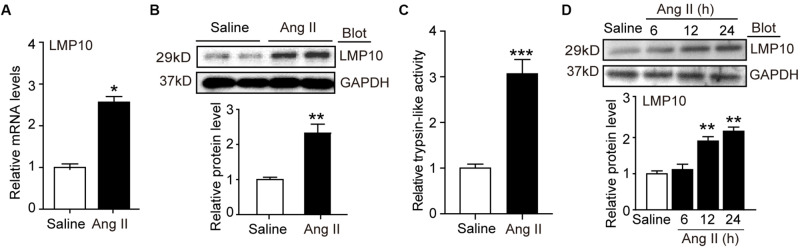
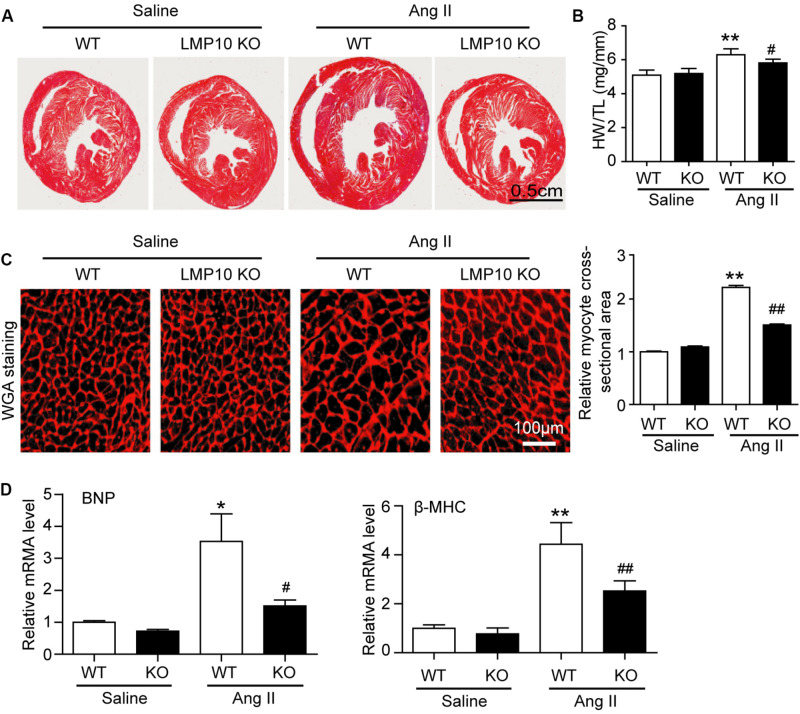
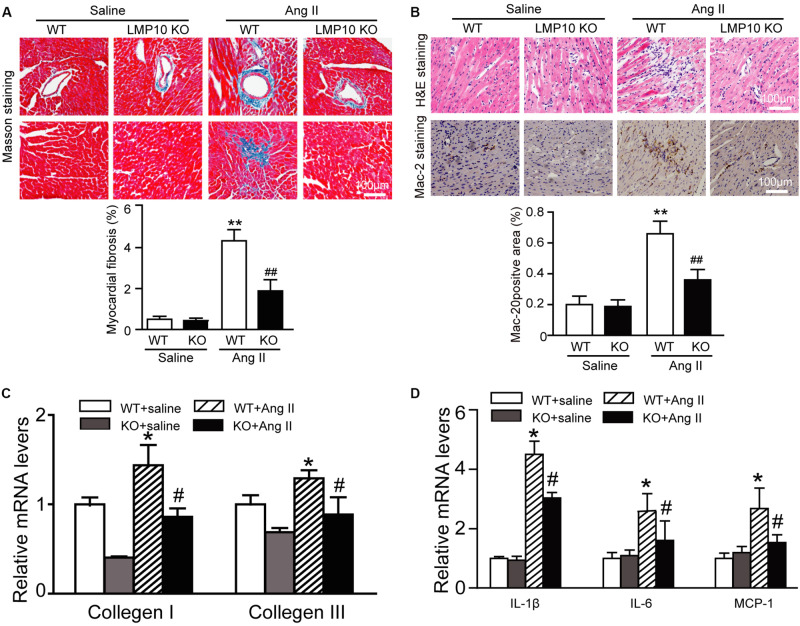
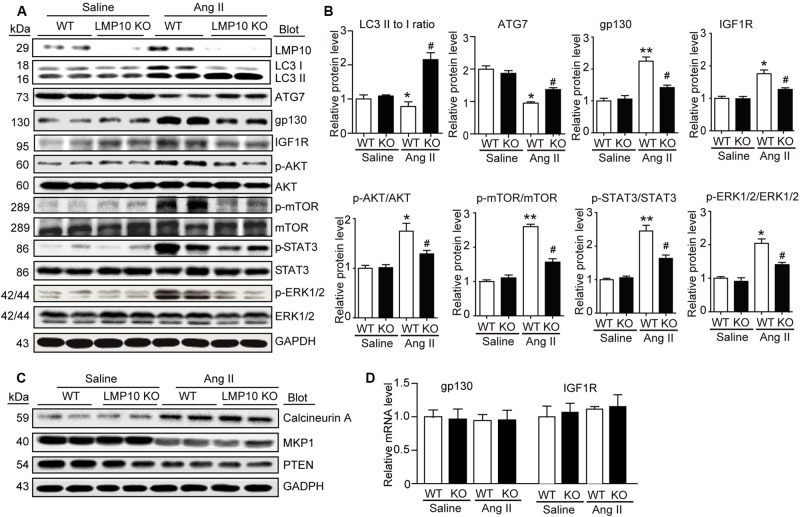
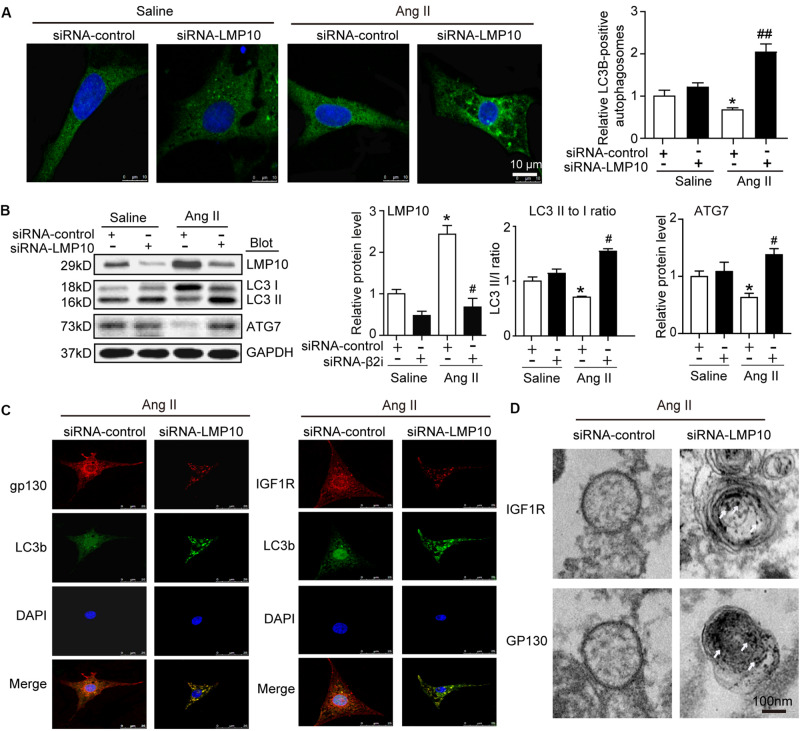
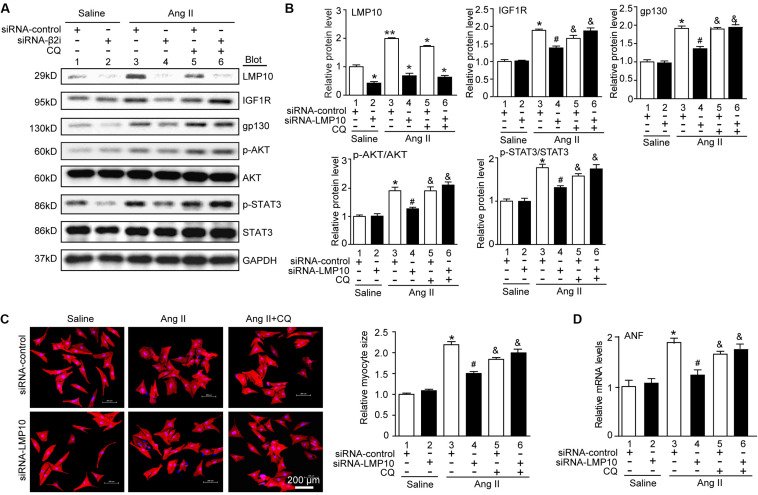
Results: LMP10 mRNA and protein expression was significantly increased in Ang II-stimulated hearts and primary cardiomyocytes. Moreover, Ang II infusion for 2 weeks increased systolic blood pressure, abnormal cardiac function, hypertrophy, fibrosis, and inflammation in WT mice, which were significantly reversed in KO mice. Moreover, a marked reduction in the protein levels of insulin growth factor-1 receptor (IGF1R), glycoprotein 130 (gp130), and phosphorylated AKT, mTOR, STAT3, and ERK1/2 and an increase in the LC3II/I ratio were also observed in LMP10 KO mice compared with WT mice after Ang II infusion. In vitro culture experiments confirmed that LMP10 knockdown activated autophagy and increased IGF1R and gp130 degradation, leading to the inhibition of cardiomyocyte hypertrophy. However, inhibiting autophagy with chloroquine reversed this effect.

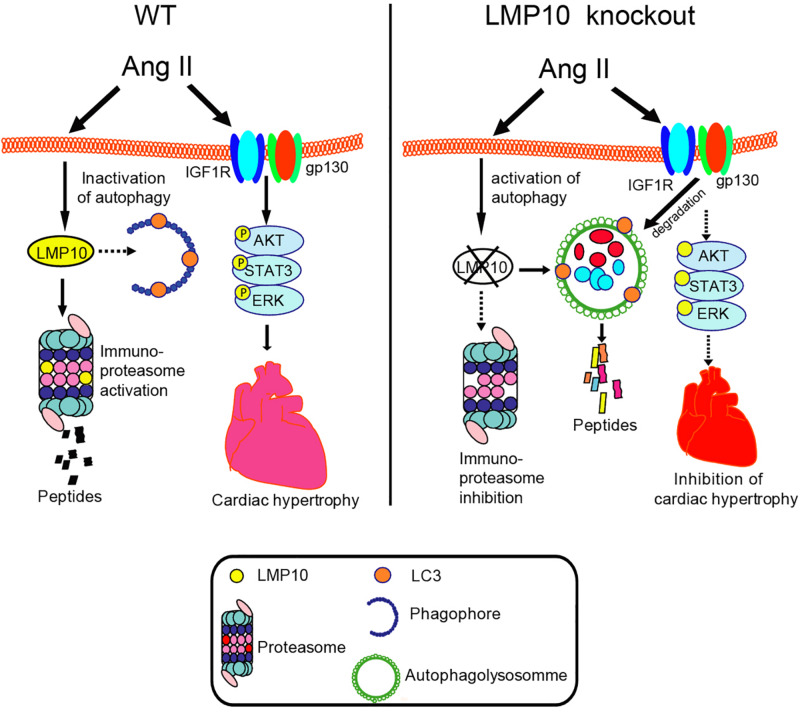
Conclusion: The results of this study indicate that LMP10 KO attenuates Ang II-induced cardiac hypertrophic remodeling via the autophagy-dependent degradation of IGF1R and gp130, and suggests that LMP10 may be a novel therapeutic target for hypertrophic heart diseases.

Keywords: ATG7; IGF1R; LMP10; autophagy; cardiac hypertrophy; gp130; immunoproteasome subunit.


Figures

FIGURE 1
FIGURE 1
LMP10 was upregulated in Ang II-treated hearts and cardiomyocytes. (A) Wild-type (WT) mice were infused with angiotensin II (Ang II) at dose of 1,000 ng/kg/min for 2 weeks. qPCR analysis of LMP10 mRNA expression in Ang II-infused mouse hearts (n = 6). (B) Immunoblotting analyses of LMP10 protein levels in the hearts after Ang II infusion (upper). Quantification of the relative protein level (lower; n = 4). (C) Measurement of proteasome trypsin-like activity in Ang II-infused mouse hearts (n = 6). (D) Immunoblotting analyses of LMP10 protein levels in neonatal rat cardiomyocytes (NRCMs) exposed to Ang II (100 nM) at different time points (upper; h: hour). Quantification of the relative protein level (lower; n = 3 independent experiments). Data are presented as mean ± SEM, and n represents number of samples per group. *P < 0.05; **P < 0.01 versus saline; ***P < 0.001 versus saline.
FIGURE 2
FIGURE 2
Knockdown of LMP10 ameliorates cardiac function in mice after Ang II infusion. Wild-type (WT) or LMP10 knockout (KO) mice were infused with angiotensin II (Ang II) at dose of 1,000 ng/kg/min for 2 weeks. (A) Immunoblotting analyses of LMP10 protein levels in the hearts (upper). Quantification of the relative protein level (lower; n = 6). (B) Measurement of proteasome caspase-like, trypsin-like, and chymotrypsin-like activities in the hearts (n = 6). (C) Representative M-mode echocardiography of left ventricular chamber. (D) Assessment of left ventricular ejection fraction (EF%) and fractional shortening (FS%) (n = 8). (E) Measurement of left ventricular inner diameter at end-diastole (LVIDd) and left ventricular posterior wall thickness at end-diastole (LVPWd) (n = 8). Data are presented as mean ± SEM, and n represents number of animals per group. *P < 0.05, **P < 0.01 versus saline; #P < 0.05, ##P < 0.01 versus WT + Ang II.
FIGURE 3
FIGURE 3
Deficiency of LMP10 attenuates Ang II-induced cardiac hypertrophy in mice. (A) Wild-type (WT) or LMP10 knockout (KO) mice were infused with angiotensin II (Ang II) at dose of 1,000 ng/kg/min for 2 weeks. Representative images of Hematoxylin and eosin (H&E) staining of the heart sections (lower). Scale bar 0.5 cm. (B) The ratios of heart weight to body weight (HW/BW) and heart weight to tibia length (HW/TL) (n = 6 per group). (C) TRITC-WGA staining of cardiac myocytes (left). Scale bar 100 μm. Quantification of the relative myocyte cross-sectional area (150–200 cells counted per heart, right) (n = 6 per group). (D) qPCR analyses of BNP and β-MHC mRNA levels in the hearts. Results are normalized to the GAPDH level (n = 6 per group). Data are presented as mean ± SEM, and n represents number of animals per group. *P < 0.05, **P < 0.01 versus saline; #P < 0.05, ##P < 0.01 versus WT + Ang II.
FIGURE 4
FIGURE 4
Deficiency of LMP10 attenuates Ang II-induced cardiac hypertrophy in mice. (A) Wild-type (WT) or LMP10 knockout (KO) mice were infused with angiotensin II (Ang II) at dose of 1,000 ng/kg/min for 2 weeks. Masson’s Trichrome staining of cardiac perivascular and interstitial fibrosis detected by (upper). Scale bar 100 μm. Quantification of the relative fibrosis area (lower, n = 6). (B) Hematoxylin and eosin (H&E) staining of the heart sections (upper). Immunochemical staining of heart sections with anti-Mac-2 antibody (middle). Scale bar 100 μm. Quantification of Mac-2-positive area (lower) (n = 6 per group). (C) qPCR analyses of collagen I and collagen III mRNA levels (n = 6). (D) qPCR analyses of IL-1β, IL-6 and MCP-1 mRNA levels (n = 6). The data are normalized to the GAPDH level. Data are presented as mean (SEM, and n represents number of animals per group. *P < 0.05, **P < 0.01 versus saline; #P < 0.05, ##P < 0.01 versus WT + Ang II.
FIGURE 5
FIGURE 5
Deficiency of LMP10 reduces protein levels of IGF1R and gp130 and activation of the downstream mediators in Ang II-infused hearts. (A) Wild-type (WT) or LMP10 knockout (KO) mice were infused with angiotensin II (Ang II) at dose of 1,000 ng/kg/min for 2 weeks. Immunoblotting analyses of LMP10, LC3 II/I, ATG7, IGF1R, gp130, AKT, p-AKT, mTOR, p-mTOR, STAT3, p-STAT3, ERK1/2, and p-ERK1/2 protein levels in the heart tissues (left). (B) Quantification of the relative protein level (n = 4, right). (C) Immunoblotting analyses of calcineurin A, PTEN, and MKP-1 protein levels in the heart tissues. (D) qPCR analyses of IGF1R and gp130 mRNA levels (n = 6). The data are normalized to the GAPDH level. Data are expressed as the mean ± SEM. *P < 0.05, **P < 0.01 versus saline. #P < 0.05 versus WT + Ang II.
FIGURE 6
FIGURE 6
Knockdown of LMP10 increases autophagy and localization of IGF1R and gp130 in autophagosomes in cultured cardiomyocytes. Neonatal rat cardiomyocytes (NRCMs) were transfected with siRNA-LMP10 or siRNA-control for 24 h and then exposed to Ang II (100 nM) for 48 h. (A) Immunofluorescence staining of autophagosomes with anti-LC3B (green, left). DAPI staining for nuclei (blue). Quantification of LC3B-positive fluorescent dots (n = 10–12 cells per group, right). (B) Immunoblotting analysis of LC3 (upper) and ATG7 (middle). The ratios of LC3-II to LC3-I and quantitation of ATG7 protein level (n = 3 independent experiments). (C) Immunofluorescence staining for IGF1R or gp130 (red), and LC3B (green). DAPI staining for nuclei (blue) in NRCMs after Ang II. The data are normalized to the GAPDH level. (D) IGF1R and gp130 were respectively labeled using anti-IGF1R or gp130 antibody and the secondary antibody coupled to gold beads. Electron microscopic examination of EGFR and IGF1R in autophagosomes in NRCMs after Ang II. White arrows indicate IGF1R or GP130-positive particles. Data are expressed as the mean ± SEM. *P < 0.05 versus saline. #P < 0.05, ##P < 0.01 versus WT + Ang II.
FIGURE 7
FIGURE 7
Knockdown of LMP10 inhibits cardiomyocyte hypertrophy through autophagic degradation of IGF1R and gp130 in vitro. (A) Immunoblotting analysis of protein levels of LMP10, IGF1R, gp130, p-AKT, AKT, p-STAT3, and STAT3 (n = 3). The data are normalized to the GAPDH level. (B) Quantification of the relative protein level (n = 4, right). (C) Neonatal rat cardiomyocytes (NRCMs) were transfected with siRNA-LMP10 or siRNA-control for 24 hours and then exposed to Ang II (100 nM) for 48 hours. Double immunostaining (red: α-actinin for cardiomyocytes; blue: DAPI for nuclei) of cardiomyocytes for measurement of cell size. Quantification of cardiomyocyte surface area (right, 150 cells counted per experiment, n = 3). Scale bar, 50 μm. (D) qPCR analysis of ANF mRNA expression (n = 3 independent experiments). Data are presented as means ± SEM. *P < 0.05 versus siRNA-control + saline; #P < 0.05 versus siRNA-control + Ang II; &P < 0.05 versus siRNA-control + Ang II.
FIGURE 8
FIGURE 8
The summarized diagram showing that the proposed mechanisms underlying LMP10 regulate cardiac hypertrophy. Upon Ang II stimulation, upregulation of LMP10 inhibits autophagy activation, which then increases protein levels of IGF1R and gp130 and activation of the downstream mediators leading to cardiac hypertrophy. Conversely, LMP10 KO attenuates these effects.

Similar articles

Cited by

References

    1. Angeles A., Fung G., Luo H. (2012). Immune and non-immune functions of the immunoproteasome. Front. Biosci. 17 1904–1916. 10.2741/4027 - DOI - PubMed
    1. Bhuiyan M. S., Pattison J. S., Osinska H., James J., Gulick J., McLendon P. M., et al. (2013). Enhanced autophagy ameliorates cardiac proteinopathy. J. Clin. Invest. 123 5284–5297. 10.1172/JCI70877 - DOI - PMC - PubMed
    1. Chen C., Zou L. X., Lin Q. Y., Yan X., Bi H. L., Xie X., et al. (2019). Resveratrol as a new inhibitor of immunoproteasome prevents PTEN degradation and attenuates cardiac hypertrophy after pressure overload. Redox Biol. 20 390–401. 10.1016/j.redox.2018.10.021 - DOI - PMC - PubMed
    1. Ding W. X., Ni H. M., Gao W., Yoshimori T., Stolz D. B., Ron D., et al. (2007). Linking of autophagy to ubiquitin-proteasome system is important for the regulation of endoplasmic reticulum stress and cell viability. Am. J. Pathol. 171 513–524. 10.2353/ajpath.2007.070188 - DOI - PMC - PubMed
    1. Eisenberg T., Abdellatif M., Schroeder S., Primessnig U., Stekovic S., Pendl T., et al. (2016). Cardioprotection and lifespan extension by the natural polyamine spermidine. Nat. Med. 22 1428–1438. 10.1038/nm.4222 - DOI - PMC - PubMed