. 2020 Jun 5:11:515.
doi: 10.3389/fpsyt.2020.00515. eCollection 2020.

Effect of Jian-Pi-Zhi-Dong Decoction on the Amino Acid Neurotransmitters in a Rat Model of Tourette Syndrome and Comorbid Anxiety Disorder

Affiliations

Effect of Jian-Pi-Zhi-Dong Decoction on the Amino Acid Neurotransmitters in a Rat Model of Tourette Syndrome and Comorbid Anxiety Disorder

Wen Zhang et al. Front Psychiatry. .

Abstract

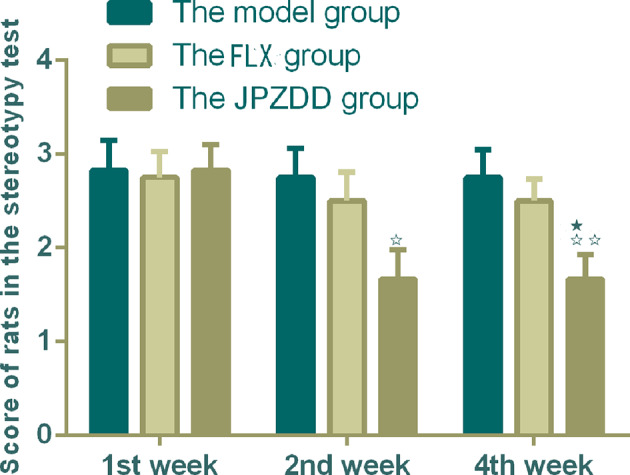
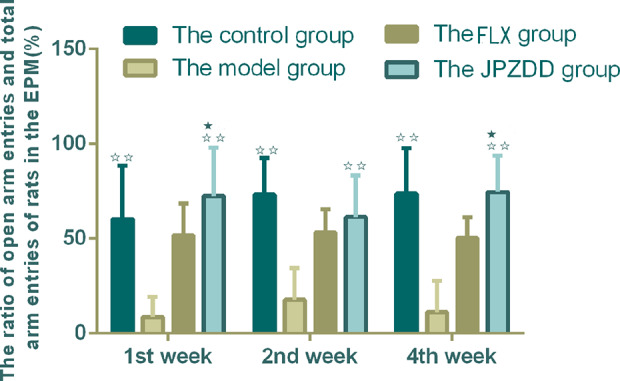
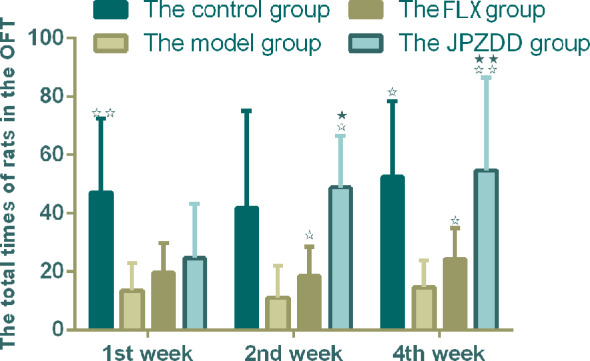
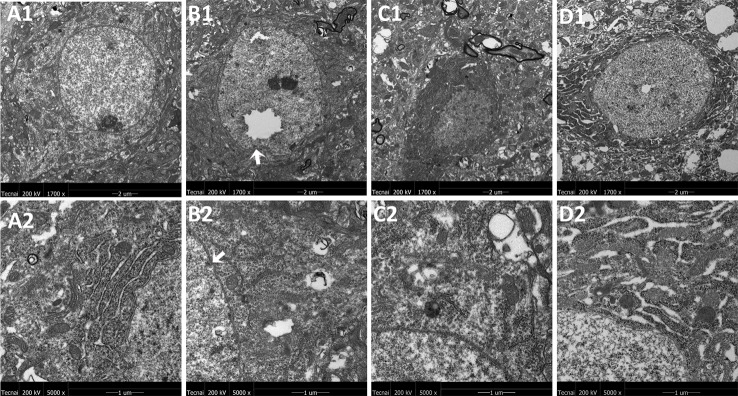
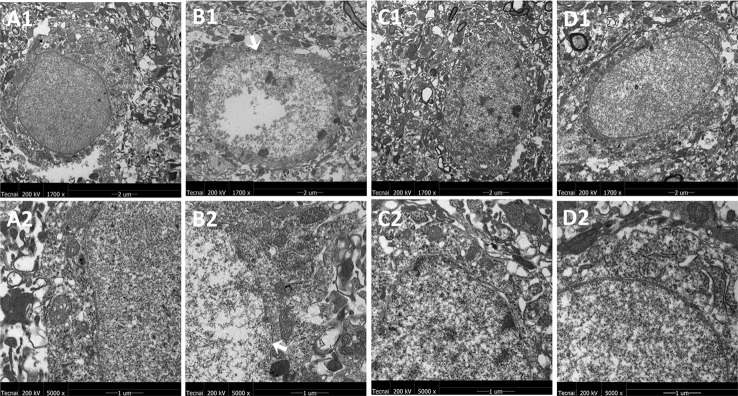
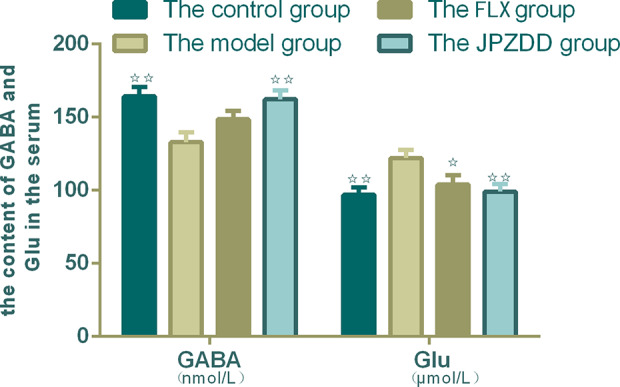
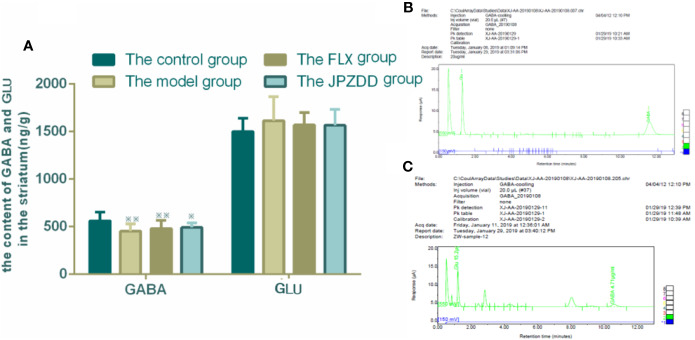
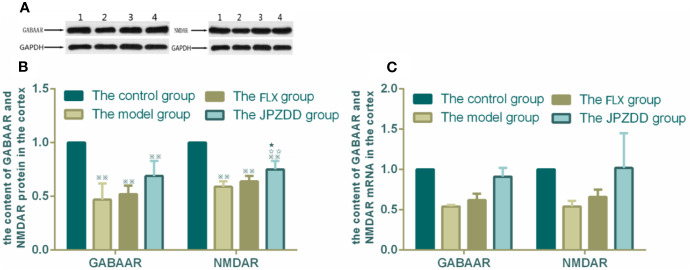
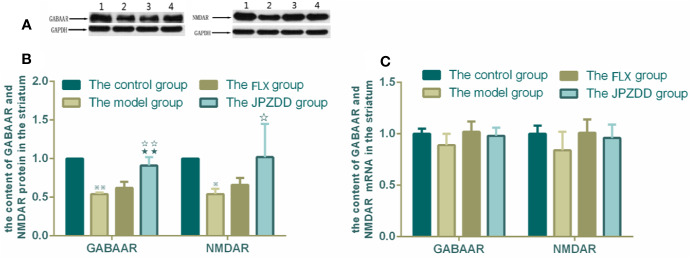
Amino acid neurotransmitters have been shown to correlate with Tourette syndrome (TS) and its comorbidities. In this study, we investigated the effects of Jian-Pi-Zhi-Dong Decoction (JPZDD), a formula containing 10 different Chinese medical herbs, on amino acid neurotransmitters in rats. We established a rat model of Tourette syndrome and comorbid anxiety with an iminodipropionitrile injection plus uncertain empty water bottle stimulation for 3 weeks. Then the rats were randomly divided into four groups: control group and model group were gavaged with saline, while the remaining two treatment groups were gavaged with fluoxetine hydrochloride or JPZDD for four consecutive weeks. We recorded the behaviors of the rats with TS and comorbid anxiety by stereotypy recording, open field test, and elevated plus maze. We observed mitochondrial changes with transmission electron microscopy. We measured the content of glutamate (GLU) and γ-aminobutyric acid (GABA) both in the serum and striatum and the expression of their receptors by Western blot and real-time polymerase chain reaction. The study revealed that JPZDD was effective in alleviating the behavioral symptoms of both tic and anxiety in the rat model groups. These results might be associated with the increase in GABA levels and decrease in GLU levels in the serum, as well as an increase in striatal GABA level by the activation of GABA receptors Type A (GABAAR). JPZDD treatment also reversed the mitochondrial dysfunction both in the striatum and cortex in affected animals.

Keywords: GABA receptors Type A; Jian-Pi-Zhi-Dong Decoction; N-methyl-D-aspartate receptor; Tourette syndrome; Traditional Chinese Medicine; comorbidity; glutamate; γ-aminobutyric acid.


Figures

Figure 1
Figure 1
Effect of treatments on the stereotypy behavior score of TS and comorbid anxiety rats. Data are presented as mean ± standard deviation. (n = 12; 1 week: F = 0.03, P = 0.97; 2 weeks: F = 3.36, P = 0.05; 4 weeks: F = 4.56, P = 0.02); ☆☆P < 0.01, P < 0.05 vs. the model group; P < 0.05 vs. the FLX group; Model group, TS and comorbid anxiety model group; FLX group, fluoxetine hydrochloride group; JPZDD group, Jian-Pi-Zhi-Dong Decoction group.
Figure 2
Figure 2
Effect of treatments on the elevated plus maze score of TS and comorbid anxiety rats. Data are presented as mean ± standard deviation. (n = 12; 1 week: F = 6.32, P = 0.00; 2 weeks: F = 7.2, P = 0.00; 4 weeks: F = 7.28, P = 0.00) ☆☆ P < 0.01 vs. the model group; P < 0.05 vs. the FLX group; Model group, TS and comorbid anxiety model group; FLX group, fluoxetine hydrochloride group; JPZDD group, Jian-Pi-Zhi-Dong Decoction group.
Figure 3
Figure 3
Effect of treatments on the OFT of TS and comorbid anxiety rats. Data are presented as mean ± standard deviation. (n = 12; 1 week: F = 18.06, P = 0.00; 2 weeks: F = 2.08, P = 0.04; 4 weeks: F = 19.38, P = 0.00) ☆☆ P < 0.01, P < 0.05 vs. the model group; ★★ P < 0.01, P < 0.05 vs. the FLX group; Model group, TS and comorbid anxiety model group; FLX group, fluoxetine hydrochloride group; JPZDD group, Jian-Pi-Zhi-Dong Decoction group.
Figure 4
Figure 4
Mitochondria abnormalities identified in the frontal cortex region by transmission electron microscope. n = 3 for each group. Representative image of each group was viewed at 1,700 × (scale bar = 2 μm) and 5,000 × (scale bar = 1 μm) magnifications to detect changes in the frontal cortex mitochondria. A1: Representative image of low magnification (1,700×) image from control group. B1: Representative image of low magnification (1,700×) image from model group; The white arrow indicates mitochondria abnormalities. C1: Representative image of low magnification (1,700×) image from FLX group; D1: Representative image of low magnification (1,700×) image from JPZDD group; A2: Representative image of high magnification (5,000×) image from control group. B2: Representative image of high magnification (5,000×) image from model group; Abnormal mitochondrion is shown by the white arrow. C2: Representative image of high magnification (5,000×) image from FLX group; D2: Representative image of high magnification (5,000×) image from JPZDD group.
Figure 5
Figure 5
Mitochondria abnormalities identified in the striatum region by transmission electron microscope. n = 3 for each group. Representative image of each group was viewed at 1,700× (scale bar = 2 μm) and 5,000× (scale bar = 1 μm) magnifications to detect changes in the striatum mitochondria. Abbreviations: A1: Representative image of low magnification (1,700×) image from control group. B1: Representative image of low magnification (1,700×) image from model group; The white arrow indicates the rupture of the double membrane. C1: Representative image of low magnification (1,700×) image from FLX group; D1: Representative image of low magnification (1,700×) image from JPZDD group. A2: Representative image of high magnification (5,000×) image from control group. B2: Representative image of high magnification (5,000×) image from model group; “Disrupted” membrane is shown by the white arrow. C2: Representative image of high magnification (5,000×) image from FLX group; D2: Representative image of high magnification (5,000×) image from JPZDD group.
Figure 6
Figure 6
Effect of JPZDD on expression of GABA and GLU in the serum. Data are presented as mean ± standard deviation. n = 10 for the control group, FLX group, and JPZDD group; n = 12 for the model group (GABA F = 5.785, P < 0.01; GLU F = 4.4.54, P < 0.01). ☆☆ P < 0.01, P < 0.05 vs. the model group; Model group, TS and comorbid anxiety model group; FLX group, fluoxetine hydrochloride group; JPZDD group, Jian-Pi-Zhi-Dong Decoction group.
Figure 7
Figure 7
Effect of JPZDD on expression of GABA and GLU in the striatum. Data are presented as mean ± standard deviation. n = 12 for each group (GABA F = 4.19, P < 0.01; GLU F = 0.81, P > 0.05). ※※ P < 0.01, P< 0.05 vs. the control group; (A) The content of GABA and GLU in the striatum (B) Mixed amino acid standards (C) A sample of amino acids in brain striatum. Model group, TS and comorbid anxiety model group; FLX group, fluoxetine hydrochloride group; JPZDD group, Jian-Pi-Zhi-Dong Decoction group.
Figure 8
Figure 8
Effects of treatments on the expression levels of GABAAR and NMDAR in the cortex of TS and comorbid anxiety rats. WB and RT-PCR were performed to investigate changes in the expression of GABAAR and NMDAR and the effects of JPZDD on those levels in the cortex. ※※ P< 0.01 vs. the control group; ☆☆ P < 0.01 vs. the model group; P < 0.05 vs. the FLX group. (A) representative immunoblots showing the effects of FLX and JPZDD on the expression of GABAAR and NMDAR in the cortex. 1, control group; 2, model group; 3, FLX group; 4, JPZDD group; (B) the content of GABAAR and NMDAR protein in the cortex. (n = 3 per group, F = 36.45, P=0.01; F = 34.6, P = 0.00). (C) GABAAR and NMDAR mRNA expression in the cortex (n = 6 per group, F = 0.348, P = 0.791; F = 0.499, P = 0.687). Model group, TS and comorbid anxiety model group; FLX group, fluoxetine hydrochloride-treated group; JPZDD group, Jian-Pi-Zhi-Dong Decoction group.
Figure 9
Figure 9
Effects of treatments on the expression levels of GABAAR and NMDAR in the striatum of TS and comorbid anxiety rats. WB and RT-PCR were performed to measure changes in the expression of GABAAR and NMDAR and the effects of JPZDD on those levels in the striatum. ※※ P< 0.01, P< 0.05 vs. the control group; ☆☆ P < 0.01, P < 0.05 vs. the model group; ★★ P < 0.01, vs. the FLX group. (A) representative immunoblots showing the effects of FLX and JPZDD on the expression of GABAAR and NMDAR in the striatum. 1, control group; 2, model group; 3, FLX group; 4, JPZDD group; (B) the content of GABAAR and NMDAR protein in the striatum (n = 3 per group, F = 30.74, P = 0.00; F = 39.39, P = 0.00). (C) GABAAR and NMDAR mRNA expression (n = 6 per group, F = 2.62, P = 0.08; F = 2.07, P = 014). Model group, TS and comorbid anxiety model group; FLX group, fluoxetine hydrochloride-treated group; JPZDD group, Jian-Pi-Zhi-Dong Decoction group.

Similar articles

Cited by

References

    1. Gill CE, Kompoliti K. Clinical Features of Tourette Syndrome. J Child Neurol (2020) 35(2):166–74. 10.1177/0883073819877335 - DOI - PubMed
    1. Kumar A, Trescher W, Byler D. Tourette syndrome and comorbid neuropsychiatric conditions. Curr Dev Disord Rep (2016) 3(4):217–21. 10.1007/s40474-016-0099-1 - DOI - PMC - PubMed
    1. Hirschtritt ME, Lee PC, Pauls DL, Dion Y, Grados MA, Illmann C, et al. Lifetime prevalence, age of risk, and genetic relationships of comorbid psychiatric disorders in Tourette syndrome. JAMA Psychiat (2015) 72(4):325–33. 10.1001/jamapsychiatry.2014.2650 - DOI - PMC - PubMed
    1. Singer HS. Tics and Tourette syndrome. Continuum (Minneap Minn) (2019) 25(4):936–58. 10.1212/con.0000000000000752 - DOI - PubMed
    1. Martino D, Ganos C, Pringsheim TM. Tourette syndrome and chronic tic disorders: The clinical spectrum beyond tics. Int Rev Neurobiol (2017) 134:1461. 10.1016/bs.irn.2017.05.006 - DOI - PubMed