. 2020 Jun 5:11:505.
doi: 10.3389/fneur.2020.00505. eCollection 2020.

Quantitative Evaluation of a New Posturo-Locomotor Phenotype in a Rodent Model of Acute Unilateral Vestibulopathy

Affiliations

Quantitative Evaluation of a New Posturo-Locomotor Phenotype in a Rodent Model of Acute Unilateral Vestibulopathy

Guillaume Rastoldo et al. Front Neurol. .

Erratum in

Abstract

Vestibular pathologies are difficult to diagnose. Existing devices make it possible to quantify and follow the evolution of posturo-locomotor symptoms following vestibular loss in static conditions. However, today, there are no diagnostic tools allowing the quantitative and spontaneous analysis of these symptoms in dynamic situations. With this in mind, we used an open-field video tracking test aiming at identifying specific posturo-locomotor markers in a rodent model of vestibular pathology. Using Ethovision XT 14 software (Noldus), we identified and quantified several behavioral parameters typical of unilateral vestibular lesions in a rat model of vestibular pathology. The unilateral vestibular neurectomy (UVN) rat model reproduces the symptoms of acute unilateral peripheral vestibulopathy in humans. Our data show deficits in locomotion velocity, distance traveled and animal mobility in the first day after the injury. We also highlighted alterations in several parameters, such as head and body acceleration, locomotor pattern, and position of the body, as well as "circling" behavior after vestibular loss. Here, we provide an enriched posturo-locomotor phenotype specific to full and irreversible unilateral vestibular loss. This test helps to strengthen the quantitative evaluation of vestibular disorders in unilateral vestibular lesion rat model. It may also be useful for testing pharmacological compounds promoting the restoration of balance. Transfer of these novel evaluation parameters to human pathology may improve the diagnosis of acute unilateral vestibulopathies and could better follow the evolution of the symptoms upon pharmacological and physical rehabilitation.

Keywords: behavior; ethovision; locomotor activity; posture; unilateral vestibular lesion; vestibular compensation; vestibular syndrome.


Figures

Figure 1
Figure 1
Overview of vestibulospinal reflexes to support the head tilt and hypotonia observed after unilateral vestibular neurectomy. The medial vestibulo-spinal tract (purple) is primarily composed of axons from the medial vestibular nucleus (MVN) and mainly projects contralaterally to the cervical spinal cord to mediate the vestibulocollic reflex. The lateral vestibulospinal tracts (blue) is primarily composed of axons from the lateral vestibular nucleus (LVN) and projects ipsilaterally to the entire length of the spinal cord to influence the extensor musculature of the body involved in balance. Both tracts exert excitatory effects on extensor motoneurons with some inhibitory effects on flexor motoneurons in normal condition. Left unilateral vestibular neurectomy (UVN) induces a electrophysiological imbalance between homologous vestibular nuclei. Loss of activity in the ipsilateral vestibular nucleus induces hypotonia of the lumbar extensor muscles via the lateral vestibulospinal tract. In contrast, the increase in activity in the contralateral lateral vestibular nucleus induces hypertonia of the extensor muscles opposite to the lesion as observed on the picture. Left UVN induces a head tilted (rolled) to the left side (see picture). Extensor activity is induced on the side to which the head is inclined, and flexor activity is induced on the opposite side via the medial vestibulospinal tract (11). Ex, Extensor muscle; Fl, Flexor muscle; LVN, Lateral vestibular nucleus; MVN, Medial vestibular nucleus.
Figure 2
Figure 2
Experimental protocol. Upper part: schematic representation of behavioral observation in video-tracking to evaluate the time course of functional recovery at different post-UVN days. Behavioral analyses were made the day before the lesion, serving as a reference value, and then were performed at days (D) 1, 2, 3, 7, 10, 14, 21, and 30 post-lesion. Lower part: screenshot of the video recording used in the analysis. Ethovision™ automatically detect the following body points throughout the recordings: nose point (blue triangle), center point (red circle), and tail base (purple square) of each animal. The red line illustrates the plot of the center point while the animal is moving. Each animal allowed to explore the open field for 10 min. The open field is a square of 80 × 80 cm.
Figure 3
Figure 3
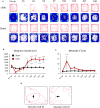
Effect of UVN on rat activity and spatial exploration in an open field. (A) Movement tracing and spatial exploration pattern (Heatmaps) of UVN and Sham rats in an open field over the 10 min analysis period. Heatmaps indicate the cumulative time at place (blue to red scale increasing duration). (B) Curve illustrating the mean postoperative recovery of the distance moved by rats on the open-field in the two experimental group of rats (Sham in black and UVN in red). (C) Curve illustrating the mean postoperative recovery of meander by rats on the open-field in the two experimental group of rats (Sham in black and UVN in red). Data represent mean ± SEM; *P < 0.05, **P < 0.01, ***P < 0.001. (D) Zoom on the movement tracing of a UVN rat 1 and 7 days after the surgery. Meander is defined as “the change in direction of movement of a subject relative to the distance moved by that subject and provides an indication of how convoluted the subject's trajectory is.” As observed on the movement tracing by rats 1 day after the surgery the trajectory (arrow) of the animal is more “tortuous” compared to the trajectory of the same rat seven days after UVN. A significant difference from the pre-operative value is indicated by * in black for the SHAM group. A significant difference from the pre-operative value is indicated by * in red for the UVN group. A significant difference between the SHAM and the UVN group is indicated with * in blue.
Figure 4
Figure 4
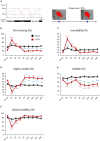
Mobility of UVN and Sham rats in the open field. (A) Illustration of the variable movement (on left) and mobility (on right). In the following example for movement, because the velocity initially lies between the Stop velocity and the Start velocity, the state is undefined. When velocity exceeds the Start velocity value, Movement is given the value “Moving.” When velocity drops below the Stop velocity value, Movement is given the value “Not moving.” Mobility can be defined as the degree of movement of an animal's body independent of spatial displacement of the center or any other body point, which is measured by Movement. The calculation of mobility does not use the x,y coordinates of the animal. Mobility is calculated 100% independent of movement of the coordinates identified as the center-point (or the nose/tail point). (B) Curves illustrating the kinetics of the % of time when the animal is not moving for UVN (red) and Sham (black) group. (C) Curves illustrating the kinetics of the % of time when the animal is immobile for UVN (red) and Sham (black) group. (D) Curves illustrating the kinetics of the % of time when the animal is highly mobile for UVN (red) and Sham (black) group. (E) Curves illustrating the kinetics of the % of time when the animal is mobile for UVN (red) and Sham (black) group. (F) Curves illustrating the kinetics of the % of time when the animal is either mobile or highly mobile (global mobility) for UVN (red) and Sham (black) group. Data represent mean ± SEM; *P < 0.05, **P < 0.01, ***P < 0.001. A significant difference from the pre-operative value is indicated by * in black for the SHAM group. A significant difference from the pre-operative value is indicated by * in red for the UVN group. A significant difference between the SHAM and the UVN group is indicated with * in blue.
Figure 5
Figure 5
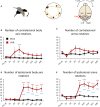
Rotation frequencies of UVN and Sham rats in the open field. (A) Illustration of body axis rotation (left part), arena rotation (middle part) and illustration of the contralateral and ipsilateral hemispheres regarding the lesion and turning direction (right part). A rotation in a counterclockwise (CCW) direction is a ipsilesional rotation and vice versa for clockwise (CW) rotations. Body axis rotation is a method used to quantify if the rat is spinning around its own axis. Arena rotation is suitable for when animal walks around in circles (middle part). (B) Curves illustrating the kinetics of body axis rotation frequencies on the intact side (contralesional rotations) of UVN (red) and Sham (black) group. (C) Curves illustrating the kinetics of arena rotation frequencies on the intact side (contralesional rotations) of UVN (red) and Sham (black) group. (D) Curves illustrating the kinetics of body axis rotation frequency on the lesioned side (ipsilesional rotation) of UVN (red) and Sham (black) group. (E) Curves illustrating the kinetics of Arena rotation frequency on the lesioned side (ipsilesional rotations) of UVN (red) and Sham (black) group. Data represent mean ± SEM; *P < 0.05, **P < 0.01, ***P < 0.001. A significant difference from the pre-operative value is indicated by * in black for the SHAM group. A significant difference from the pre-operative value is indicated by * in red for the UVN group. A significant difference between the SHAM and the UVN group is indicated with * in blue.
Figure 6
Figure 6
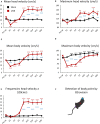
Locomotor velocity of UVN and Sham rats in the open field. (A) Curves illustrating the kinetics of the mean velocity (cm/s) of the head (calculated from the nose point) for UVN (red) and Sham (black) group. (B) Curves illustrating the kinetics of the maximum velocity (cm/s) of the head for UVN (red) and Sham (black) group. (C) Curves illustrating the kinetics of the mean velocity (cm/s) of the body (calculated from the center-point) for UVN (red) and Sham (black) group. (D) Curves illustrating the kinetics of the maximum velocity (cm/s) of the body for UVN (red) and Sham (black) group. (E) Curves illustrating the kinetics of the frequencies of the velocity of the head superior or equal to 100 cm/s, linked to the bobbing behavior (cephalic nystagmus) for UVN (red) and Sham (black) group. Bobbing behavior is defined when the velocity for the nose point is ≥ 100 cm/s. (F) illustration of the detection of body point by Ethovision™ throughout the recordings: nose point (blue triangle), center point (red circle), and tail base (purple square) of each animal. Data represent mean ± SEM; *P < 0.05, **P < 0.01, ***P < 0.001. A significant difference from the pre-operative value is indicated by * in black for the SHAM group. A significant difference from the pre-operative value is indicated by * in red for the UVN group. A significant difference between the SHAM and the UVN group is indicated with * in blue.
Figure 7
Figure 7
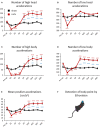
Acceleration of UVN and Sham rats in the open field. (A) Curves illustrating the kinetics of the mean number of high acceleration of the nose-point (above 50 cm/s2) for UVN (red) and Sham (black) group. (B) Curves illustrating the kinetics of the mean number of low acceleration of the nose-point (below 50 cm/s2) for UVN (red) and Sham (black) group. (C) Curves illustrating the kinetics of the mean number of high acceleration of the center point (above 50 cm/s2) for UVN (red) and Sham (black) group. (D) Curves illustrating the kinetics of the mean number of low acceleration of the center point (below 50 cm/s2) for UVN (red) and Sham (black) group. (E) Curves illustrating the mean positive accelerations of the rat (cm/s2) for UVN (red) and Sham (black) group. (F) Illustration of the detection of body point by Ethovision™ throughout the recordings: nose point (blue triangle), center point (red circle) and tail base (purple square) of each animal. Data represent mean ± SEM; *P < 0.05, **P < 0.01, ***P < 0.001. A significant difference from the pre-operative value is indicated by * in black for the SHAM group. A significant difference from the pre-operative value is indicated by * in red for the UVN group. A significant difference between the SHAM and the UVN group is indicated with * in blue.
Figure 8
Figure 8
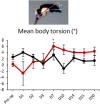
Posture of UVN and Sham rats in the open-field. Curves illustrating the mean body torsion of UVN (red) and Sham (black). Data represent mean ± SEM; *P < 0.05. A significant difference from the pre-operative value is indicated by * in black for the SHAM group. A significant difference from the pre-operative value is indicated by * in red for the UVN group. A significant difference between the SHAM and the UVN group is indicated with * in blue.

Similar articles

Cited by

References

    1. Lacour M, Helmchen C, Vidal PP. Vestibular compensation: the neuro-otologist's best friend. J Neurol. (2016) 263:54–64. 10.1007/s00415-015-7903-4 - DOI - PMC - PubMed
    1. Dutheil S, Lacour M, Tighilet B. Neurogenic potential of the vestibular nuclei and behavioural recovery time course in the adult cat are governed by the nature of the vestibular damage. PLoS ONE. (2011) 6:e22262. 10.1371/journal.pone.0022262 - DOI - PMC - PubMed
    1. Precht W, Shimazu H, Markham CH. A mechanism of central compensation of vestibular function following hemilabyrinthectomy. J Neurophysiol. (1966) 29:996–1010. 10.1152/jn.1966.29.6.996 - DOI - PubMed
    1. Darlington CL, Smith PF. Molecular mechanisms of recovery from vestibular damage in mammals: recent advances. Prog Neurobiol. (2000) 62:313–25. 10.1016/S0301-0082(00)00002-2 - DOI - PubMed
    1. Darlington CL, Dutia MB, Smith PF. The contribution of the intrinsic excitability of vestibular nucleus neurons to recovery from vestibular damage: recovery from vestibular damage: role of vestibular nucleus. Eur J Neurosci. (2002) 15:1719–27. 10.1046/j.1460-9568.2002.02024.x - DOI - PubMed

LinkOut - more resources