. 2020 Jun 3:11:341.
doi: 10.3389/fendo.2020.00341. eCollection 2020.

P2Y2 Receptor Promotes High-Fat Diet-Induced Obesity

Affiliations

P2Y2 Receptor Promotes High-Fat Diet-Induced Obesity

Yue Zhang et al. Front Endocrinol (Lausanne). .

Abstract

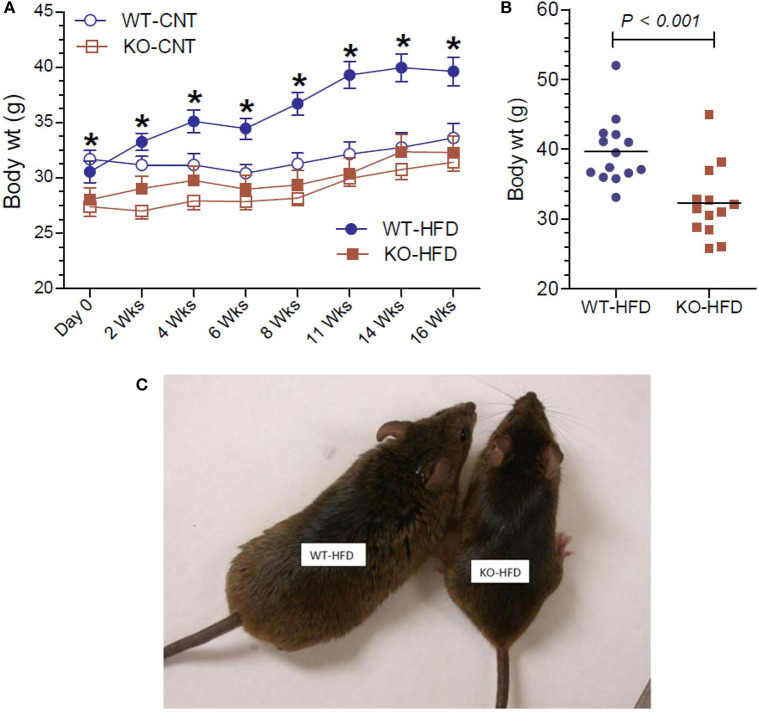
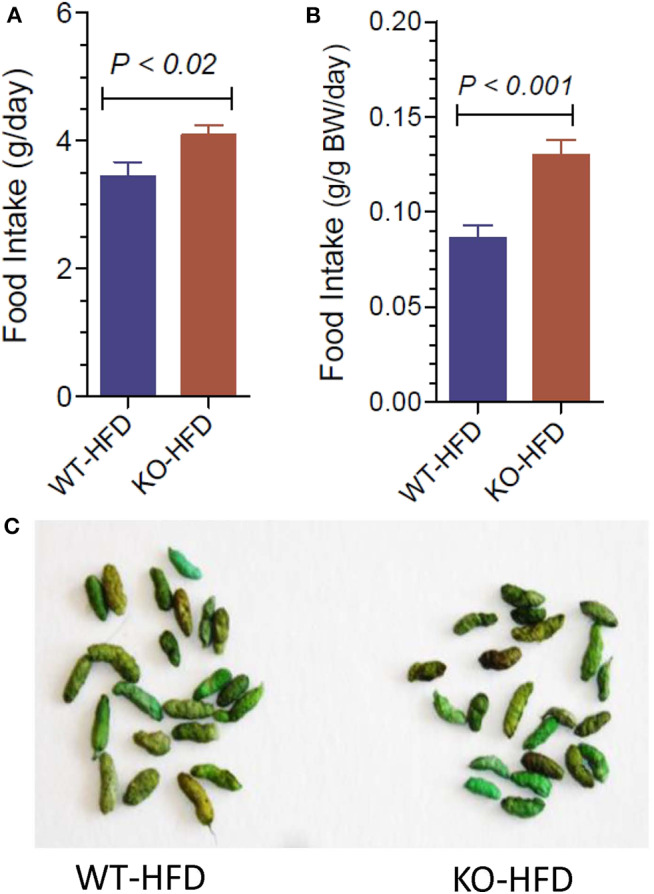
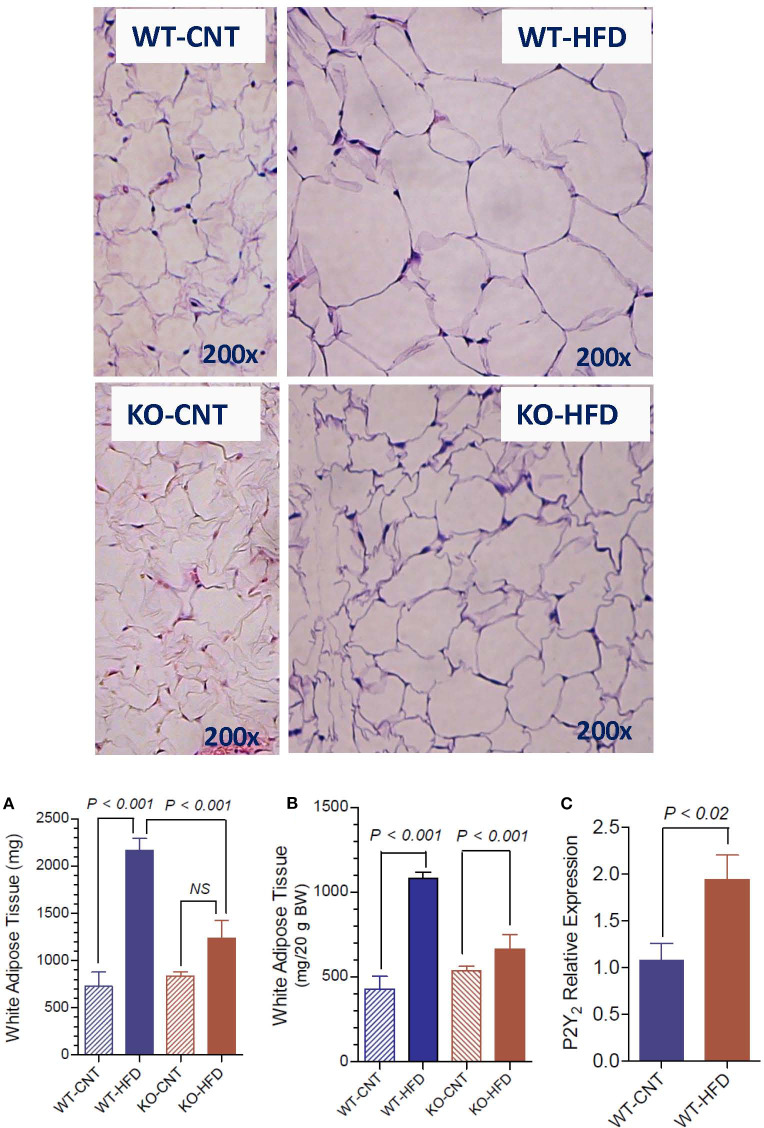
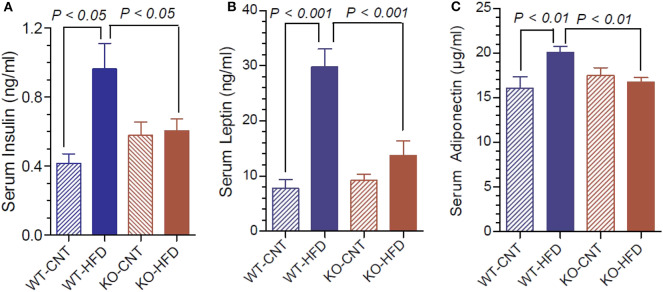
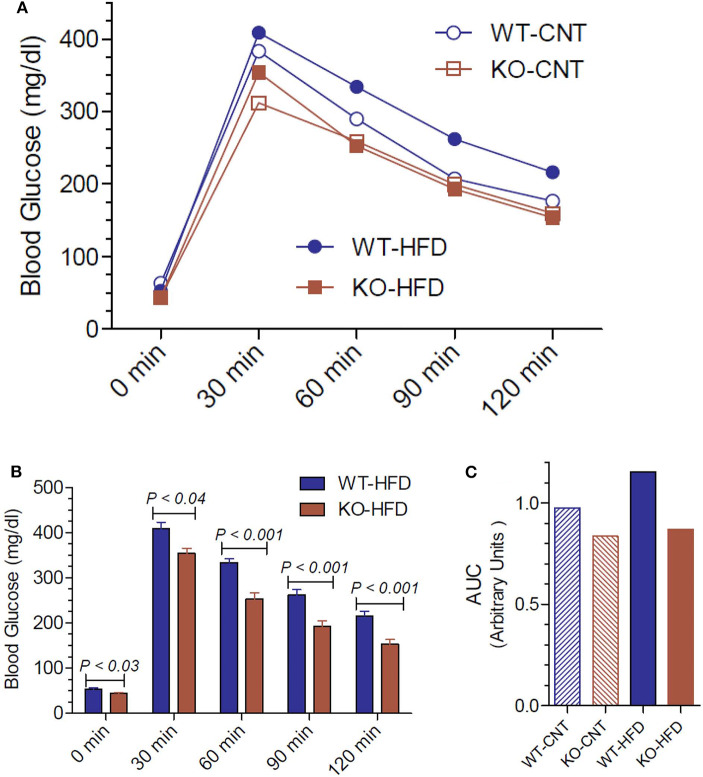
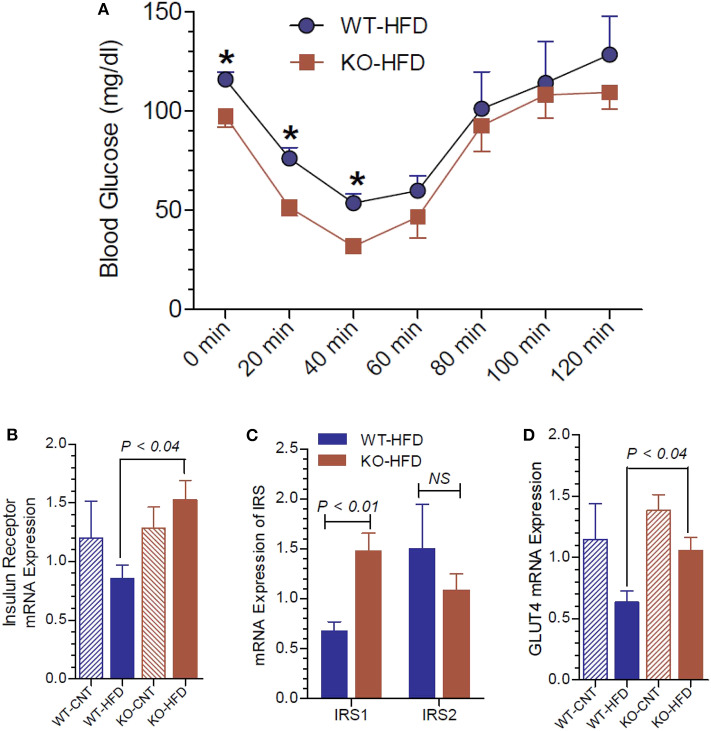
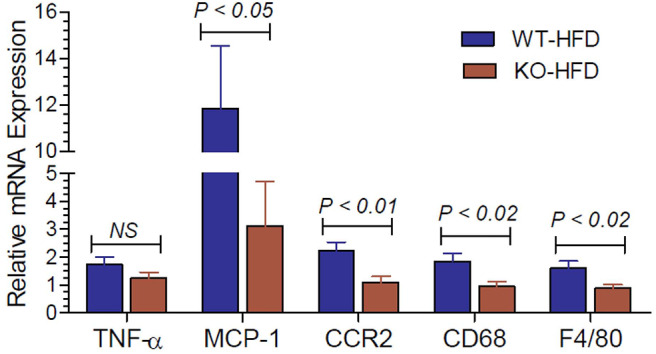
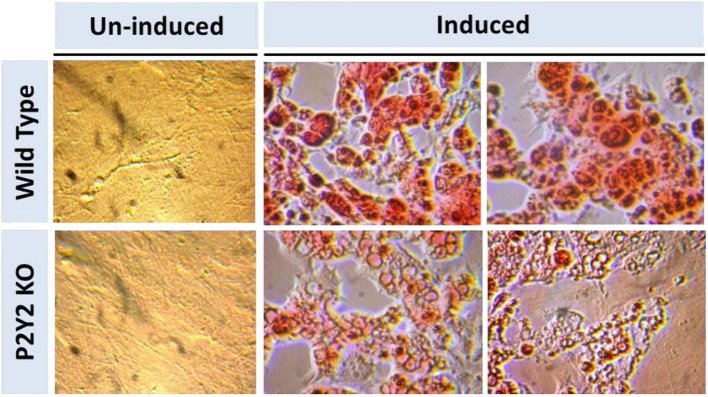
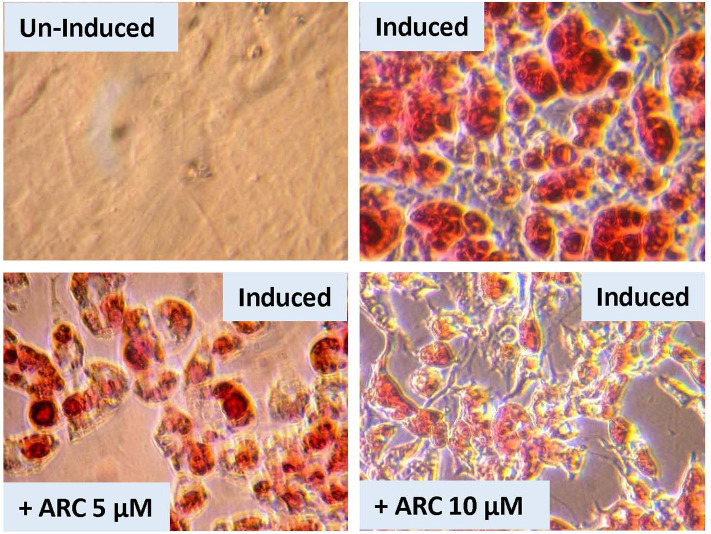
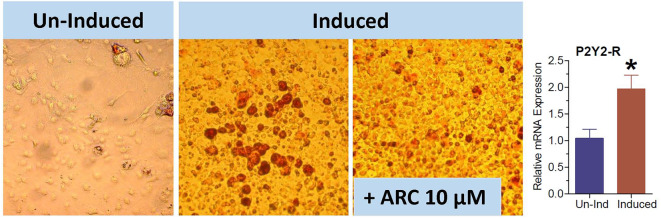
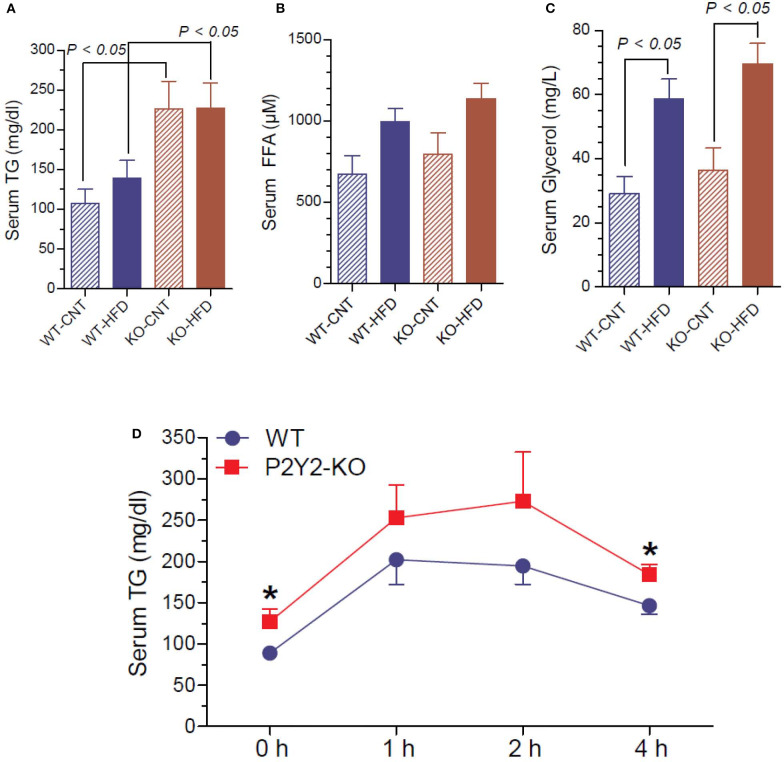
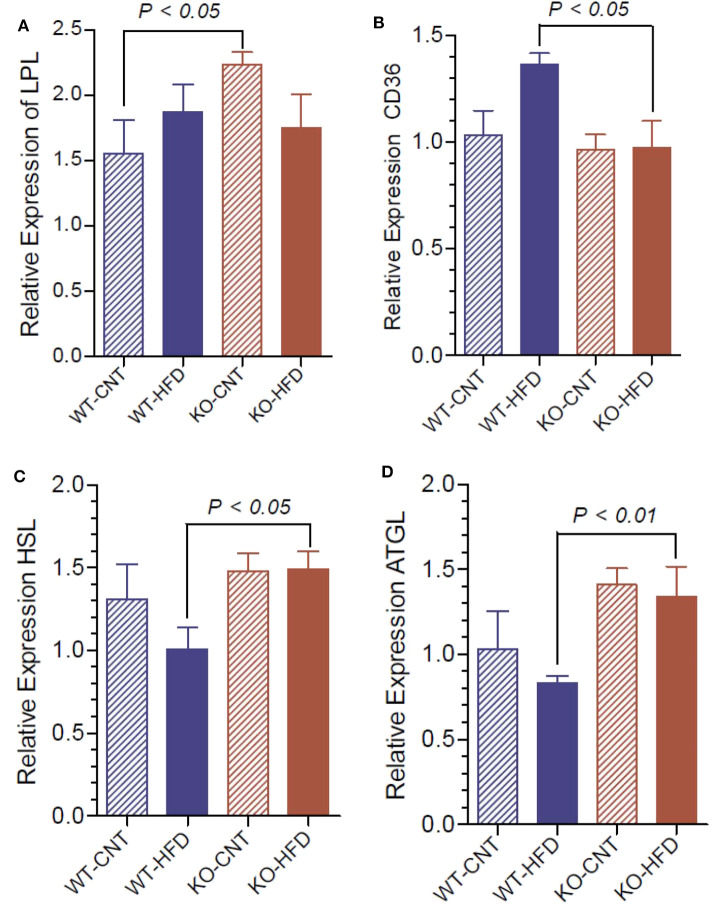
P2Y2, a G protein-coupled receptor (R), is expressed in all organs involved in the development of obesity and insulin resistance. To explore the role of it in diet-induced obesity, we fed male P2Y2-R whole body knockout (KO) and wild type (WT) mice (B6D2 genetic background) with regular diet (CNT; 10% calories as fat) or high-fat diet (HFD; 60% calories as fat) with free access to food and water for 16 weeks, and euthanized them. Adjusted for body weights (BW), KO mice consumed modestly, but significantly more HFD vs. WT mice, and excreted well-formed feces with no taint of fat or oil. Starting from the 2nd week, HFD-WT mice displayed significantly higher BW with terminal mean difference of 22% vs. HFD-KO mice. Terminal weights of white adipose tissue (WAT) were significantly lower in the HFD-KO vs. HFD-WT mice. The expression of P2Y2-R mRNA in WAT was increased by 2-fold in HFD-fed WT mice. Serum insulin, leptin and adiponectin levels were significantly elevated in the HFD-WT mice, but not in the HFD-KO mice. When induced in vitro, preadipocytes derived from KO mice fed regular diet did not differentiate and mature as robustly as those from the WT mice, as assessed by cellular expansion and accumulation of lipid droplets. Blockade of P2Y2-R by AR-C118925 in preadipocytes derived from WT mice prevented differentiation and maturation. Under basal conditions, KO mice had significantly higher serum triglycerides and showed slightly impaired lipid tolerance as compared to the WT mice. HFD-fed KO mice had significantly better glucose tolerance (GTT) as compared to HFD-fed WT mice. Whole body insulin sensitivity and mRNA expression of insulin receptor, IRS-1 and GLUT4 in WAT was significantly higher in HFD-fed KO mice vs. HFD-fed WT mice. On the contrary, the expression of pro-inflammatory molecules MCP-1, CCR2, CD68, and F4/80 were significantly higher in the WAT of HFD-fed WT vs. HFD-fed KO mice. These data suggest that P2Y2-R plays a significant role in the development of diet-induced obesity by promoting adipogenesis and inflammation, and altering the production of adipokines and lipids and their metabolism in adipose tissue, and thereby facilitates HFD-induced insulin resistance.

Keywords: AR-C 118925; adipose tissue; glucose homeostasis; inflammation; insulin resistance; lipid tolerance; obesity; purinergic signaling.


Figures

Figure 1
Figure 1
Body weights of WT and P2Y2 KO mice fed regular or high-fat diets. (A) Shows changes in the mean body weights over the time in WT and P2Y2 KO mice fed regular (CNT) or high-fat (HFD) diets. (N = 6 mice/genotype in CNT groups and N = 14 mice/genotype in HFD groups). *P < 0.05 or better as compared to the corresponding mean weights in the HFD-fed KO mice by direct comparison by unpaired t-test. (B) Shows scatter graph of terminal body weights in HFD-fed WT and P2Y2 KO mice. (C) Shows picture of one of the obese WT mice fed HFD vs. an average weighing KO mouse fed HFD after 16 weeks of feeding.
Figure 2
Figure 2
Food intake and appearance of fecal matter in WT and P2Y2 KO mice fed HFD. (A,B) Show food intake in HFD-fed WT and KO mice at 12 week point expressed as g/day or g/g body weight per day, respectively (N = 12 mice per genotype). (C) Shows representative samples of well-formed feces in HFD-fed WT and KO mice without any signs of fat or oil. The green color of the feces is due to the dye added to high-fat diet for identification.
Figure 3
Figure 3
Morphological appearance and mean terminal weights of white adipose tissue in WT and P2Y2 KO mice fed regular of high-fat diets. Upper panels show representative profiles of hematoxylin-eosin stained paraffin sections of white adipose tissue from WT and KO mice fed regular (CNT) or high-fat (HFD) diets for 16 weeks. All profiles are shown at the same final magnification (200x). (A,B) Show the mean terminal weights of white adipose tissue in WT and KO mice fed regular (CNT) or high-fat (HFD) diets, as mg total weight per mouse or as mg/20 g body weight, respectively (N = 6 mice/genotype for CNT; N = 12–14 mice/genotype for HFD). Statistics by ANOVA followed by Tukey-Kramer Multiple Comparison Test. (C) Shows mRNA expression of P2Y2 receptor relative to the mRNA expression of β-actin in the white fat of WT mice fed regular or high-fat diets (N = 6 mice/group); statistics by unpaired t-test.
Figure 4
Figure 4
Terminal serum insulin, leptin and adiponectin levels in WT and P2Y2 KO mice fed regular or high-fat diets. Serum samples were assayed for insulin, leptin and adiponectin using commercial ELISA or EIA kits. (A) Shows serum insulin levels; (B) shows serum leptin levels; (C) shoes serum adiponectin levels; in WT and P2Y2 KO mice fed regular or high-fat diet (N = 6 mice/genotype on CNT diet and N = 10–13 mice/genotype on HFD diet). Statistics by ANOVA followed by Tukey-Kramer Multiple Comparison Test.
Figure 5
Figure 5
Glucose tolerance test in WT and P2Y2 KO mice fed regular or high-fat diet for 14 weeks. Glucose tolerance test was conducted toward the end of the experimental period of feeding high-fat diet. (A) Mean blood glucose values in all groups at different time points after administration of glucose. N = 5 mice/genotype in CNT diet, N = 12 mice/genotype on high-fat diet. (B) Blood glucose values in high-fat diet fed WT and KO mice at different time points. N = 12 mice/genotype; statistics shown are by direct comparison by unpaired t-test. (C) Area under curve (AUC) for the data shown in (A).
Figure 6
Figure 6
Insulin tolerance test and insulin receptor status in WT and P2Y2 KO mice fed regular or high-fat diet for 13 weeks. Insulin tolerance test was conducted toward the end of experimental period of feeding high-fat diet. (A) Insulin tolerance test in high-fat diet fed WT and P2Y2 KO mice (N = 4 mice/genotype). *P < 0.05 compared to the same time point in KO-HFD group. Real-time RT-PCR approach was used to determine the mRNA expression of insulin receptor (B), insulin receptor substrates (C), and GLUT4 (D) relative to the expression of β-acting in the white adipose tissues of WT or P2Y2 KO mice fed regular (CNT) or high-fat (HFD) diets (N = 6 or 7 per group). Statistics by ANOVA followed by Tukey-Kramer Multiple Comparison Test.
Figure 7
Figure 7
Inflammatory cytokines and related molecules in the white adipose tissue of WT and P2Y2 KO mice fed high-fat diet. Real-time RT-PCR approach was used to determine the expression of inflammatory cytokines and related molecules relative to the mRNA expression of β-actin in the white adipose tissue of HFD fed WT and P2Y2 KO mice. N = 7 mouse samples per group for each parameter. Statistics shown are by direct comparison of the two groups by unpaired t-test. TNF-α (tumor necrosis factor-alpha), MCP-1 (monocyte chemoattractant protein-1), CCR2 (C-C chemokine receptor type-2), CD68 (cluster of differentiation 68), and F4/80 (EGF-like module-containing mucin-like hormone receptor-like 1)
Figure 8
Figure 8
In vitro induced differentiation and maturation of pre-adipocytes derived from WT or P2Y2 KO mice. Preadipocytes harvested from WT and P2Y2 receptor KO mice fed regular diet were induced to differentiate and mature in vitro. Matured cells were stained with Oil Red to visualize cellular content of triglycerides. The similar looking dark or gray spots in un-induced panels were apparently due to artifacts in the optical pathway, and were not related to the cultures per se, which have distinct appearances.
Figure 9
Figure 9
Effect of blockade of P2Y2 receptor on in vitro differentiation and maturation of pre-adipocytes from WT mice. Preadipocytes harvested from WT mice fed regular diet were induced to differentiate and mature in the absence of presence of AR-C118925, a selective and potent antagonist of P2Y2 receptor, at 5 or 10 μM concentration in the culture medium. Cells were stained with Oil Red to visualize cellular content of triglycerides.
Figure 10
Figure 10
Effect of blockade of P2Y2 receptor on differentiation and maturation of cultured 3T3-L1 cells into adipocytes. 3T3-L1 cells were induced to differentiate and mature into adipocytes in the absence or presence of AR-C118925, a selective and potent antagonist of P2Y2 receptor at a concentration of 10 μM in the culture medium. Cells were stained with Oil Red to visualize cellular content of triglycerides. Bar graph shows upregulation of P2Y2 receptor mRNA during maturation and differentiation of the 3T3-L1 cells into adipocytes (N = 4 cultures per condition). *P < 0.02 vs. un-induced group by unpaired t-test.
Figure 11
Figure 11
Terminal serum triglycerides, free fatty acids and glycerol and lipid tolerance test in the WT and P2Y2 KO mice. Serum samples collected at euthanasia (16-weeks of treatment) were assayed for triglycerides (A), free fatty acids (B) and glycerol (C) by using commercial assay kits. N = 6 samples/genotype for CNT diet, and N = 11 or 13/genotype for HFD groups. Statistics by ANOVA followed by Tukey-Kramer Multiple Comparison Test. (D) Lipid tolerance test (conducted after 14 weeks of HFD treatment): groups of mice (N = 6 mice/genotype) were injected intraperitoneally with 200 μl of Intralipid 20% (vol/vol) fat emulsion, and blood samples were collected at different time points as shown. Plasma samples were analyzed for triglyceride concentration using a commercial colorimetric assay kit. *significantly different from the mean value sin WT mice at the corresponding time point by direct comparison by unpaired t-test.
Figure 12
Figure 12
Relative mRNA expression of lipases in the white adipose tissue of WT and P2Y2 KO mice fed regular or high-fat diets for 16 weeks. Real-time RT-PCR approach was used to determine the mRNA expression of lipases relative to the mRNA expression of β-actin. (A), lipoprotein lipase (LPL); (B), fatty acid translocase (CD36); (C), hormone-sensitive lipase (HSL); and (D), adipose triglyceride lipase (ATGL). N = 6 samples per group. Statistics by ANOVA followed by Tukey-Kramer Multiple Comparison Test.

Similar articles

Cited by

References

    1. De Lorenzo A, Gratteri S, Gualtieri P, Cammarano A, Bertucci P, Di Renzo L. Why primary obesity is a disease? J Transl Med. (2019) 17:169. 10.1186/s12967-019-1919-y - DOI - PMC - PubMed
    1. Almond N, Kahwati L, Kinsinger L, Porterfield D. Prevalence of overweight and obesity among U.S. military veterans. Mil Med. (2008) 173:544–9. 10.7205/MILMED.173.6.544 - DOI - PubMed
    1. Breland JY, Phibbs CS, Hoggati KJ, Washington DL, Lee J, Haskell S, et al. . The obesity epidemic in the veterans health administration: prevalence among key populations of women and men veterans. J Gen Intern Med. (2017) 32:11–7. 10.1007/s11606-016-3962-1 - DOI - PMC - PubMed
    1. Reyes-Guzman CM, Bray RM, Forman-Hoffman VL, Williams J. Overweight and obesity trends among active duty military personnel: a 13-year perspective. Am J Prev Med. (2015) 48:145–53. 10.1016/j.amepre.2014.08.033 - DOI - PubMed
    1. Bray GA. Medical consequences of obesity. J Clin Endocrinol Metab. (2004) 89:2583–9. 10.1210/jc.2004-0535 - DOI - PubMed

Publication types

Substances