. 2020 Jun 3:11:860.
doi: 10.3389/fmicb.2020.00860. eCollection 2020.

Insights Into the Resistome of Bovine Clinical Mastitis Microbiome, a Key Factor in Disease Complication

Affiliations

Insights Into the Resistome of Bovine Clinical Mastitis Microbiome, a Key Factor in Disease Complication

M Nazmul Hoque et al. Front Microbiol. .

Abstract

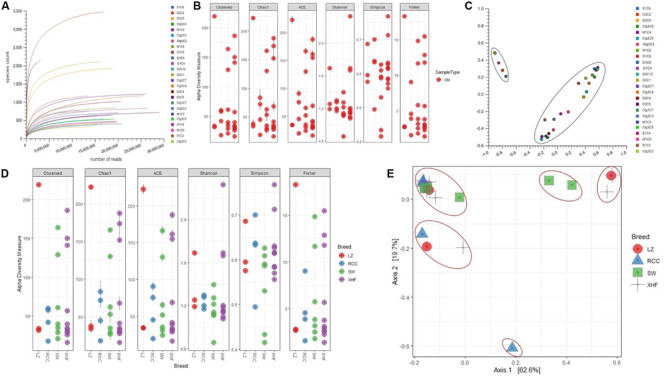
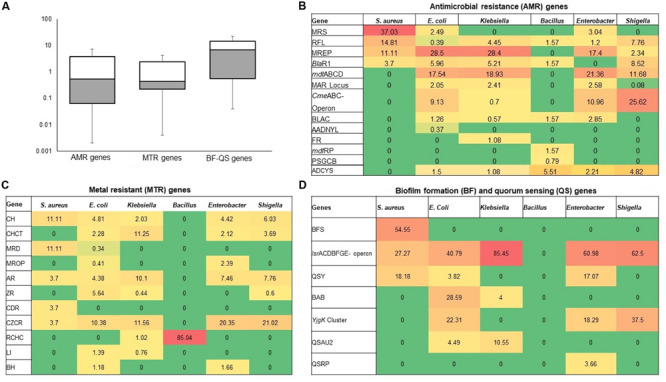
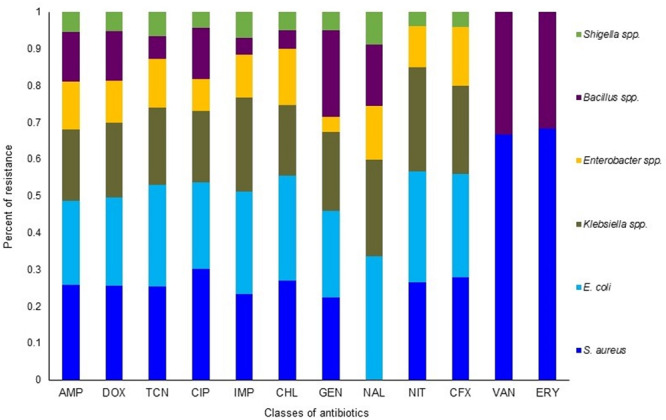
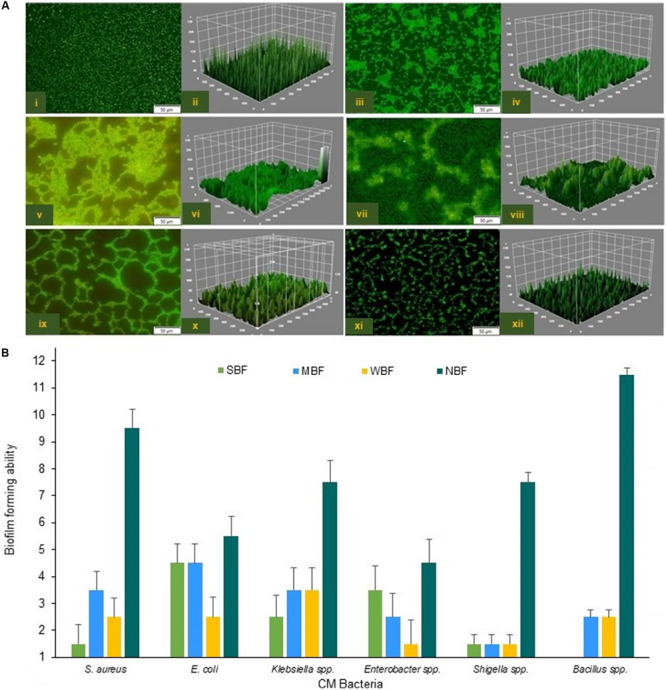
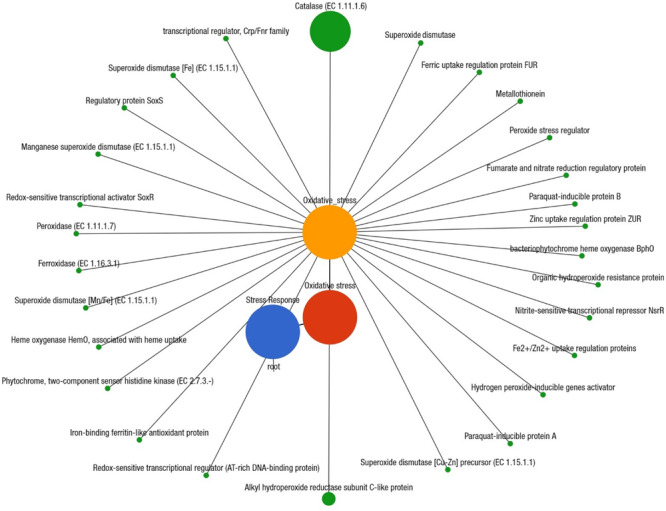
Bovine clinical mastitis (CM) is one of the most prevalent diseases caused by a wide range of resident microbes. The emergence of antimicrobial resistance in CM bacteria is well-known, however, the genomic resistance composition (the resistome) at the microbiome-level is not well characterized. In this study, we applied whole metagenome sequencing (WMS) to characterize the resistome of the CM microbiome, focusing on antibiotics and metals resistance, biofilm formation (BF), and quorum sensing (QS) along with in vitro resistance assays of six selected pathogens isolated from the same CM samples. The WMS generated an average of 21.13 million reads (post-processing) from 25 CM samples that mapped to 519 bacterial strains, of which 30.06% were previously unreported. We found a significant (P = 0.001) association between the resistomes and microbiome composition with no association with cattle breed, despite significant differences in microbiome diversity among breeds. The in vitro investigation determined that 76.2% of six selected pathogens considered "biofilm formers" actually formed biofilms and were also highly resistant to tetracycline, doxycycline, nalidixic acid, ampicillin, and chloramphenicol and remained sensitive to metals (Cr, Co, Ni, Cu, Zn) at varying concentrations. We also found bacterial flagellar movement and chemotaxis, regulation and cell signaling, and oxidative stress to be significantly associated with the pathophysiology of CM. Thus, identifying CM microbiomes, and analyzing their resistomes and genomic potentials will help improve the optimization of therapeutic schemes involving antibiotics and/or metals usage in the prevention and control of bovine CM.

Keywords: clinical mastitis; in vitro resistance assays; microbiome; resistome; whole metagenome sequencing.


Figures

FIGURE 1
FIGURE 1
Bovine clinical mastitis (CM) milk microbiome diversity. (A) Rarefaction curves showing the influence of sequencing depth (number of reads per sample, x-axis) on species richness (y-axis) in CM milk samples. The rarefaction curves representing the number of species per sample indicated that the sequencing depth was sufficient enough to fully capture the microbial diversity as existed. (B) Alpha diversity measured using the observed species, Chao 1, ACE and Shannon diversity indices through PathoScope (PS) analysis. The observed species richness (PObserved = 0.511), Chao1 (PChao1 = 0.081), ACE (PACE = 0.121), Shannon (PShannon = 0.401), Simpson (PSimpson = 0.011) and Fisher (PFisher = 0.014) diversity analyses revealed that microbiome diversity did not vary among the CM samples. (C) Beta diversity (Principal coordinate analysis; PCoA) measured on the Bray-Curtis distance method using MG-RAST tool for CM causing microbial communities (genus-level) shows that most of the CM samples clustered together (black circle), indicating no significant diversity differences. (D) Alpha diversity measured using species richness (PObserved = 0.011), Chao1 (PChao1 = 0.001), ACE (PACE = 0.021), Shannon (PShannon = 0.001), Simpson (PSimpson = 0.009) and Fisher (PFisher = 0.023) diversity matrices on PS data showed significant differences (Kruskal–Wallis test, P = 0.002) in microbial diversity across the four cow breeds (Local Zebu cows, LZ; Red Chattogram cows, RCC; Sahiwal, SW; Holstein Friesian cross, XHF). (E) PCoA plot based on weighted-UniFrac distance method at strain-level microbiome signature of four breeds of cows reveals that the CM samples appear more distantly (red circles) indicating significant group differences (P = 0.001). These differences in the microbiome signature associated with CM across the four breeds could be explained by a large percentage of variation in the first (62.6%) and second (19.7%) axes.
FIGURE 2
FIGURE 2
The strain-level taxonomic profile of microbiota associated with bovine clinical mastitis (CM). Taxonomic dendrogram showing the top bacterial microbiome of bovine CM milk. Color ranges identify different strains within the tree. Taxonomic dendrogram in the midpoint rooted phylogenetic tree was generated with the top 200 abundant unique strains of bacteria in CM milk metagenome based on the maximum likelihood method in Clustal W and displayed with iTOL (interactive Tree Of Life). Each node represents a single strain shared among more than 50% of the samples at a relative abundance of >0.0006% of the total bacterial community. Strains and/or species are color-coded by different order of bacteria present in >80% of samples. The strains in the phylogenetic tree are also available in Supplementary Material.
FIGURE 3
FIGURE 3
Strain-level bovine CM microbiome diversity in four different breeds (Local Zebu, LZ; Red Chattogram Cattle, RCC; Sahiwal, SW; Crossbred Holstein Friesian, XHF) of cows through PathoScope analysis. (A) Venn diagrams representing the core unique and shared microbiomes of bovine clinical mastitis (CM) in XHF and LZ breeds while (B) and (C) Venn diagrams showing the unique and shared bacterial strains in XHF and SW and XHF and RCC breeds, respectively. Microbiome sharing between the conditions are indicated by yellow color. (D) The circular plot illustrates the relative abundance of the top 75 CM causing bacterial strains in CM milk samples obtained from XHF, LZ, SW, and RCC dairy breeds. Taxa in the respective breed of cows are represented by different colored ribbons, and the inner blue bars indicate their respective relative abundances. The XHF cows had the highest number of microbial strains followed by LZ, SW, and RCC. This breed specific association revealed that 45.66, 22.58, and 19.11% of the detected bacterial strains in CM milk collected from LZ, SW, and RCC cows, respectively, were also seen in the CM milk microbiome of XHF cows. The relative abundance bacterial strains in four breeds is also available in Supplementary Material.
FIGURE 4
FIGURE 4
Projection of the resistance to antibiotic and toxic compounds (RATC) genes in bovine clinical mastitis (CM) pathogens. (A) Heatmap showing the hierarchical clustering of 30 different RATC genes detected in CM associated microbiomes of 25 CM milk samples as measured at level-3 of SEED subsystems in MG-RAST pipeline. The relative abundance of these genes significantly correlated (Pearson correlation, P = 0.002) with the relative abundance of the bacterial taxa found in these samples. The color bar at the bottom represents the relative abundance of putative genes and expressed as a value between –1 (low abundance) and 1 (high abundance). The yellow color indicates the more abundant patterns, while blue cells for less abundant RATC gene in that particular sample. The genes coding for MREP (multidrug resistance efflux pumps), CZCR (cobalt-zinc-cadmium resistance), BlaR (BlaR1 family regulatory sensor-transducer disambiguation); BLAC (beta-lactamase resistance), AR (arsenic resistance), RFL (resistance to fluoroquinolones), CH (copper homeostasis), CmeABC Operon (multidrug efflux pump in Campylobacter jejuni) had higher relative abundances than other RATC groups found in these CM samples. (B) The circular plot illustrates the diversity and relative abundance of the RATC genes detected among the microbiomes of the four different breeds (Local Zebu, LZ; Red Chattogram Cattle, RCC; Sahiwal, SW; Crossbred Holstein Friesian, XHF) of cows through SEED subsystems analysis. We found no significant correlation between the resistome and microbiome diversity in different breeds (P = 0.692). The association of the RATC genes according to breeds is shown by different colored ribbons and the relative abundances these genes are represented by inner blue colored bars. Part of the RATC functional groups are shared among microbes of the four breeds (XHF, LZ, SW, and RCC), and some are effectively undetected in the microbiomes of the other breeds. Abbreviations: CH, copper homeostasis; CHCT, copper homeostasis: copper tolerance; RCHC, resistance to chromium compounds; mdtABCD, the mdtABCD multidrug resistance cluster; OprN, mexe-mexf-oprn multidrug efflux system; MROP, mercury resistance to operon; MRS, methicillin resistance in Staphylococci; ZR, zinc resistance; BH, bile hydrolysis; ER, erythromycin resistance; ADCYS, adaptation to d-cysteine; SPVTL, Streptococcus pneumoniae vancomycin tolerance locus; STR, Streptothricin resistance; MAR Locus, multiple antibiotic resistance to locus; RVAN, resistance to vancomycin; MRD, mercuric reductase; LI, lysozyme inhibitors; AADNYL, aminoglycoside adenylyltransferases; mdtRP, multidrug resistance operon mdtRP of Bacillus; FR, Fosfomycin resistance; PSGCB, polymyxin synthetase gene cluster in Bacillus; OprM, mexA-mexB-oprm multidrug efflux system; CDR, cadmium resistance. Additional information is also available in Supplementary Material.
FIGURE 5
FIGURE 5
Heatmap comparison of antibiotics, metals, biofilm formation and quorum sensing genes found in the metagenome sequences (WMS) of six CM causing bacteria through SEED subsystems analysis in MG-RAST pipeline. (A) Diversity and relative abundance of the antimicrobial resistance (AMR), metal resistance (MTR), and biofilm formation (BF) and quorum sensing (QS) genes varied significantly (Kruskal–Wallis test, P = 0.029) among the study bacteria. (B) Relative abundance of AMR genes, (C) Relative abundance of MTR genes (D) Relative abundance of BF-QS genes. Values are colored in shades of green to yellow to red, indicating low (absent), medium and high abundance, respectively. Abbreviations: MRS, methicillin resistance in Staphylococci; RFL, resistance to fluoroquinolones; MREP, multidrug resistance to efflux pumps; BlaR, BlaR1 family regulatory sensor-transducer disambiguation; mdtABCD, the mdtABCD multidrug resistance cluster; MAR Locus, multiple antibiotic resistance; CmeABC Operon, Multidrug efflux pump in Campylobacter jejuni; BLAC, beta-lactamase resistance; AADNYL, aminoglycoside adenylyltransferases (Gentamycin resistance); FR, Fosfomycin resistance; mdtRP, multidrug resistance operon mdtRP of Bacillus; PSGCB, polymyxin synthetase gene cluster in Bacillus; BFS, biofilm formation in Staphylococcus, lsrACDBFGE operon, autoinducer 2 (AI-2) transport and processing; QSY, quorum sensing in Yersinia; BAB, biofilm adhesion biosynthesis; YjgK cluster, protein YjgK cluster linked to biofilm formation; QSAU2, quorum sensing: autoinducer-2 synthesis; QSRP, quorum sensing regulation in Pseudomonas; CH, copper homeostasis; CHCT, copper homeostasis: copper tolerance; MRD, mercuric reductase; MROP, mercury resistance to operon; AR, arsenic resistance; ZR, zinc resistance; CDR, cadmium resistance; CZCR, cobalt-zinc-cadmium resistance; ADCYS, adaptation to d-cysteine; RCHC, resistance to chromium compounds; LI, lysozyme inhibitors; BH, bile hydrolysis. More details about these genes can be found in the text and Supplementary Material.
FIGURE 6
FIGURE 6
Antibiotic resistance pattern of bovine clinical mastitis pathogens by disk diffusion method. The antimicrobial resistance (AMR) patterns of the six bacteria obtained from 221 CM isolates (S. aureus, 56; E. coli, 54; Klebsiella spp., 42; Enterobacter spp., 26; Bacillus spp., 31; Shigella spp., 12) for twelve commonly used antibiotics from nine different groups/classes. Abbreviations: AMP, Ampicillin; DOX, Doxycycline; TCN, Tetracycline; CIP, Ciprofloxacin; IMP, Imipenem; CHL, Chloramphenicol; GEN, Gentamycin; NAL, Nalidixic acid; NIT, Nitrofurantoin; CFX, Cefoxitin; VAN, Vancomycin; ERY, Erythromycin. More details about AMR profiles can be found in the text and in Table 1.
FIGURE 7
FIGURE 7
Antibacterial activity of heavy metals: Cu (CuSO4), Zn (ZnO), Cr (K2Cr2O7), Co (CoCl2) and Ni (NiCl2) against bovine CM pathogens. (A) Zone of inhibition (ZOI, mm) for six CM causing bacteria, each bar representing the mean values (values given horizontal axis of the bars, mm) and standard deviation error bar (SD error bar) for each bacterium. (B) Minimal inhibitory concentration (MIC) (expressed as μg/mL) of the tested metals against representative genera/species as determined by agar well diffusion method.
FIGURE 8
FIGURE 8
Biofilm formation (BF) ability of the six CM causing pathogens. (A) Confocal fluorescence images (2D and 3D) of S. aureus (i,ii), E. coli (iii,iv), Klebsiella spp. (v,vi), Enterobacter spp. (vii,viii), Bacillus spp. (ix,x) and Shigella spp. (xi,xii). Scale bars are indicated in μm. (B) Capability of the biofilm formation by six CM causing bacteria.
FIGURE 9
FIGURE 9
Projection of the clinical mastitis (CM) milk metagenome onto KEGG pathways. The whole metagenome sequencing (WMS) reveals significant differences (Kruskal–Wallis test, P = 0.001) in functional microbial pathways. A total of 28 genes associated with oxidative stress were found in CM microbiomes. Black lines with green circles delineate the distribution of the stress related genes according to their class across the CM metagenome. The diameter of the circles indicates the relative abundance of the respective genes. More details about these genes can be found in the text and Supplementary Material.

References

    1. Abebe R., Hatiya H., Abera M., Megersa B., Asmare K. (2016). Bovine mastitis: prevalence, risk factors and isolation of Staphylococcus aureus in dairy herds at Hawassa milk shed, South Ethiopia. BMC Vet. Res. 12:270. 10.1186/s12917-016-0905-3 - DOI - PMC - PubMed
    1. Andrei S., Matei S., Rugină D., Bogdan L., Ştefănuţ C. (2016). Interrelationships between the content of oxidative markers, antioxidative status, and somatic cell count in cow’s milk. Czech J. Animal Sci. 61 407–413. 10.17221/70/2015-CJAS - DOI
    1. Baron S., Diene S., Rolain J. M. (2018). Human microbiomes and antibiotic resistance. Hum. Microb J. 10 43–52. 10.1016/j.humic.2018.08.005 - DOI
    1. Beck J., Holloway J. D., Schwanghart W. (2013). Under sampling and the measurement of beta diversity. Methods Ecol. Evol. 4 370–382. 10.1111/2041-210x.12023 - DOI
    1. Cheng J., Qu W., Barkema H. W., Nobrega D. B., Gao J., Liu G., et al. (2019). Antimicrobial resistance profiles of 5 common bovine mastitis pathogens in large Chinese dairy herds. J. Dairy Sci. 102 1–11. 10.3168/jds.2018-15135 - DOI - PubMed

LinkOut - more resources