

Crop Management Impacts the Soybean (Glycine max) Microbiome
- PMID: 32582080
- PMCID: PMC7283522
- DOI: 10.3389/fmicb.2020.01116
Crop Management Impacts the Soybean (Glycine max) Microbiome
Abstract
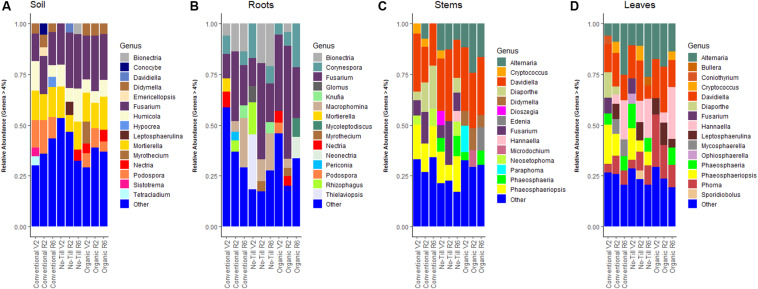
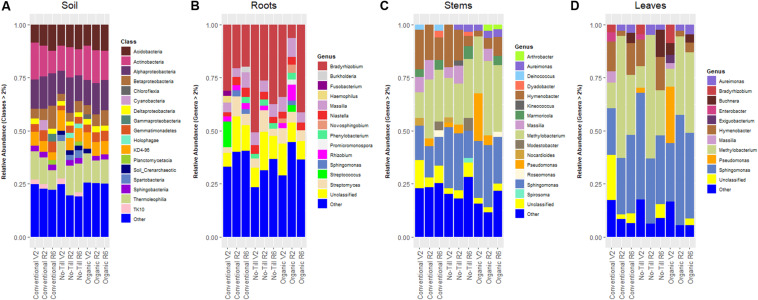
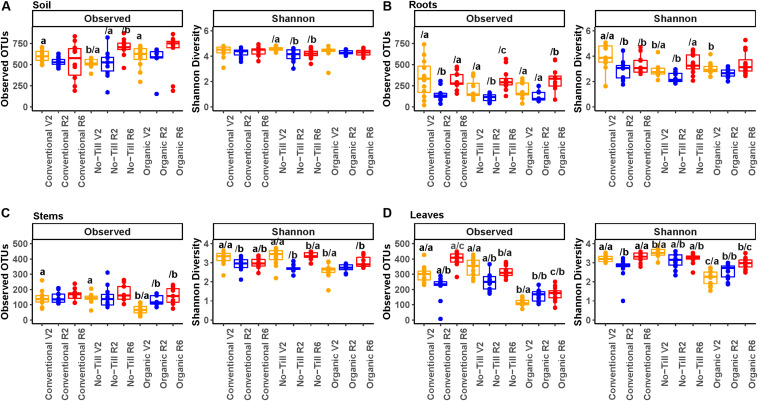
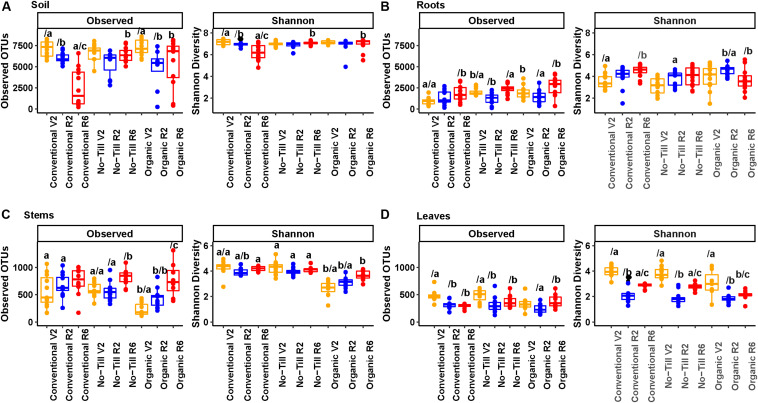
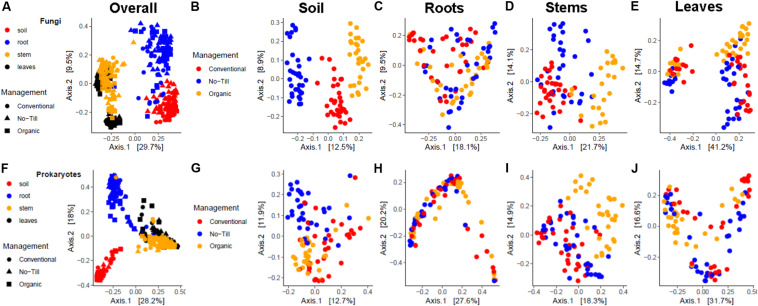
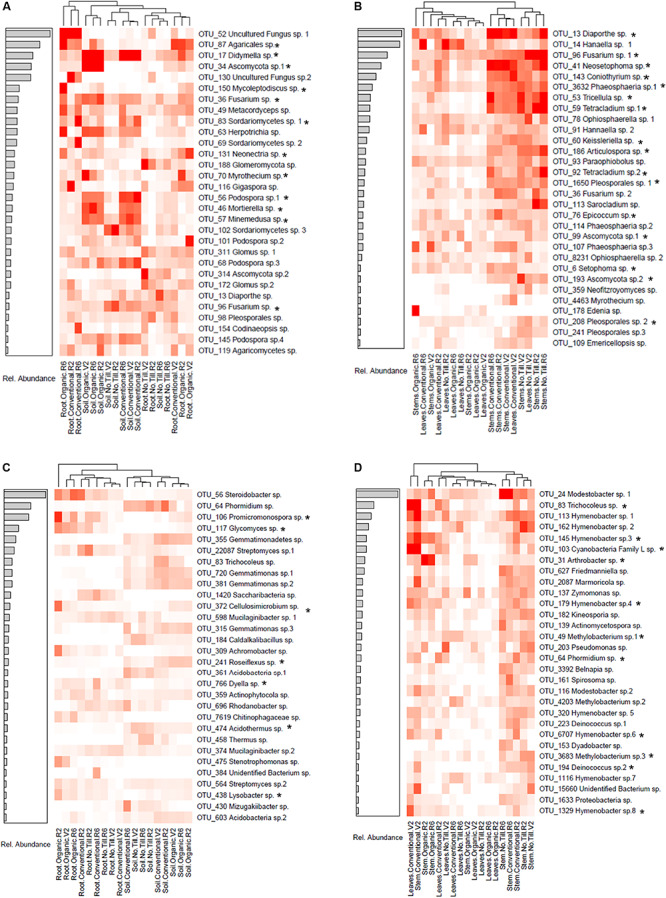
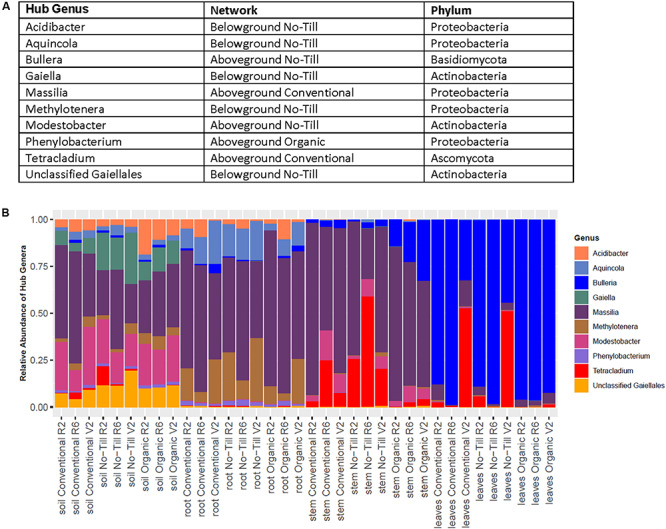
Soybean (Glycine max) is an important leguminous crop that is grown throughout the United States and around the world. In 2016, soybean was valued at $41 billion USD in the United States alone. Increasingly, soybean farmers are adopting alternative management strategies to improve the sustainability and profitability of their crop. Various benefits have been demonstrated for alternative management systems, but their effects on soybean-associated microbial communities are not well-understood. In order to better understand the impact of crop management systems on the soybean-associated microbiome, we employed DNA amplicon sequencing of the Internal Transcribed Spacer (ITS) region and 16S rRNA genes to analyze fungal and prokaryotic communities associated with soil, roots, stems, and leaves. Soybean plants were sampled from replicated fields under long-term conventional, no-till, and organic management systems at three time points throughout the growing season. Results indicated that sample origin was the main driver of beta diversity in soybean-associated microbial communities, but management regime and plant growth stage were also significant factors. Similarly, differences in alpha diversity are driven by compartment and sample origin. Overall, the organic management system had lower fungal and bacterial Shannon diversity. In prokaryotic communities, aboveground tissues were dominated by Sphingomonas and Methylobacterium while belowground samples were dominated by Bradyrhizobium and Sphingomonas. Aboveground fungal communities were dominated by Davidiella across all management systems, while belowground samples were dominated by Fusarium and Mortierella. Specific taxa including potential plant beneficials such as Mortierella were indicator species of the conventional and organic management systems. No-till management increased the abundance of groups known to contain plant beneficial organisms such as Bradyrhizobium and Glomeromycotina. Network analyses show different highly connected hub taxa were present in each management system. Overall, this research demonstrates how specific long-term cropping management systems alter microbial communities and how those communities change throughout the growth of soybean.
Keywords: agricultural management; amplicon sequencing; plant-microbe interactions; rDNA; soybean.
Copyright © 2020 Longley, Noel, Benucci, Chilvers, Trail and Bonito.
Figures
Similar articles
-
The shift of soil microbial community induced by cropping sequence affect soil properties and crop yield.Front Microbiol. 2023 Feb 16;14:1095688. doi: 10.3389/fmicb.2023.1095688. eCollection 2023. Front Microbiol. 2023. PMID: 36910216 Free PMC article.
-
Microbial Community Dynamics of Soybean (Glycine max) Is Affected by Cropping Sequence.Front Microbiol. 2021 Feb 11;12:632280. doi: 10.3389/fmicb.2021.632280. eCollection 2021. Front Microbiol. 2021. PMID: 33643263 Free PMC article.
-
Soybean Roots and Soil From High- and Low-Yielding Field Sites Have Different Microbiome Composition.Front Microbiol. 2021 Nov 30;12:675352. doi: 10.3389/fmicb.2021.675352. eCollection 2021. Front Microbiol. 2021. PMID: 34917042 Free PMC article.
-
Unprecedented bacterial community richness in soybean nodules vary with cultivar and water status.Microbiome. 2019 Apr 16;7(1):63. doi: 10.1186/s40168-019-0676-8. Microbiome. 2019. PMID: 30992078 Free PMC article.
-
Metabolomics as a Tool to Study Underused Soy Parts: In Search of Bioactive Compounds.Foods. 2021 Jun 7;10(6):1308. doi: 10.3390/foods10061308. Foods. 2021. PMID: 34200265 Free PMC article. Review.
Cited by
-
Foliar phenols and flavonoids level in pteridophytes: an insight to culturable fungal endophyte colonisation.Arch Microbiol. 2024 Mar 15;206(4):170. doi: 10.1007/s00203-024-03880-1. Arch Microbiol. 2024. PMID: 38491263
-
Temporal dynamics and tissue-specific variations of the blueberry phyllosphere mycobiome.Hortic Res. 2025 Feb 12;12(5):uhaf042. doi: 10.1093/hr/uhaf042. eCollection 2025 May. Hortic Res. 2025. PMID: 40236731 Free PMC article.
-
Biostimulant Effects of Chaetomium globosum and Minimedusa polyspora Culture Filtrates on Cichorium intybus Plant: Growth Performance and Metabolomic Traits.Front Plant Sci. 2022 May 12;13:879076. doi: 10.3389/fpls.2022.879076. eCollection 2022. Front Plant Sci. 2022. PMID: 35646045 Free PMC article.
-
Non-target impacts of fungicide disturbance on phyllosphere yeasts in conventional and no-till management.ISME Commun. 2022;2(1):19. doi: 10.1038/s43705-022-00103-w. Epub 2022 Feb 23. ISME Commun. 2022. PMID: 36404932 Free PMC article.
-
Soil Origin and Plant Genotype Modulate Switchgrass Aboveground Productivity and Root Microbiome Assembly.mBio. 2022 Apr 26;13(2):e0007922. doi: 10.1128/mbio.00079-22. Epub 2022 Apr 6. mBio. 2022. PMID: 35384699 Free PMC article.
References
-
- Beare M. H., Hu S., Coleman D. C., Hendrix P. F. (1997). Influences of mycelial fungi on soil aggregation and organic matter storage in conventional and no-tillage soils. Agric. Ecosyst. Environ. Appl. Soil Ecol. 5 211–219. 10.1016/S0929-1393(96)00142-4 - DOI
Grants and funding
LinkOut - more resources
Full Text Sources