

Picocyanobacteria Community and Cyanophage Infection Responses to Nutrient Enrichment in a Mesocosms Experiment in Oligotrophic Waters
- PMID: 32582095
- PMCID: PMC7283753
- DOI: 10.3389/fmicb.2020.01153
Picocyanobacteria Community and Cyanophage Infection Responses to Nutrient Enrichment in a Mesocosms Experiment in Oligotrophic Waters
Abstract
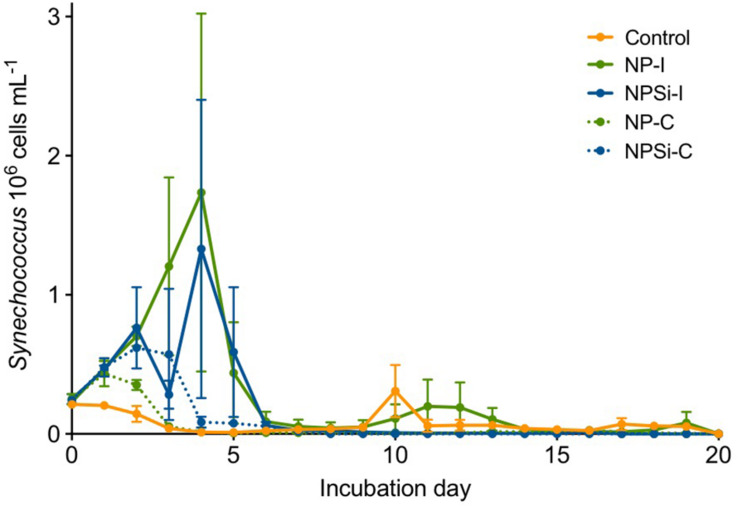
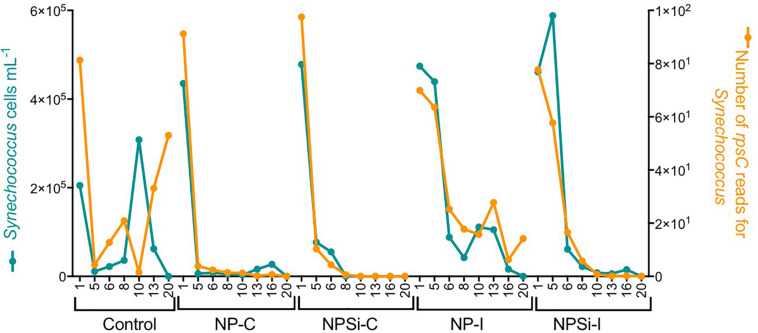
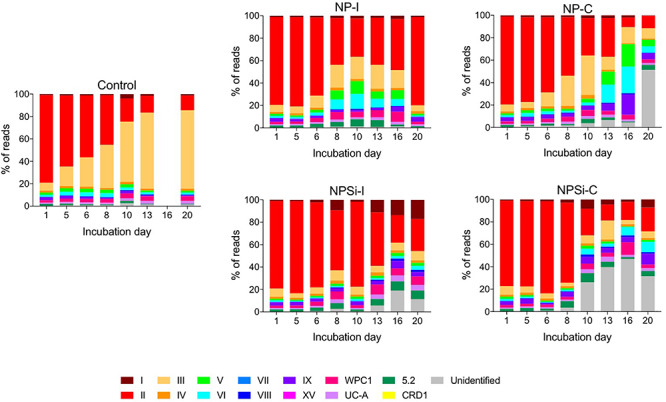
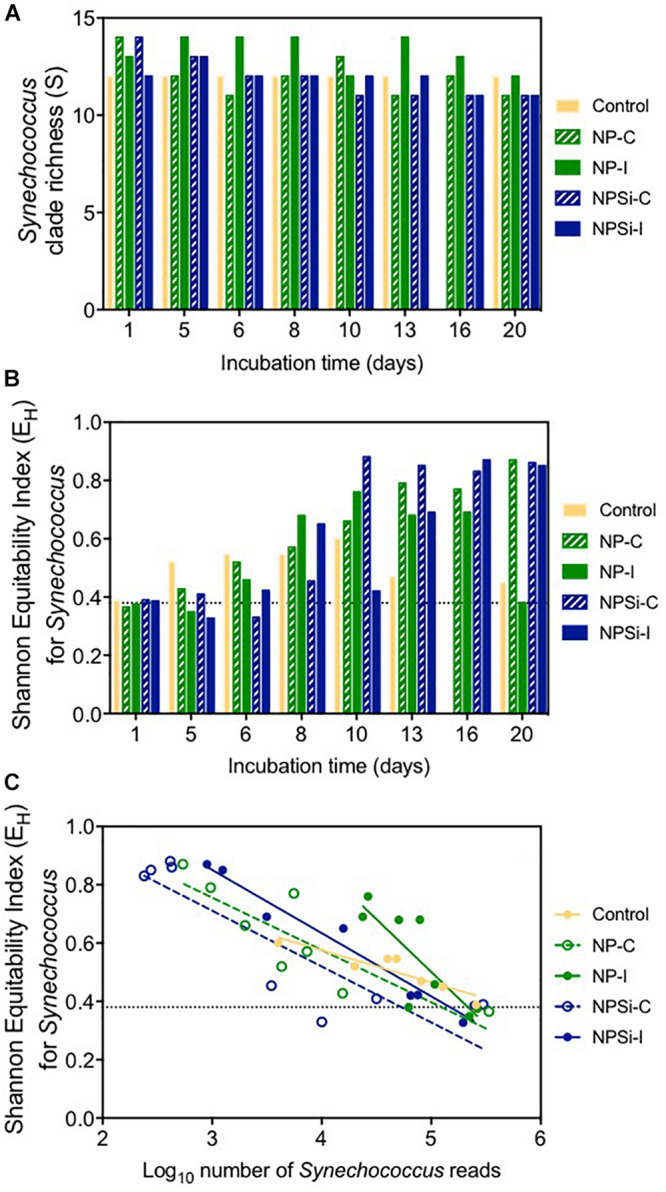
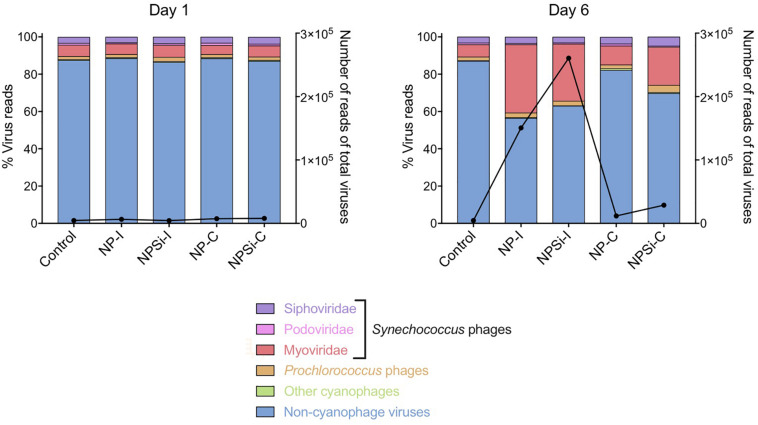
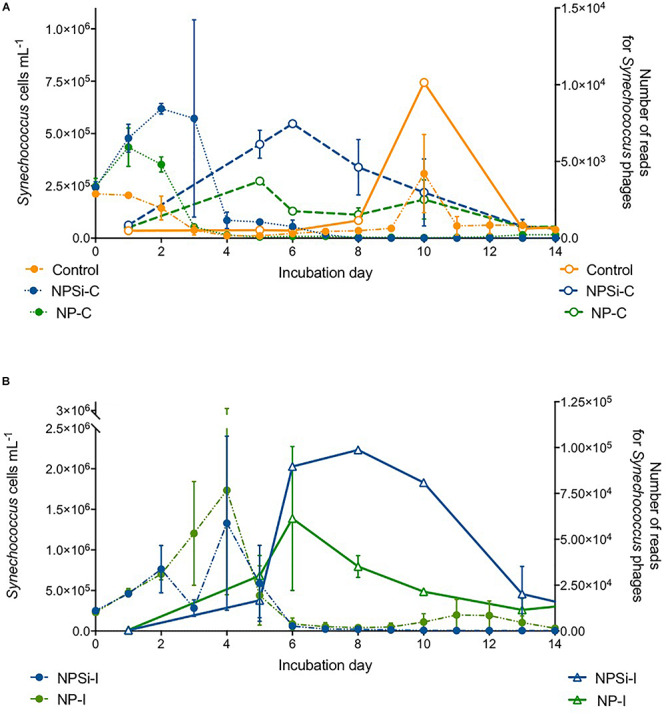
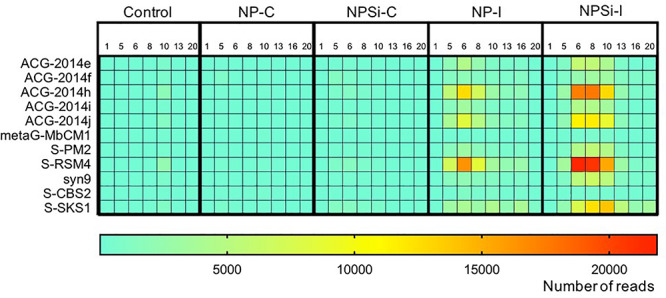
Prochlorococcus and Synechococcus are pico-sized cyanobacteria that play a fundamental role in oceanic primary production, being particularly important in warm, nutrient-poor waters. Their potential response to nutrient enrichment is expected to be contrasting and to differ from larger phytoplankton species. Here, we used a metagenomic approach to characterize the responses to nutrient enrichment in the community of picocyanobacteria and to analyze the cyanophage response during a mesocosms experiment in the oligotrophic Red Sea. Natural picoplankton community was dominated by Synechococcus clade II, with marginal presence of Prochlorococcus (0.3% bacterial reads). Increased nutrient input triggered a fast Synechococcus bloom, with clade II being the dominant, with no response of Prochlorococcus growth. The largest bloom developed in the mesocosms receiving a single initial input of nutrients, instead of daily additions. The relative abundances of cyanophage sequences in cellular metagenomes increased during the experiment from 12.6% of total virus reads up to 40% in the treatment with the largest Synechococcus bloom. The subsequent collapse of the bloom pointed to a cyanophage infection on Synechococcus that reduced its competitive capacity, and was then followed by a diatom bloom. The cyanophage attack appears to have preferentially affected the most abundant Synechococcus clade II, increasing the evenness within the host population. Our results highlight the relevance of host-phage interactions on determining population dynamics and diversity of Synechococcus populations.
Keywords: Synechococcus; bloom; clade; cyanophages; metagenomics.
Copyright © 2020 Coello-Camba, Diaz-Rua, Duarte, Irigoien, Pearman, Alam and Agusti.
Figures
Similar articles
-
Occurrence and diversity of viruses associated with cyanobacterial communities in a Brazilian freshwater reservoir.Braz J Microbiol. 2021 Jun;52(2):773-785. doi: 10.1007/s42770-021-00473-8. Epub 2021 Mar 31. Braz J Microbiol. 2021. PMID: 33791954 Free PMC article.
-
Metagenomic Analysis of the Indian Ocean Picocyanobacterial Community: Structure, Potential Function and Evolution.PLoS One. 2016 May 19;11(5):e0155757. doi: 10.1371/journal.pone.0155757. eCollection 2016. PLoS One. 2016. PMID: 27196065 Free PMC article.
-
Diverse Marine T4-like Cyanophage Communities Are Primarily Comprised of Low-Abundance Species Including Species with Distinct Seasonal, Persistent, Occasional, or Sporadic Dynamics.Viruses. 2023 Feb 20;15(2):581. doi: 10.3390/v15020581. Viruses. 2023. PMID: 36851794 Free PMC article.
-
Functional characterisation of substrate-binding proteins to address nutrient uptake in marine picocyanobacteria.Biochem Soc Trans. 2021 Dec 17;49(6):2465-2481. doi: 10.1042/BST20200244. Biochem Soc Trans. 2021. PMID: 34882230 Free PMC article. Review.
-
Phages of the marine cyanobacterial picophytoplankton.FEMS Microbiol Rev. 2003 Apr;27(1):17-34. doi: 10.1016/S0168-6445(03)00016-0. FEMS Microbiol Rev. 2003. PMID: 12697340 Review.
Cited by
-
Genomes of Prochlorococcus, Synechococcus, bacteria, and viruses recovered from marine picocyanobacteria cultures based on Illumina and Qitan nanopore sequencing.Sci Data. 2025 Apr 12;12(1):612. doi: 10.1038/s41597-025-04762-x. Sci Data. 2025. PMID: 40221485 Free PMC article.
-
Changes in the Top-Down Control of Planktonic Bacteria in Response to Nutrient Addition and Warming in the Red Sea.Environ Microbiol Rep. 2025 Aug;17(4):e70166. doi: 10.1111/1758-2229.70166. Environ Microbiol Rep. 2025. PMID: 40751381 Free PMC article.
-
Characterization and genomic analysis of a novel Synechococcus phage S-H9-2 belonging to Bristolvirus genus isolated from the Yellow Sea.Virus Res. 2023 Apr 15;328:199072. doi: 10.1016/j.virusres.2023.199072. Epub 2023 Feb 26. Virus Res. 2023. PMID: 36781075 Free PMC article.
-
Phage strategies facilitate bacterial coexistence under environmental variability.PeerJ. 2021 Nov 4;9:e12194. doi: 10.7717/peerj.12194. eCollection 2021. PeerJ. 2021. PMID: 34760346 Free PMC article.
-
Temperature Responses of Heterotrophic Bacteria in Co-culture With a Red Sea Synechococcus Strain.Front Microbiol. 2021 May 10;12:612732. doi: 10.3389/fmicb.2021.612732. eCollection 2021. Front Microbiol. 2021. PMID: 34040590 Free PMC article.
References
-
- Agawin N. S., Agustí S., Duarte C. M. (2002). Abundance of Antarctic picophytoplankton and their response to light and nutrient manipulation. Aquat. Microb. Ecol. 29 161–172. 10.3354/ame029161 - DOI
-
- Agawin N. S., Duarte C. M., Agustí S. (2000). Response of Mediterranean Synechococcus growth and loss rates to experimental nutrient inputs. Mar. Ecol. Prog. Ser. 206 97–106. 10.3354/meps206097 - DOI
-
- Agawin N. S., Duarte C. M., Agustí S., Vaqué D. (2004). Effect of N: P ratios on response of Mediterranean picophytoplankton to experimental nutrient inputs. Aquat. Microb. Ecol. 34 57–67. 10.3354/ame034057 - DOI
LinkOut - more resources
Full Text Sources