. 2020 Jun 3:11:1165.
doi: 10.3389/fmicb.2020.01165. eCollection 2020.

Cryoconite Hole Location in East-Antarctic Untersee Oasis Shapes Physical and Biological Diversity

Affiliations

Cryoconite Hole Location in East-Antarctic Untersee Oasis Shapes Physical and Biological Diversity

Klemens Weisleitner et al. Front Microbiol. .

Abstract

Antarctic cryoconite holes (CHs) are mostly perennially ice-lidded and sediment-filled depressions that constitute important features on glaciers and ice sheets. Once being hydrologically connected, these microbially dominated mini-ecosystems provide nutrients and biota for downstream environments. For example, the East Antarctic Anuchin Glacier gradually melts into the adjacent perennially ice-covered Lake Untersee, and CH biota from this glacier contribute up to one third of the community composition in benthic microbial mats within the lake. However, biogeochemical features of these CHs and associated spatial patterns across the glacier are still unknown. Here we hypothesized about the CH minerogenic composition between the different sources such as the medial moraine and other zones. Further, we intended to investigate if the depth of the CH mirrors the CH community composition, organic matter (OM) content and would support productivity. In this study we show that both microbial communities and biogeochemical parameters in CHs were significantly different between the zones medial moraine and the glacier terminus. Variations in microbial community composition are the result of factors such as depth, diameter, organic matter, total carbon, particle size, and mineral diversity. More than 90% of all ribosomal sequence variants (RSV) reads were classified as Proteobacteria, Cyanobacteria, Bacteroidetes, Actinobacteria, and Acidobacteria. Archaea were detected in 85% of all samples and exclusively belonged to the classes Halobacteria, Methanomicrobia, and Thermoplasmata. The most abundant genus was Halorubrum (Halobacteria) and was identified in nine RSVs. The core microbiome for bacteria comprised 30 RSVs that were affiliated with Cyanobacteria, Bacteroidetes, Actinobacteria, and Proteobacteria. The archaeal fraction of the core microbiome consisted of three RSVs belonging to unknown genera of Methanomicrobiales and Thermoplasmatales and the genus Rice_Cluster_I (Methanocellales). Further, mean bacterial carbon production in cryoconite was exceptionally low and similar rates have not been reported elsewhere. However, bacterial carbon production insignificantly trended toward higher rates in shallow CHs and did not seem to be supported by accumulation of OM and nutrients, respectively, in deeper holes. OM fractions were significantly different between shallower CHs along the medial moraine and deeper CHs at the glacier terminus. Overall, our findings suggest that wind-blown material originating south and southeast of the Anuchin Glacier and deposits from a nunatak are assumed to be local inoculation sources. High sequence similarities between samples from the Untersee Oasis and other Antarctic sites further indicate long-range atmospheric transport mechanisms that complement local inoculation sources.

Keywords: 16S rRNA; Anuchin Glacier; archaea; bacterial activity; biogeochemistry; cryoconite holes; mineralogy.


Figures

FIGURE 1
FIGURE 1
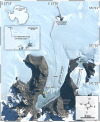
Map of the study site. The insert map indicates the position of the study site in context with the Schirmacher Oasis. Lake Untersee (610 m a.s.l.) and Lake Obersee (805 m a.s.l.) are partly connected by the Anuchin Glacier. The position of the sampling sites for CHs (zone “medial moraine”: AMH, AML, zone “glacier terminus”: ANR, WIP) are indicated in the map. The green star shows the location of a meteorological station and the yellow ellipse depicts the position of the campsite during the expedition. The dashed line along the glacier indicates the position of the medial moraine. The flow directions of the Anuchin Glacier and the “Obersee Glacier” are indicated by dashed arrows. The image was captured by the Landsat 8 satellite on 09 MARCH 2019 (download via Earth Explorer by United States Geographical Survey). The true color image (4-3-2 RGB, 30 m px– 1) was combined with the high-resolution band 8 (grayscale, 15 m px–1).
FIGURE 2
FIGURE 2
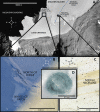
(A) Aerial image of Lake Untersee and the lower part of the Anuchin Glacier (Bundesamt für Kartographie und Geodäsie, Frankfurt am Main, Germany). The medial moraine is indicated by a dashed blue line. The glacier-lake interface is indicated by a gray dashed line. (B) Aerial overview of the zone “glacier terminus.” (C) Level and contrast enhanced aerial image showing a representative site along the medial moraine. (D) Typical morphology of an ice-lidded cryoconite hole from the Anuchin Glacier. Note that the orientations in Figures 2A–C differ from each other.
FIGURE 3
FIGURE 3
(A) Site occurrences of minerals based on XRD measurements. (B) Ternary plot of particle sizes. Size classes were combined to capture all data within one plot (x ≤ 10 μm + 10 – 40 μm, y = 40 – 100 μm, z = 100 – 400 μm + >400 μm). Note that the z-axis is scaled with factor 0.1.
FIGURE 4
FIGURE 4
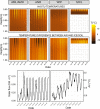
Top row: Temperature time series of interpolated depth gradient. Temperature loggers were installed at 0, 0.5, and 1.0 m deep in the ice covers, respectively. Temperature probes for the soil time series were buried at 0.01, 0.1, and 0.22 m depth. Bottom row: Temperature differences between air temperature and CH/soil.
FIGURE 5
FIGURE 5
Selected variables plotted along against depth. Marginal plots indicate the sample distribution for each variable.
FIGURE 6
FIGURE 6
Boxplots of selected variables. Note that sample CRY-7 was identified as outlier and hence was excluded from the boxplots and statistical analysis for organic matter.
FIGURE 7
FIGURE 7
Principal component analysis of the CH dataset (excluding 16S rRNA amplicon data). Circles and triangles represent samples from the glacier terminus and the medial moraine, respectively. Dashed lines serve as a visual guidance.
FIGURE 8
FIGURE 8
(A) Relative abundance of the 100 most abundant RSVs categorized by their respective phyla. (B) Relative abundance of all archaea-related RSVs at family level. The upper two bar charts represent samples from the medial moraine and the lower bar charts depict samples from the glacier terminus.
FIGURE 9
FIGURE 9
PCoA plot based on Bray–Curtis distance matrix calculated from the RSV table. Circles and triangles represent samples from the glacier terminus and the medial moraine, respectively. Dashed lines serve as a visual guidance.
FIGURE 10
FIGURE 10
Relative abundance of major phyla across a depth gradient. The borders of the colored areas indicate the outermost data points.

References

    1. Aislabie J. M., Lau A., Dsouza M., Shepherd C., Rhodes P., Turner S. J. (2013). Bacterial composition of soils of the Lake Wellman area, Darwin Mountains, Antarctica. Extremophiles 17 775–786. 10.1007/s00792-013-0560-6 - DOI - PubMed
    1. Aislabie J., Ryburn J., Sarmah A. (2009). Culturable microbes in shallow groundwater underlying ornithogenic soil of Cape Hallett, Antarctica. Can. J. Microbiol. 55, 12–20. 10.1139/W08-118 - DOI - PubMed
    1. Andersen D. T., McKay C. P., Lagun V. (2015). Climate conditions at perennially ice-covered Lake Untersee, East Antarctica. J. Appl. Meteorol. Climatol. 54 1393–1412. 10.1175/jamc-d-14-0251.1 - DOI
    1. Andersen D. T., Sumner D. Y., Hawes I., Webster-Brown J., Mckay C. P. (2011). Discovery of large conical stromatolites in Lake Untersee, Antarctica. Geobiology 9 280–293. 10.1111/j.1472-4669.2011.00279.x - DOI - PubMed
    1. Anesio A. M., Bellas C. M. (2011). Are low temperature habitats hot spots of microbial evolution driven by viruses? Trends Microbiol. 19 52–57. 10.1016/j.tim.2010.11.002 - DOI - PubMed

LinkOut - more resources